
Table 1
Primers and probes sequence data applied in current research for real-time PCR resistotyping of S. aureus
| Target gene symbol | Primer and probe sequences 5ʹ | Nucleotide positions | Aliases | Product size (BasePair) | Source |
|---|---|---|---|---|---|
| nuc | Forward primer: GTTGATACACCTGAAACAAAGCA | 352-374 | SAR0847 | 156 | Current study |
| Reverse primer: CGCTAAGCCACGTCCATATTTAT | 507-485 | ||||
| Probe: VIC-GGTCCTGAAGCAAGTGCATT-BHQ1 | 400-419 | ||||
| mecA | Forward primer: GGAATGCAGAAAGACCAAAGC | 406-426 | SABB_RS00325 | 126 | Current study |
| Reverse primer: CTTTGGAACGATGCCTATCTCA | 531-510 | ||||
| Probe: FAM-TGGCCAATACAGGAACAGCA-BHQ1 | 488-507 |
 3ʹ
3ʹ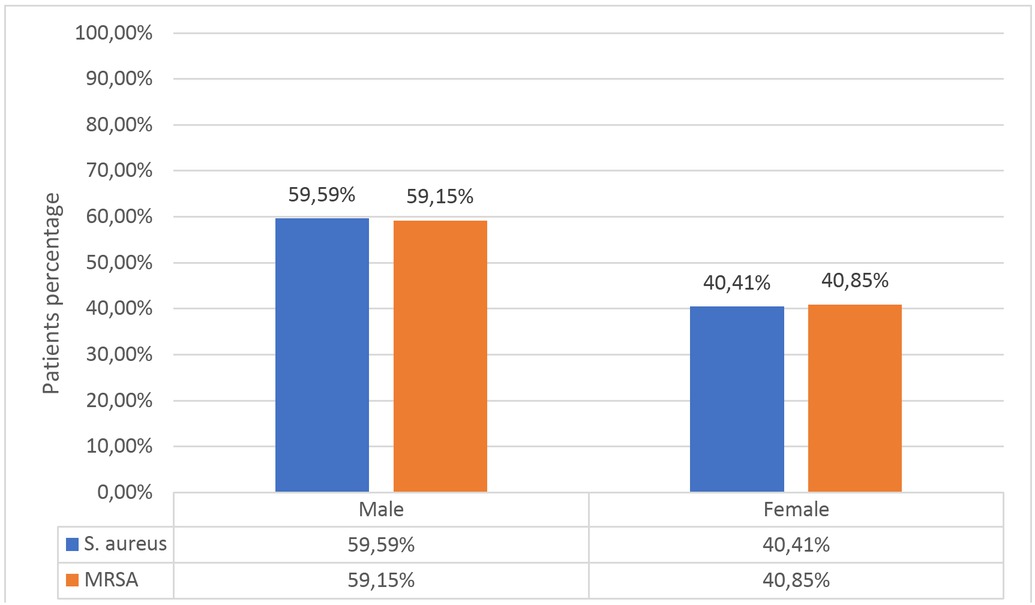
Figure 1
A distribution of MRSA among patients
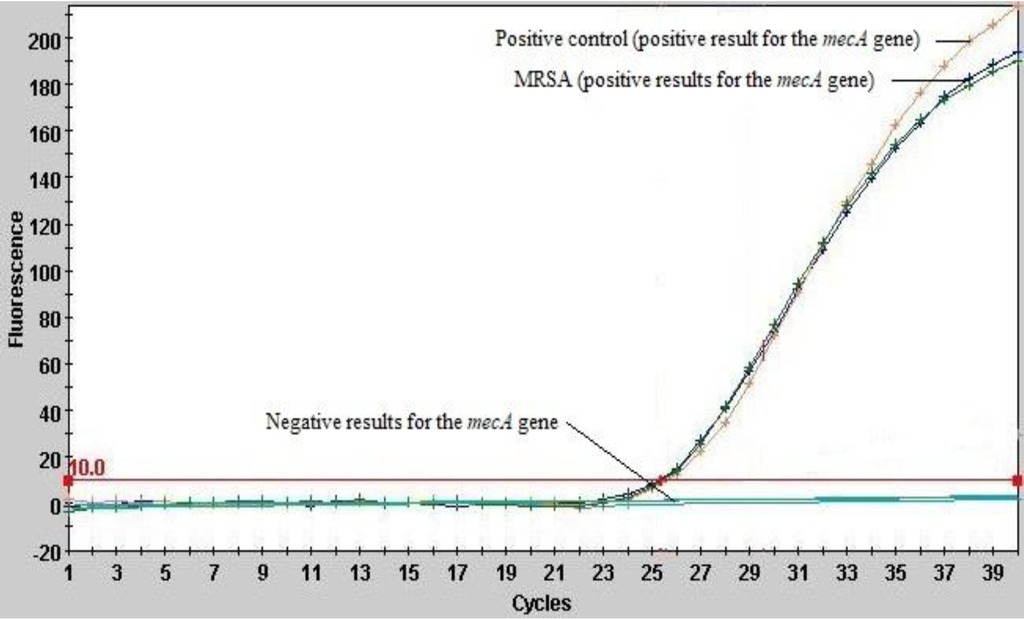
Figure 2
The FAM channel of real-time PCR runs for the three specimens, and two controls (negative control and positive control). The progress of the amplification was shown by the three colored curves, one of which was positive control (red curve) and the other was positive results for the mecA gene (MRSA), and the two lines that appeared below the threshold line represent negative results for the mecA gene and the negative control
Table 2
Real-time PCR test sensitivity, specificity, accuracy, and predictive values were measured in 142 MRSA and 34 control subjects
| True positive* | False negative* | True negative* | False positive* | Sensitivity* | Specificity* | Accuracy* | Predictive value of positive result* | Predictive value of negative result* |
|---|---|---|---|---|---|---|---|---|
| 138 | 4 | 34 | 0 | 97% | 100% | 98% | 100% | 89% |