
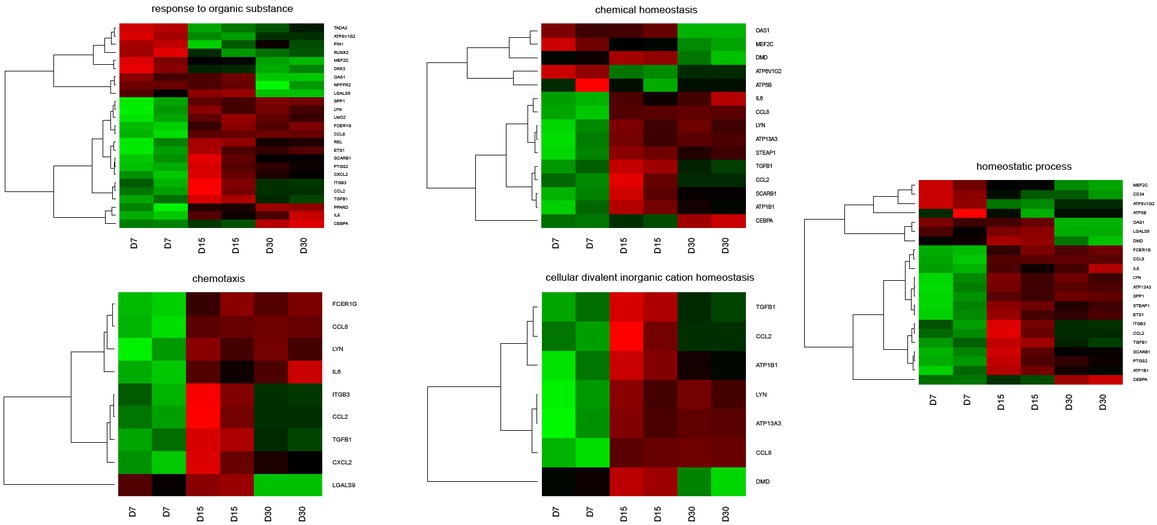
Figure 1
Heat map representation of differentially expressed genes belonging to the “cellular divalent inorganic cation homeostasis”, “chemical homeostasis”, “chemotaxis”, “homeostatic process” and “response to organic substance” GO BP terms. Arbitrary signal intensity acquired from microarray analysis is represented by colours (green, higher; red, lower expression). Log2 signal intensity values for any single gene were resized to Row Z-Score scale (from -2, the lowest expression to +2, the highest expression for single gene)
Table 1
Gene symbols, Entrez gene IDs, ratio and corrected P values of studied genes
| GENE SYMBOL | GENE ID | RATIO D7/D15 | RATIO D7/D30 | P VAL D7/D15 | P VAL D7/D30 | MEAN RATIO |
|---|---|---|---|---|---|---|
| SPP1 | 397087 | -10.87016565 | -14.2538617 | 0.016271204 | 0.023019379 | -12.56201368 |
| CCL8 | 100302703 | -9.10436286 | -9.846671298 | 0.009909162 | 0.002855033 | -9.475517079 |
| CXCL2 | 414904 | -6.305216475 | -2.763765187 | 0.028210571 | 0.100060673 | -4.534490831 |
| PTGS2 | 397590 | -5.663189033 | -3.05066486 | 0.033272153 | 0.086182814 | -4.356926947 |
| ATP13A3 | 100522900 | -3.576872002 | -3.427204735 | 0.033844567 | 0.040686213 | -3.502038369 |
| PPARD | 397671 | -2.416675019 | -4.005391116 | 0.052006062 | 0.023501509 | -3.211033067 |
| ATP1B1 | 396898 | -3.743863827 | -2.010447374 | 0.031118493 | 0.123030328 | -2.8771556 |
| CCL2 | 397422 | -3.929361381 | -1.450779929 | 0.040743821 | 0.404390916 | -2.690070655 |
| LYN | 100152890 | -2.52053573 | -2.454535196 | 0.034636492 | 0.04233411 | -2.487535463 |
| REL | 100525104 | -3.00471739 | -1.96555405 | 0.023427948 | 0.05637387 | -2.48513572 |
| FCER1G | 397406 | -2.351156762 | -2.404588058 | 0.026835676 | 0.023565415 | -2.37787241 |
| ETS1 | 100302363 | -2.513407982 | -2.150521983 | 0.031118493 | 0.047472133 | -2.331964982 |
| SCARB1 | 397018 | -2.623056585 | -1.681749941 | 0.034636492 | 0.134327075 | -2.152403263 |
| STEAP1 | 397573 | -2.349620022 | -1.88662936 | 0.026835676 | 0.044202404 | -2.118124691 |
| ITGB3 | 397063 | -2.917250333 | -1.311025215 | 0.038898003 | 0.421388587 | -2.114137774 |
| IL6 | 399500 | -1.793617663 | -2.249334565 | 0.088464766 | 0.044202404 | -2.021476114 |
| LMO2 | 100512825 | -2.0687671 | -1.856369805 | 0.026835676 | 0.034894667 | -1.962568452 |
| TGFB1 | 397078 | -2.253272341 | -1.226316922 | 0.015016424 | 0.216600729 | -1.739794631 |
| CEBPA | 397307 | -1.147965724 | -2.175053003 | 0.320782294 | 0.017618993 | -1.661509363 |
| DMD | 497636 | -1.603674593 | 1.631209228 | 0.072461804 | 0.068161696 | 0.013767318 |
| LGALS9 | 396972 | -1.572710066 | 2.910882324 | 0.1398614 | 0.023501509 | 0.669086129 |
| ATP5B | 100157156 | 1.122331171 | 1.073246663 | 0.482886753 | 0.62979588 | 1.097788917 |
| NPFFR2 | --- | 1.044570266 | 2.010006004 | 0.826996209 | 0.026707771 | 1.527288135 |
| OAS1 | --- | 1.023318222 | 2.255519223 | 0.911552638 | 0.023019379 | 1.639418722 |
| PIN1 | 100512827 | 2.022694206 | 1.581852096 | 0.04252503 | 0.117593514 | 1.802273151 |
| DKK3 | 664653 | 1.778040065 | 2.362675908 | 0.0466037 | 0.023501509 | 2.070357987 |
| ATP6V1G2 | 100152358 | 2.346891412 | 1.83072396 | 0.013032038 | 0.023501509 | 2.088807686 |
| TADA3 | 100157464 | 2.510073124 | 1.977935459 | 0.015016424 | 0.024934184 | 2.244004291 |
| MEF2C | 733590 | 1.801279355 | 3.223918682 | 0.081198998 | 0.023501509 | 2.512599019 |
| RUNX2 | 100737965 | 2.658456436 | 2.666226873 | 0.04252503 | 0.047472133 | 2.662341655 |
| CD34 | 397160 | 2.363067501 | 3.093363256 | 0.052291352 | 0.034894667 | 2.728215378 |
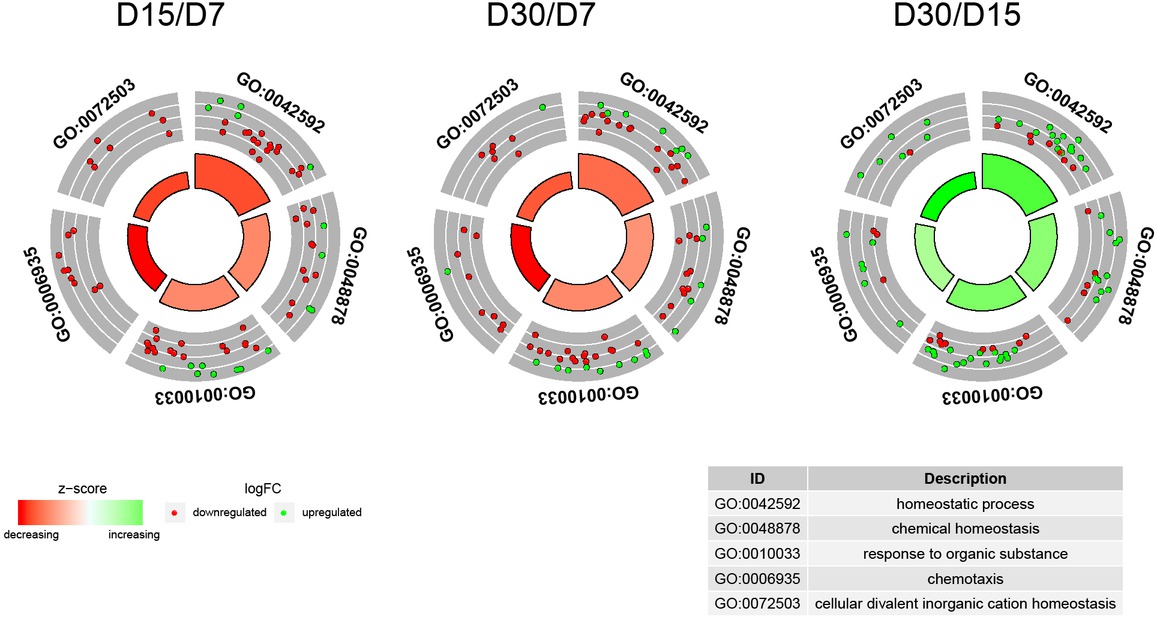
Figure 2
The circle plot showing the differently expressed genes and z-score of the “cellular divalent inorganic cation homeostasis”, “chemical homeostasis”, “chemotaxis”, “homeostatic process” and “response to organic substance” GO BP terms. The outer circle shows a scatter plot for each term of the fold change of the assigned genes. Green circles display up- regulation and red ones down- regulation. The inner circle shows the z-score of each GO BP term. The width of the each bar corresponds to the number of genes within GO BP term and the color corresponds to the z-score
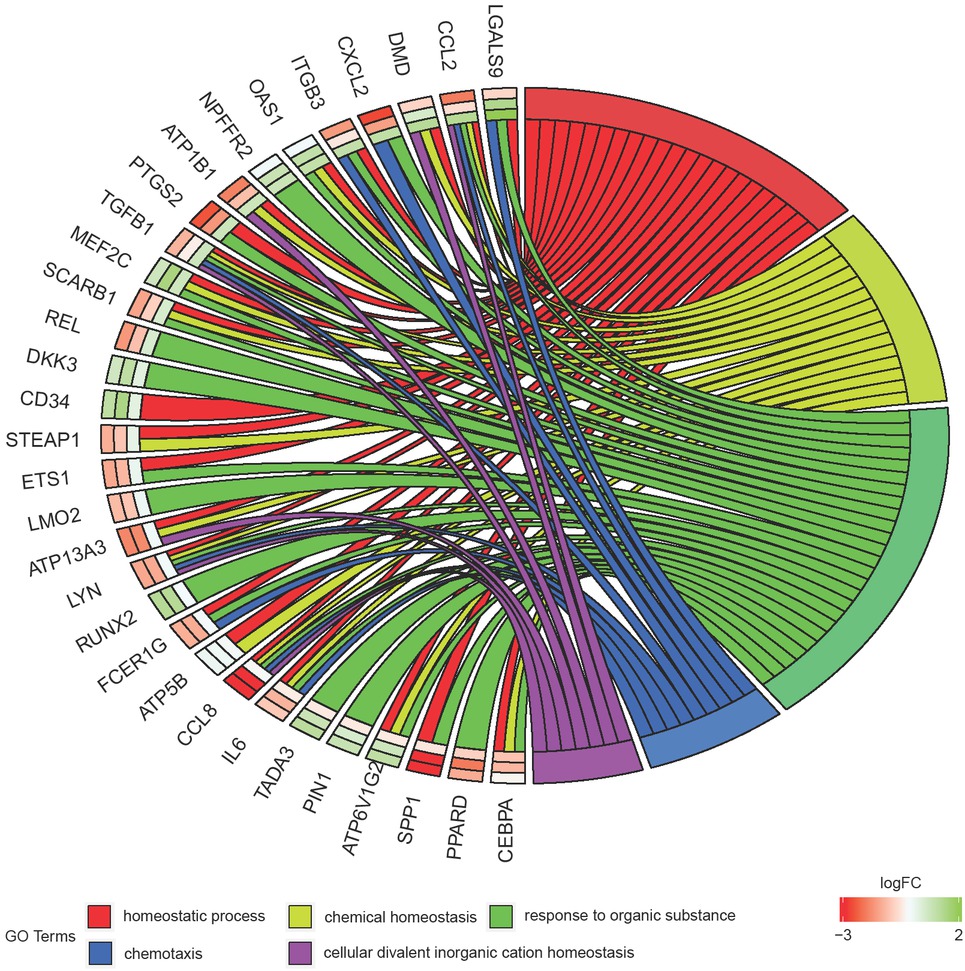
Figure 3
The representation of the mutual relationship of differently expressed genes “cellular divalent inorganic cation homeostasis”, “chemical homeostasis”, “chemotaxis”, “homeostatic process” and “response to organic substance” GO BP terms. The ribbons indicate which gene belongs to which categories. The middle circle represents logarithm from fold change (LogFC) between D15/D7, D30/D7 and D30/D15 respectively. The color of each block corresponds to the LogFC of each gene (green – upregulated, red – downregulated). The genes were sorted by logFC from most to least changed gene
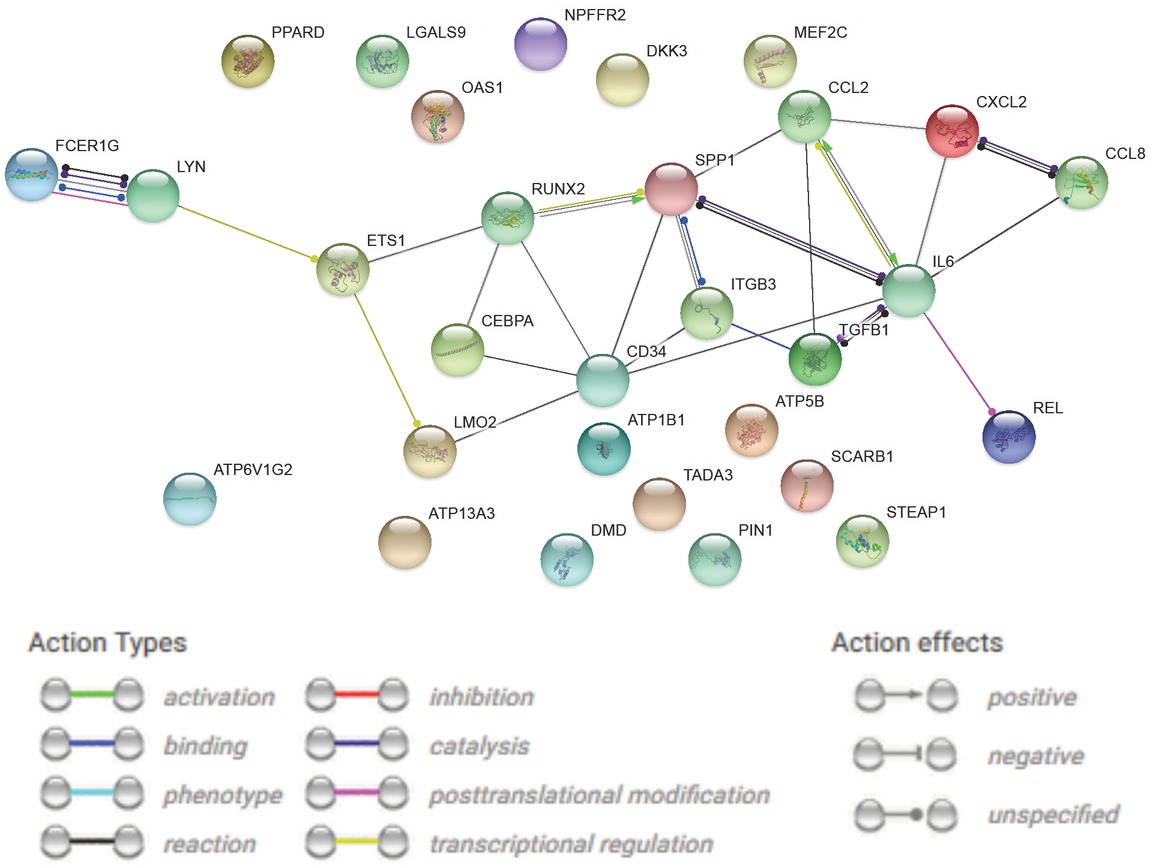
Figure 4
Heatmap showing the gene occurrence between genes that belongs to GO BP terms. The yellow color is associated with gene occurrence in the GO Term. The intensity of the color is corresponding to amount of GO BP terms that each gene belongs to

Figure 5
STRING-generated interaction occurrence differently expressed genes that belongs to the “cellular divalent inorganic cation homeostasis”, “chemical homeostasis”, “chemotaxis”, “homeostatic process” and “response to organic substance” GO BP terms. The intensity of the edges reflects the interaction. The explanation of each symbol is included on the legend included in figure