
Table 1.
Patient's characteristics
| Variables | Control (n = 43) | Endometriosis (n = 44) | Pc |
|---|---|---|---|
| Age (years)a | 31 (28–36) | 30 (28–33) | 0.580 |
| Body mass index (BMI)a | 22.80 (20.40–25.30) | 23.20 (20.40–26.50) | 0.544 |
| Dymenorrheab,d | 0.134 | ||
| Yes | 16 (37.21%) | 24 (54.55%) | |
| No | 27 (62.79%) | 20 (45.45%) | |
| Dyspareuniab,d | 0.229 | ||
| Yes | 4 (9.30%) | 9 (20.46%) | |
| No | 39 (90.69%) | 35 (79.54%) | |
| rASRM scorea | N/A | ||
| Endometriosis score | N/A | 22 (8.00–47.50) | |
| Adhesion score | 9.50 (2.25–17.25) | ||
| Total EFI scorea | N/A | 5.50 (4–7) | N/A |
| Menstrual cycleb | 0.391 | ||
| Follicular | 17 (39.53%) | 22 (50.00%) | |
| Luteal | 26 (60.46%) | 22 (50.00%) |
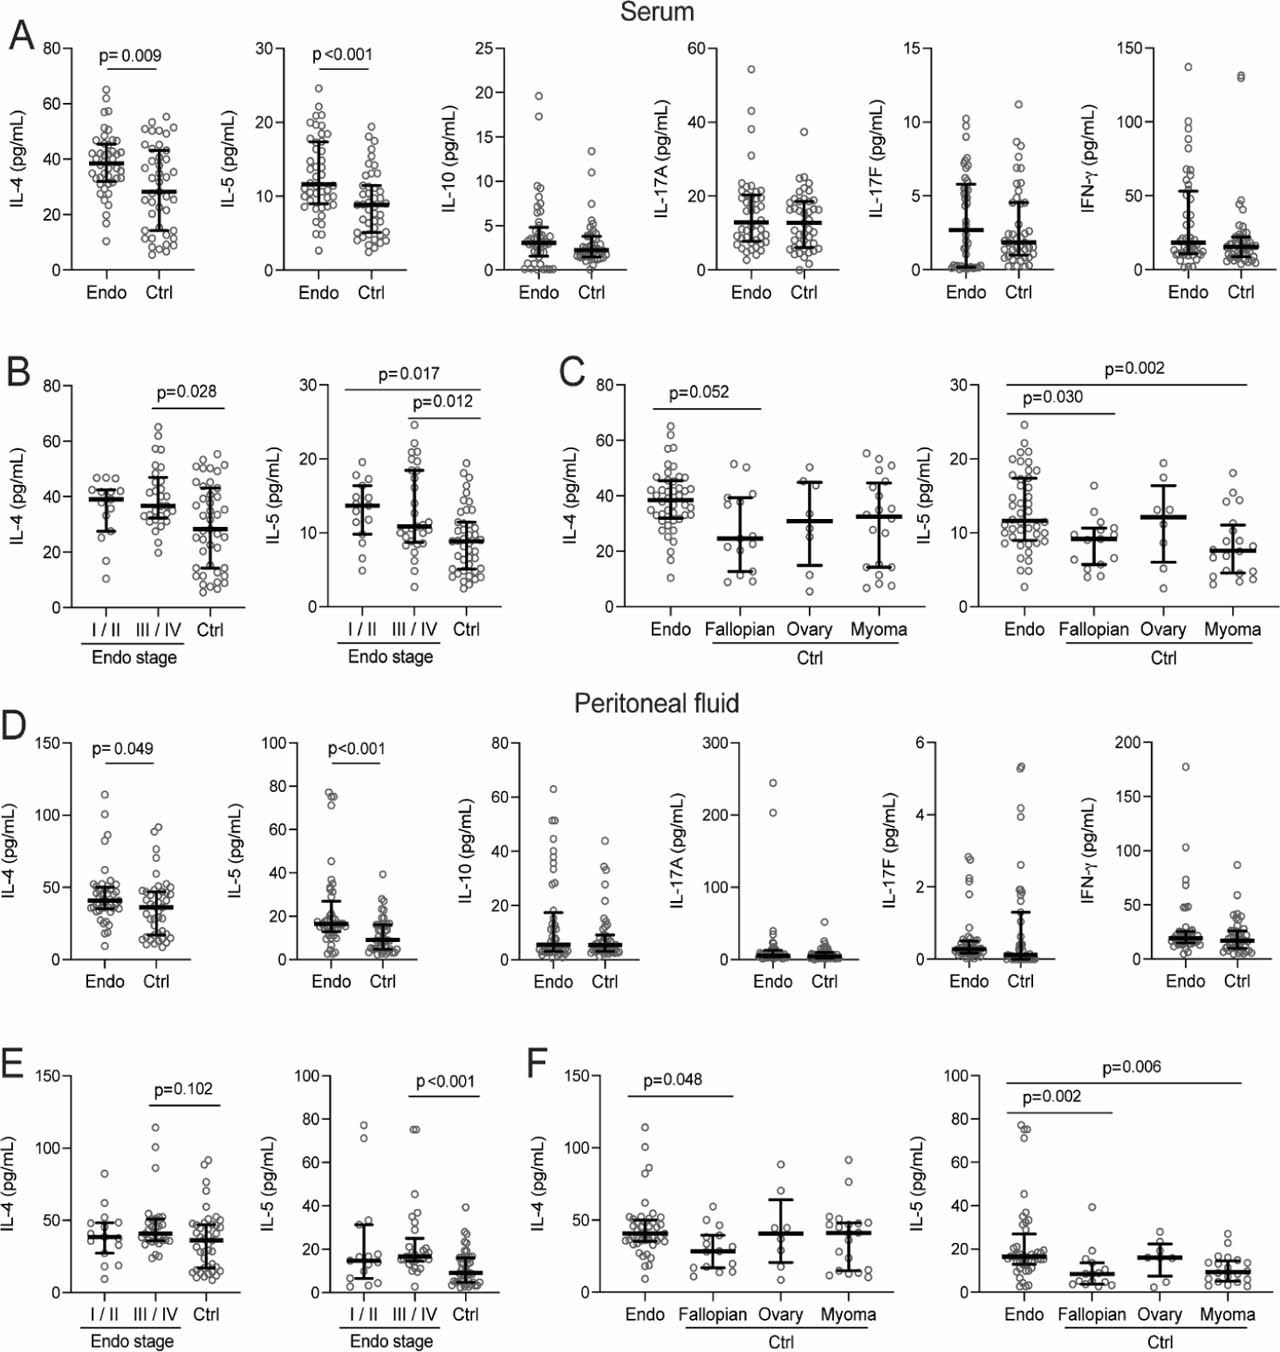
Figure 1.
Serum and peritoneal Th cytokine levels in endometriosis and gynecologic control patients. Scatter plots of (A) serum and (D) peritoneal IL-4, IL-5, IL-10, IL-17A, IL-17F, and IFN-γ levels in endometriosis and control groups. (B) Serum and (E) peritoneal IL-4 and IL-5 levels stratified by disease stage (stage I/II and III/IV) compared to control cases. (C) Serum and (F) peritoneal IL-4 and IL-5 levels in different control subgroups-fallopian, ovary, and myoma-compared to endometriosis. A dot represents each subject. P-values are indicated. Endo, Endometriosis group. Ctrl, Control group. Th, T helper.
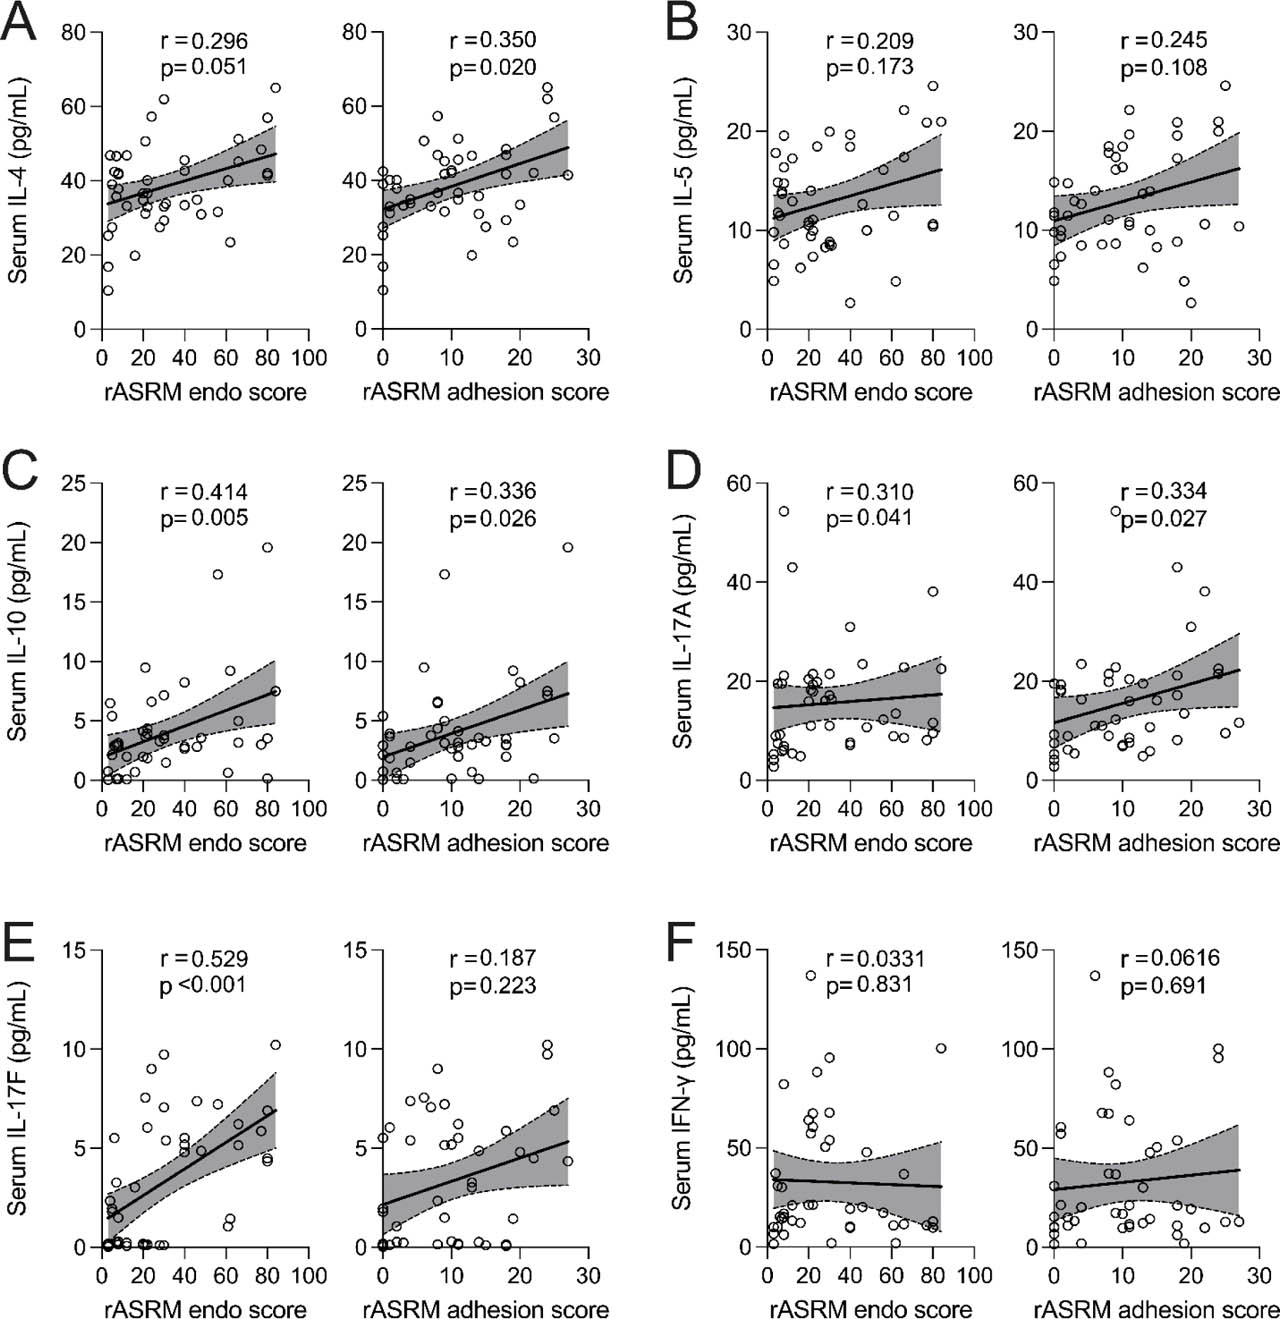
Figure 2.
Spearman correlation analysis between serum cytokine levels and rASRM scores. Correlations between (A) IL-4, (B) IL-5, (C) IL-10, (D) IL-17A, (E) IL-17F, and (F) IFN-γ levels with rASRM endometriosis and adhesion scores. Rho (r) and P-values are indicated. rASRM, revised American Society for Reproductive Medicine.
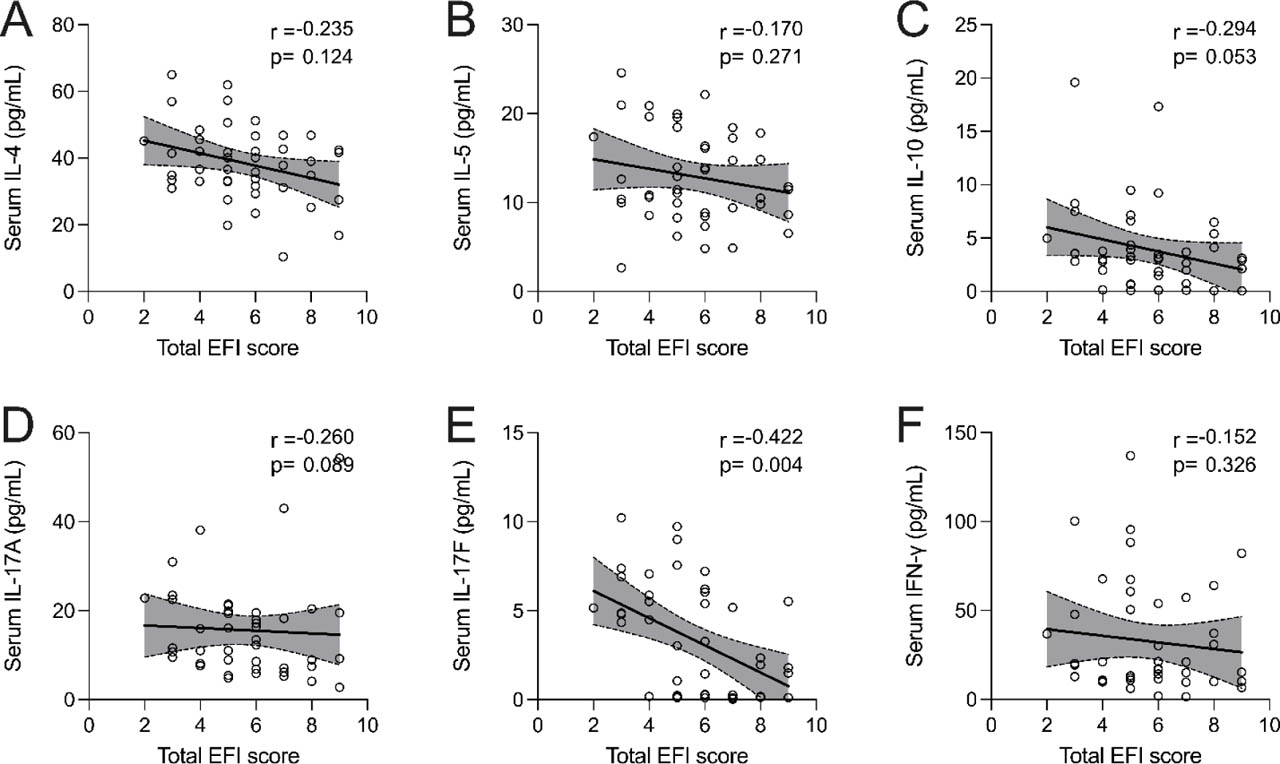
Figure 3.
Spearman correlation analysis between serum cytokine levels and EFI scores. Correlations between (A) IL-4, (B) IL-5, (C) IL-10, (D) IL-17A, (E) IL-17F, and (F) IFN-γ levels with the total EFI scores. Rho (r) and P-values are indicated. EFI, Endometriosis Fertility Index.
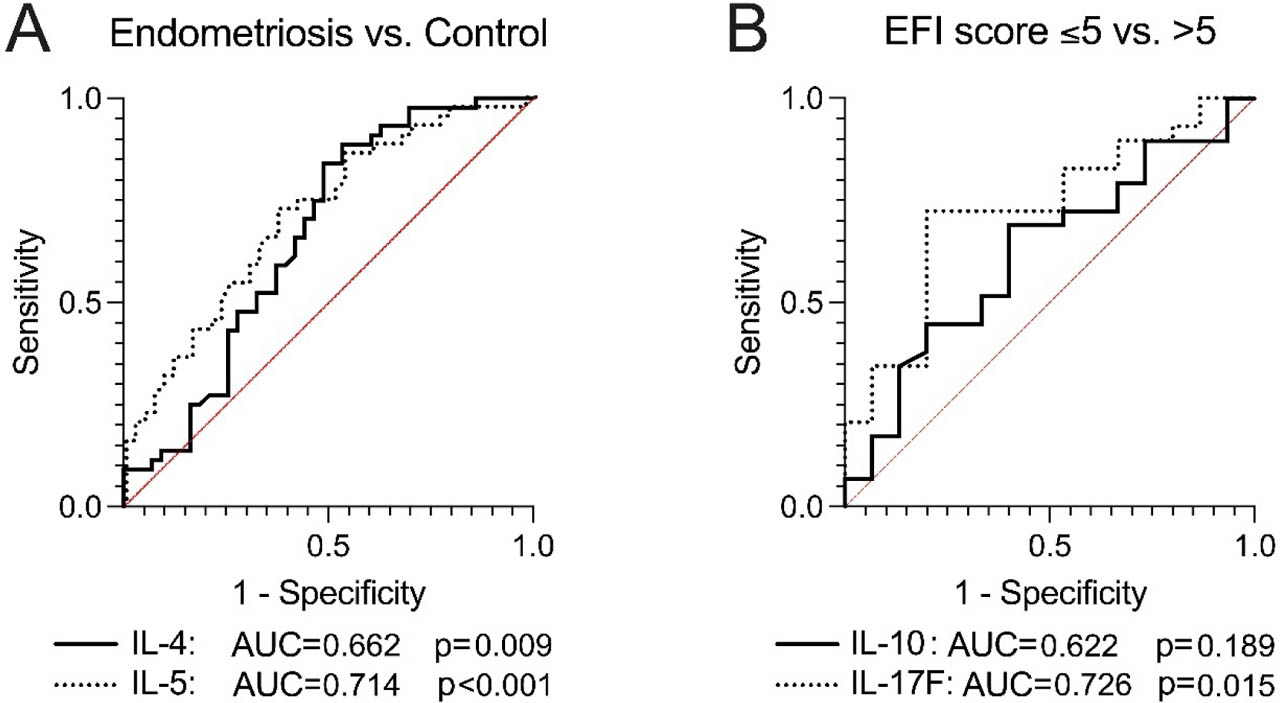
Figure 4.
ROC curve analysis for cytokines in serum. (A) Serum IL-4 and IL-5 in differentiating endometriosis from control cases. (B) Serum IL-10 and IL-17F in differentiating EFI scores above 5 versus 5 or below. The AUC and P-values are indicated. AUC, area under the curve; EFI, Endometriosis Fertility Index; ROC, receiver operating characteristic.
Table S1.
Th cytokine levels in endometriosis stages
| Stage I (n = 6) | Stage II (n = 9) | Stage III (n = 14) | Stage IV (n = 15) | ||
|---|---|---|---|---|---|
| IL-4 (Serum) | 26.38 (15.22–40.98) | 41.68 (36.81–44.54) | 33.63 (30.69–42.74) | 42.07 (34.90–48.41) | 0.059 |
| IL-4 (Peritoneal fluid) | 37.81 (15.94–59.50) | 38.51 (34.35–46.61) | 45.72 (37.77–51.29) | 36.36 (33.89–46.86) | 0.449 |
| IL-5 (Serum) | 10.80 (6.13–15.58) | 13.91 (12.19–16.82) | 9.13 (8.06–11.79) | 16.12 (10.61–20.90) | 0.026* |
| IL-5 (Peritoneal fluid) | 8.18 (4.13–42.73) | 16.37 (13.42–25.50) | 17.96 (15.19–29.79) | 16.29 (13.11–20.36) | 0.463 |
| IL-10 (Serum) | 1.43 (1.07–5.67) | 1.98 (1.11–2.98) | 3.85 (2.92–6.75) | 3.18 (2.65–7.51) | 0.019* |
| IL-10 (Peritoneal fluid) | 3.33 (1.19–12.35) | 3.79 (3.09–10.62) | 3.53 (3.01–8.52) | 28.32 (4.77–40.13) | 0.064 |
| IL-17A (Serum) | 6.38 (3.79–11.60) | 9.23 (6.03–32.09) | 18.09 (14.85–20.68) | 11.64 (8.58–22.54) | 0.057 |
| IL-17A (Peritoneal fluid) | 2.99 (1.20–7.03) | 6.20 (4.88–14.99) | 4.48 (3.36–12.79) | 6.03 (4.52–14.42) | 0.134 |
| IL-17F (Serum) | 2.98 (2.10–4.05) | 2.27 (2.19–4.38) | 4.91 (3.12–7.16) | 6.18 (4.35–6.91) | 0.017* |
| IL-17F (Peritoneal fluid) | 2.92 (2.62–4.79) | 2.44 (2.17–4.53) | 2.29 (2.17–4.59) | 2.25 (2.15–4.43) | 0.311 |
| IFN-γ (Serum) | 10.16 (8.42–32.51) | 15.31 (13.78–25.65) | 58.98 (20.84–73.00) | 12.84 (10.27–21.21) | 0.007* |
| IFN-γ (Peritoneal fluid) | 11.96 (8.10–17.27) | 20.34 (19.30–24.58) | 16.03 (13.89–25.91) | 21.71 (17.60–47.67) | 0.011* |
Table S2.
Th cytokine levels and EFI score
| Cytokine (Source) | EFI Score ≤5a | EFI Score >5a | Pb |
|---|---|---|---|
| IL-4 (Serum) | 33.53 (25.24–43.08) | 37.33 (25.29–46.51) | 0.314 |
| IL-4 (Peritoneal fluid) | 39.57 (29.12–47.92) | 37.19 (24.09–50.27) | 0.743 |
| IL-5 (Serum) | 10.40 (6.87–13.99) | 10.18 (6.85–16.13) | 0.969 |
| IL-5 (Peritoneal fluid) | 13.91 (6.32–18.44) | 15.06 (8.85–18.81) | 0.816 |
| IL-10 (Serum) | 2.65 (1.48–3.97) | 2.82 (1.50–4.23) | 0.813 |
| IL-10 (Peritoneal fluid) | 6.84 (3.05–15.23) | 3.89 (2.93–6.56) | 0.111 |
| IL-17A (Serum) | 11.03 (7.15–18.55) | 16.32 (7.95–21.49) | 0.120 |
| IL-17A (Peritoneal fluid) | 4.13 (2.60–7.18) | 5.46 (4.04–10.79) | 0.353 |
| IL-17F (Serum) | 5.18 (3.59–6.18) | 2.68 (2.86–3.49) | 0.030* |
| IL-17F (Peritoneal fluid) | 5.48 (3.12–6.87) | 2.19 (2.03–2.40) | 0.015* |
| IFN-γ (Serum) | 15.25 (10.35–24.66) | 18.10 (8.96–65.72) | 0.362 |
| IFN-γ (Peritoneal fluid) | 18.74 (13.23–25.54) | 19.66 (14.12–29.64) | 0.565 |
Table S3.
Th cytokines and menstrual cycle
| Variablea | Population | Follicular phase | Luteal phase | Pb |
|---|---|---|---|---|
| Serum IL-4 | All subject Endometriosis Control |
|
|
|
| Peritoneal IL-4 | All subject Endometriosis Control |
|
|
|
| Serum IL-5 | All subject Endometriosis Control |
|
|
|
| Peritoneal IL-5 | All subject Endometriosis Control |
|
|
|
| Serum IL-10 | All subject Endometriosis Control |
|
|
|
| Peritoneal IL-10 | All subject Endometriosis Control |
|
|
|
| Serum IL-17A | All subject Endometriosis Control |
|
|
|
| Peritoneal IL-17A | All subject Endometriosis Control |
|
|
|
| Serum IL-17F | All subject Endometriosis Control |
|
|
|
| Peritoneal IL-17F | All subject Endometriosis Control |
|
|
|
| Serum IFN-γ | All subject Endometriosis Control |
|
|
|
| Peritoneal IFN-γ | All subject Endometriosis Control |
|
|
|