
Table 1.
Baseline demographic and clinical characteristics of AS patients by BASDAI activity group
| Group | N | Age (years) | Weight (kg) | CRP (mg/L) | ESR (mm/h) | PLR | SAA (mg/L) | BASDAI |
|---|---|---|---|---|---|---|---|---|
| Low | 60 | 34.5 (26.8–44.2) | 66 ± 8.7 | 7.4 (4.7–16.3) | 12 (10–16) | 102.7 ± 22.2 | 14.3 (11.7–17.2) | 2.8 (2.1–3.1) |
| Moderate | 50 | 42 (35.2–47.8) | 69 (63–80) | 16.1 (12.1–21.2) | 24.5 (21–30) | 138.4 ± 27.6 | 29 ± 8.2 | 4.7 ± 0.4 |
| High | 50 | 45.5 (36.2–51.8) | 73.4 ± 14 | 22 (13.8–31.8) | 40.5 (31–49) | 164.5 ± 29.2 | 48.3 ± 9.1 | 6.8 (6.5–7.4) |
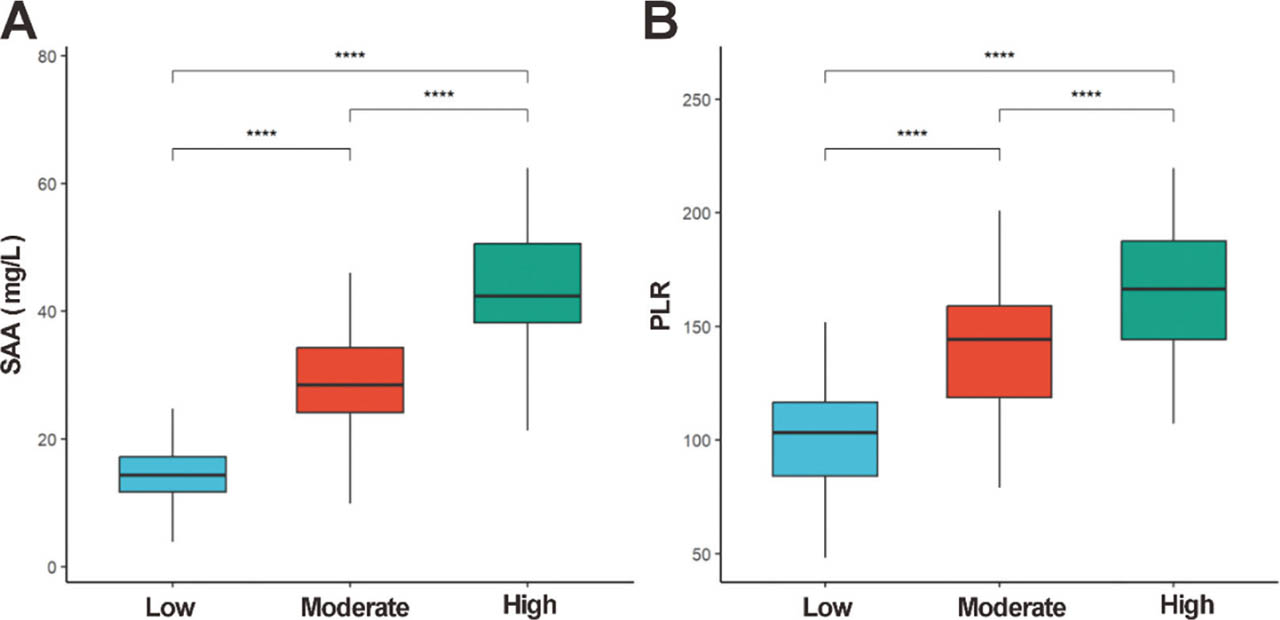
Figure 1.
Distribution of SAA and PLR. (A) SAA; (B) PLR levels across different disease activity groups. Box plots display medians (horizontal lines), IQR (boxes), and 1.5 × IQR whiskers. Group comparisons were analyzed by Kruskal–Wallis H test, with post hoc Dunn–Bonferroni tests for significant PLR differences: low- vs. high-activity (P < 0.0001), moderate- vs. high-activity (P < 0.0001), and low- vs. moderate-activity (∗∗∗∗P < 0.0001). IQR, interquartile range; PLR, platelet-to-lymphocyte ratio; SAA, serum amyloid A.
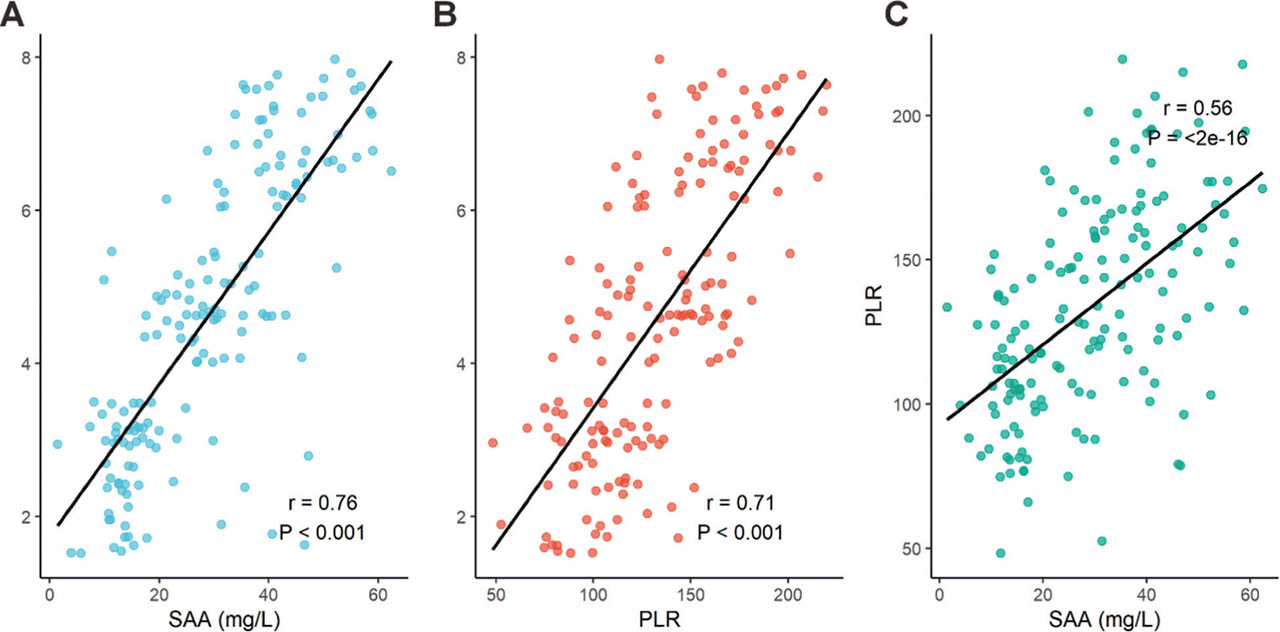
Figure 2.
Correlation of SAA, PLR and BASDAI scores. (A) SAA and BASDAI; (B) PLR and BASDAI, and (C) SAA and PLR. Both SAA and PLR showed strong correlations with BASDAI, while SAA and PLR exhibited a moderate correlation. r: correlation coefficient; P < 0.001 for all. BASDAI, bath ankylosing spondylitis disease activity index; PLR, platelet-to-lymphocyte ratio; SAA, serum amyloid A.
Table 2.
ROC curve analysis of diagnostic performance
| Cut-off value | Sensitivity (%) | Specificity (%) | AUC |
|---|---|---|---|
| SAA ≥30.6 mg/L | 96.0 | 80.0 | 0.93 |
| PLR ≥143.7 | 78.0 | 76.4 | 0.86 |
| Combined detection | 86.0 | 90.9 | 0.95 |
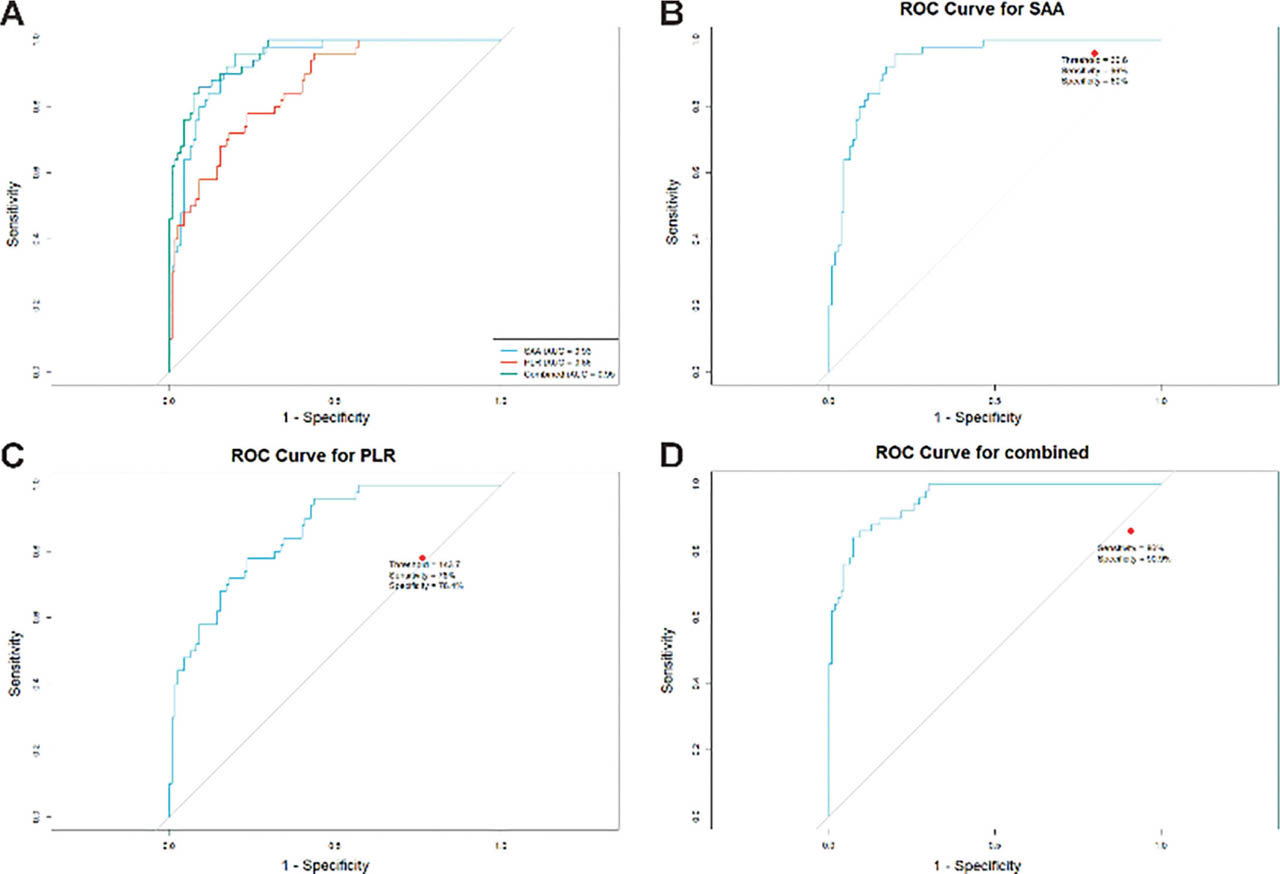
Figure 3.
ROC curve analysis of SAA, PLR, and their combination for predicting high disease activity. (A) AUC comparison between SAA and PLR; (B) sensitivity/specificity of SAA; (C) sensitivity/specificity of PLR; (D) sensitivity/specificity of combined SAA + PLR. AUC, area under the curve; combination, SAA + PLR; PLR, platelet-to-lymphocyte ratio; ROC, receiver operating characteristic; SAA, serum amyloid A.