
Table 1.
Longitudinal performance metrics for clustered vs. non-clustered hospitals (2016–2024)
| Hospital type | Year | PCCI (%) | CDMS (%) | Staff training (h) | Patient satisfaction (%) | Follow-up compliance (%) | Health outcomes improvement (%) | Tech utilization score |
|---|---|---|---|---|---|---|---|---|
| Non-clustered | 2016 | 68.0 | 62.9 | 15.0 | 72.9 | 68.0 | 63.0 | 58.0 |
| 2017 | 68.8 | 63.5 | 15.2 | 73.8 | 68.6 | 63.7 | 58.4 | |
| 2018 | 72.4 | 67.1 | 15.9 | 77.7 | 72.4 | 67.0 | 61.8 | |
| 2019 | 76.7 | 71.1 | 16.9 | 82.4 | 76.7 | 71.0 | 65.5 | |
| 2020 | 81.1 | 75.0 | 17.8 | 87.1 | 81.2 | 75.2 | 69.1 | |
| 2021 | 85.4 | 79.2 | 18.8 | 91.5 | 85.4 | 79.1 | 72.8 | |
| 2022 | 89.8 | 83.1 | 19.8 | 92.4 | 89.7 | 83.2 | 76.6 | |
| 2023 | 91.7 | 89.0 | 20.8 | 92.9 | 91.7 | 87.4 | 80.3 | |
| 2024 | 92.2 | 92.8 | 21.8 | 94.0 | 93.0 | 93.0 | 83.9 | |
| Clustered | 2016 | 70.0 | 65.0 | 16.0 | 75.1 | 70.0 | 64.9 | 60.0 |
| 2017 | 70.7 | 65.5 | 16.1 | 75.8 | 70.8 | 65.6 | 60.4 | |
| 2018 | 78.6 | 72.8 | 17.9 | 84.0 | 78.5 | 73.0 | 67.2 | |
| 2019 | 86.7 | 80.6 | 19.9 | 92.7 | 86.9 | 80.7 | 74.3 | |
| 2020 | 94.5 | 88.4 | 21.8 | 95.3 | 94.5 | 88.4 | 81.5 | |
| 2021 | 95.1 | 95.4 | 23.7 | 96.0 | 95.0 | 95.4 | 88.6 | |
| 2022 | 95.0 | 95.1 | 25.6 | 97.0 | 95.7 | 95.6 | 96.0 | |
| 2023 | 96.1 | 95.1 | 27.5 | 95.9 | 95.5 | 95.4 | 95.7 | |
| 2024 | 95.1 | 96.1 | 29.4 | 97.0 | 95.9 | 95.5 | 95.9 |
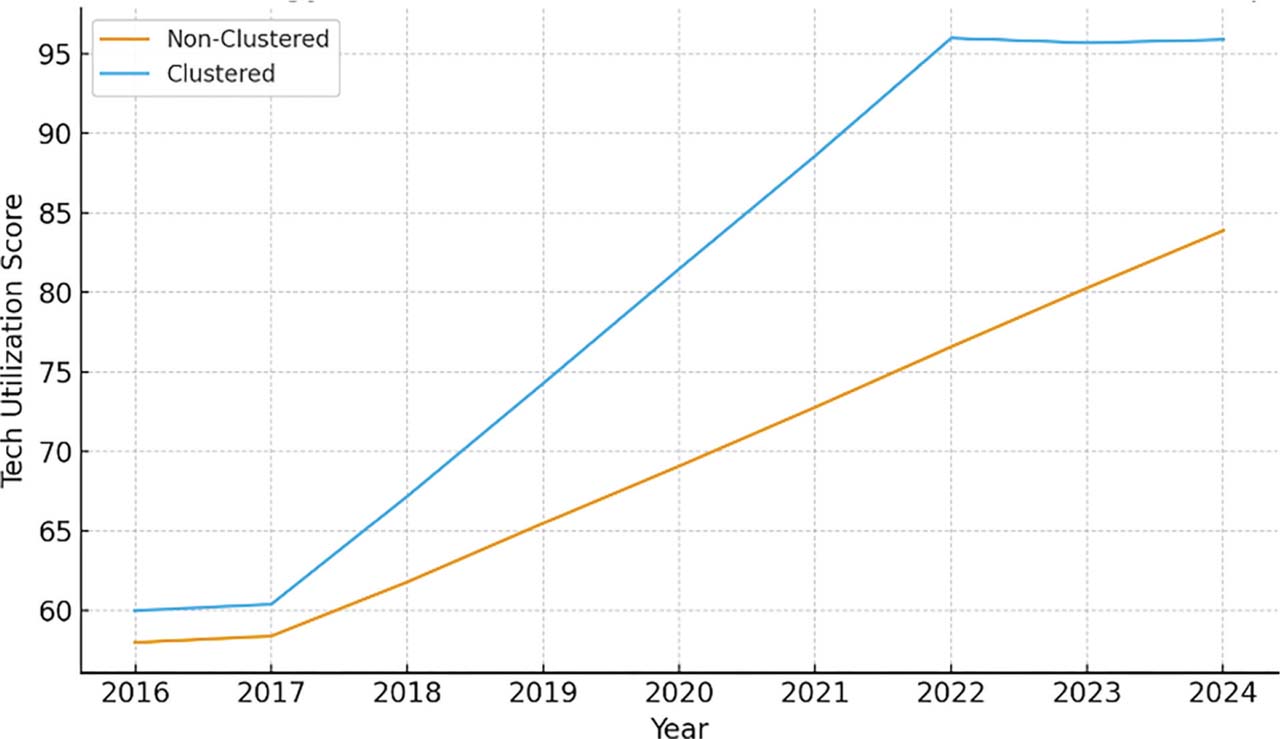
Figure 1.
Temporal trends in digital adoption among clustered and non-clustered hospitals from 2016 to 2024. The TUS reflects combined EMR and telemedicine uptake. Clustered hospitals demonstrate a consistent and steeper upward trajectory, while non-clustered hospitals show slower and irregular adoption patterns. Values represent annual hospital-level averages. EMRs, electronic medical records; TUS, Technology Utilization Score.
Table 2.
Themes from patients and physicians in clustered vs. non-clustered hospitals
| Theme | Clustered hospitals (patients) | Clustered hospitals (physicians) | Non-clustered hospitals (patients) | Non-clustered hospitals (physicians) |
|---|---|---|---|---|
| Facilitators of Adoption | “I can access my lab results and prescriptions on the hospital app.” (C1-ONC-04) | “Our EMR is unified across facilities, which saves time.” (SP-C2-CARD-02) | “The app is there, but it’s hard to use without guidance.” (NC1-END-05) | “Training was limited, and staff adoption is uneven.” (SP-NC2-NEU-03) |
| Barriers to Implementation | “Older patients in my family don’t know how to use telemedicine.” (C2-CARD-07) | “Some colleagues resist digital systems; interoperability is partial.” (SP-C1-ONC-01) | “I face delays when the app crashes or does not load properly.” (NC2-ONC-06) | “Our systems don’t connect, so data gets lost between departments.” (SP-NC1-END-02) |
| Perceived Benefits | “Teleconsultations saved me from long hospital visits.” (C1-END-08) | “Digital tools reduced clinic crowding and improved chronic follow-up.” (SP-C2-NEU-04) | “I like reminders for appointments, but some-times they don’t arrive.” (NC1-CARD-03) | “Mobile apps help, but the lack of technical support reduces impact.” (SP-NC2-ONC-05) |