
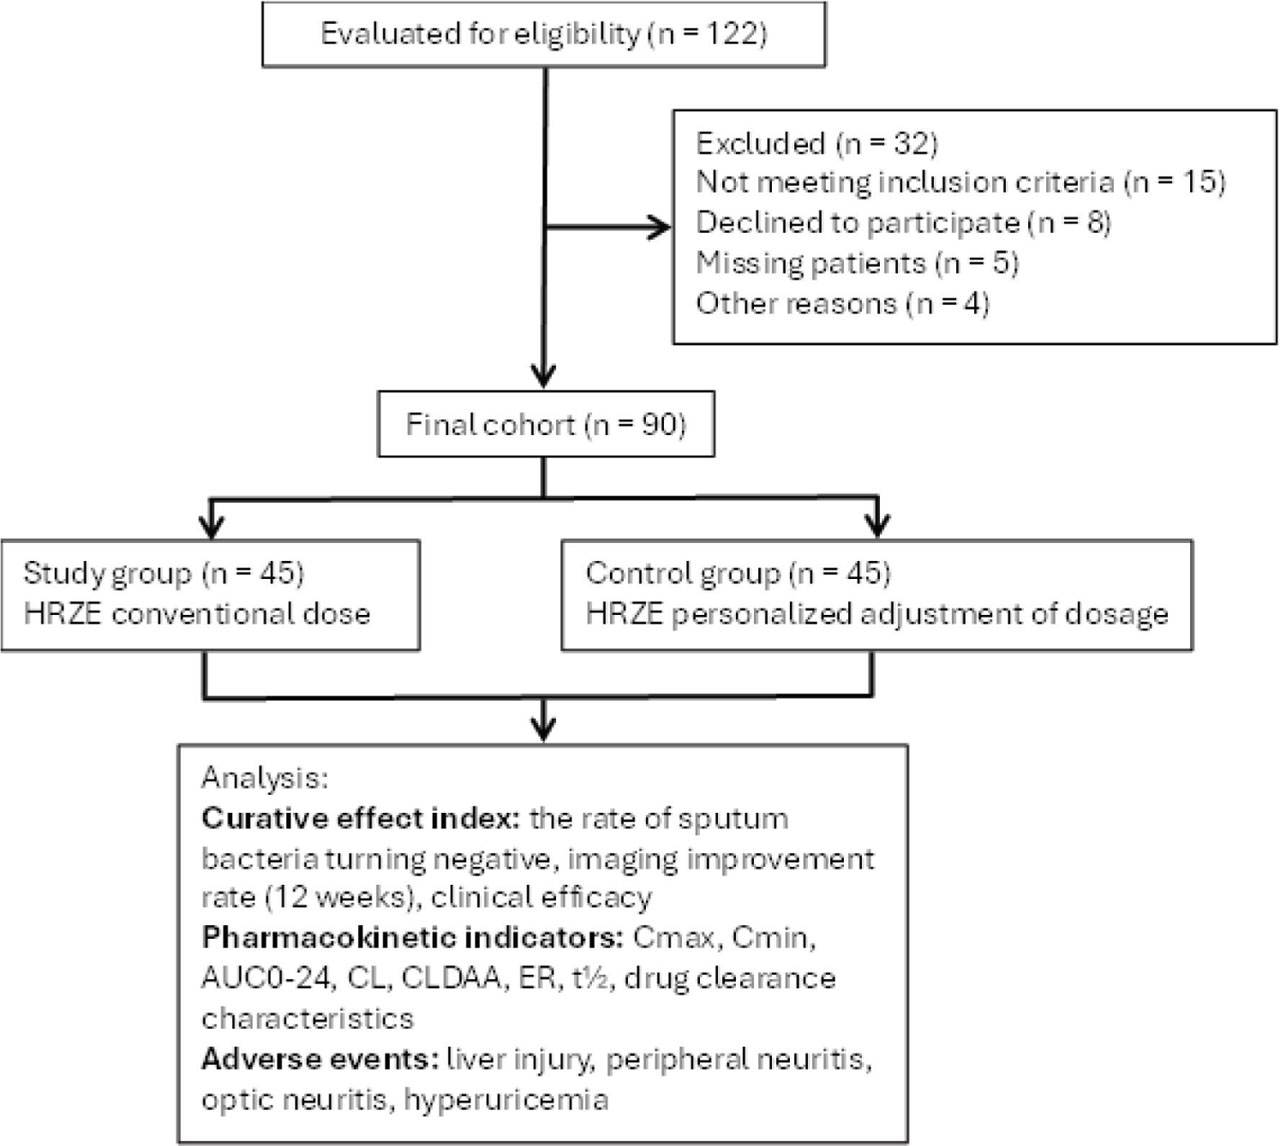
Figure 1.
Design flowchart. CL, clearance rate.
Table 1.
Comparison of baseline characteristics between the 2 groups (x̄ ± s)
| Indicators | Control group (n = 45) | Study group (n = 45) | Statistical (χ2/t) | P |
|---|---|---|---|---|
| Demographic characteristics | ||||
| Age (years) | 59.1 ± 10.2 | 58.3 ± 9.7 | t = 0.37 | 0.707 |
| Proportion of males | 60.0% (27) | 62.2% (28) | χ2 = 0.08 | 0.765 |
| BMI (kg/m2) | 21.9 ± 2.8 | 22.4 ± 3.1 | t = −0.79 | 0.430 |
| Primary kidney disease type | ||||
| Diabetic nephropathy | 46.7% (21) | 44.4% (20) | χ2 = 0.05 | 0.823 |
| Hypertensive nephropathy | 26.7% (12) | 28.9% (13) | χ2 = 0.06 | 0.806 |
| Chronic glomerulonephritis | 22.2% (10) | 20.0% (9) | χ2 = 0.07 | 0.792 |
| Polycystic kidney | 4.4% (2) | 6.7% (3) | FET | 1 |
| Dialysis parameters | ||||
| Dialysis age (months) | 38.3 ± 20.1 | 38.5 ± 11.1 | t = 1.11 | 0.269 |
| Residual urine volume (mL/24 h) | 145 ± 72 | 152 ± 68 | t = −0.84 | 0.403 |
| Dialysis method (HDF:HD) | 26:19 | 28:17 | χ2 = 0.18 | 0.669 |
| Kt/V value | 1.49 ± 0.23 | 1.52 ± 0.21 | t = −0.62 | 0.531 |
| Characteristics of TB | ||||
| TB | 84.4% (38) | 86.7% (39) | χ2 = 0.09 | 0.761 |
| Extrapulmonary TB | 15.6% (7) | 13.3% (6) | χ2 = 0.09 | 0.761 |
| The proportion of cavitary pulmonary TB | 73.3% (33) | 75.6% (34) | χ2 = 0.06 | 0.806 |
| Classification of positive sputum smears (1 + /2 + /3+) | 16/17/6 | 18/15/6 | χ2 = 0.32 | 0.852 |
| TB symptom score (0–10 points) | 6.5 ± 1.3 | 6.2 ± 1.5 | t = 1.00 | 0.320 |
| Laboratory indicators | ||||
| Hemoglobin (g/L) | 96.8 ± 11.7 | 98.5 ± 12.3 | t = −0.66 | 0.508 |
| Serum creatinine (µmol/L) | 792.5 ± 142.8 | 768.2 ± 156.4 | t = 0.76 | 0.449 |
| Urea nitrogen (mmol/L) | 29.1 ± 7.2 | 28.3 ± 6.7 | t = 0.54 | 0.591 |
| Albumin (g/L) | 34.7 ± 3.9 | 35.2 ± 4.1 | t = −0.58 | 0.559 |
| hs-CRP (mg/L) | 20.1 ± 6.8 | 18.6 ± 7.3 | t = 1.09 | 0.275 |
| Blood calcium (mmol/L) | 2.08 ± 0.29 | 2.12 ± 0.31 | t = −0.60 | 0.546 |
| Blood phosphorus (mmol/L) | 1.92 ± 0.38 | 1.86 ± 0.42 | t = 0.70 | 0.485 |
| iPTH (pg/mL) | 372.6 ± 166.2 | 348.5 ± 152.7 | t = 1.10 | 0.273 |
| Indicators of immunity | ||||
| CD4 + T cell count (cells/µL) | 298 ± 102 | 312 ± 108 | t = −0.75 | 0.454 |
| CD8 + T cell count (cells/µL) | 703 ± 142 | 685 ± 156 | t = 0.56 | 0.573 |
| CD4 + /CD8 + ratio | 0.42 ± 0.14 | 0.46 ± 0.15 | t = −1.28 | 0.203 |
| IL-6 (pg/mL) | 26.1 ± 9.5 | 24.3 ± 8.7 | t = 1.17 | 0.242 |
| Comorbidity | ||||
| Diabetes | 55.6% (25) | 51.1% (23) | χ2 = 0.18 | 0.669 |
| Coronary heart disease | 26.7% (12) | 24.4% (11) | χ2 = 0.07 | 0.792 |
| Hypertension | 71.1% (32) | 75.6% (34) | χ2 = 0.24 | 0.624 |
| History of drug use | ||||
| Previous history of anti-TB treatment | 13.3% (6) | 15.6% (7) | χ2 = 0.10 | 0.752 |
| History of immunosuppressive therapy | 11.1% (5) | 8.9% (4) | FET | 0.732 |
Table 2.
The negative conversion rate of sputum bacteria in the 2 groups changed dynamically (%, n/N)
| Time point | Control group (n = 45) | Study group (n = 45) | OR | 95% CI | P |
|---|---|---|---|---|---|
| 4 weeks of treatment | 35.6% (16/45) | 62.2% (28/45) | 3.27 | 1.52–7.05 | 0.011 |
| 8 weeks of treatment | 60.0% (27/45) | 86.7% (39/45) | 4.33 | 1.71–10.98 | 0.004 |
| 12 weeks of treatment | 73.3% (33/45) | 93.3% (42/45) | 5.09 | 1.43–18.11 | 0.011 |
Table 3.
Rates of radiographic improvement at week 12 in both groups (%, n/N)
| Parameters | Control group (n = 45) | Study group (n = 45) | OR | 95% CI | P |
|---|---|---|---|---|---|
| Cavity closure rate | 48.9% (22/45) | 76.5% (34/45) | 3.23 | 1.32–7.93 | 0.009 |
| Absorption rate of the infiltrated lesion | 62.2% (28/45) | 82.2% (37/45) | 2.81 | 1.06–7.43 | 0.034 |
| Absorption rate of pleural effusion | 68.9% (31/45) | 88.9% (40/45) | 3.61 | 1.17–11.12 | 0.020 |
Table 4.
Comparison of clinical efficacy between the 2 groups (x̄ ± s)
| Groups | n | Curing | Markedly effective | Effective | Ineffective | χ2 | P |
|---|---|---|---|---|---|---|---|
| Control group | 45 | 18 (40.0%) | 10 (22.2%) | 8 (17.8%) | 9 (20.0%) | 12.94 | <0.001 |
| Study group | 45 | 36 (80.0%) | 6 (13.3%) | 2 (4.4%) | 1 (2.2%) |
Table 5.
Comparison of key PK parameters between the 2 groups (x̄ ± s)
| Parameter | H | R | Z | E |
|---|---|---|---|---|
| Cmax (µg/mL) | ||||
| Control group (n = 45) | 5.6 ± 0.9 | 12.5 ± 1.8 | 25.7 ± 4.3 | 5.4 ± 0.8 |
| Study group (n = 45) | 8.9 ± 1.5** | 16.8 ± 2.4** | 38.5 ± 5.6** | 8.2 ± 1.1** |
| Cmin (µg/mL) | ||||
| Control group (n = 45) | 0.6 ± 0.2 | 1.2 ± 0.3 | 9.3 ± 1.7 | 0.4 ± 0.1 |
| Study group (n = 45) | 1.5 ± 0.4** | 2.8 ± 0.6** | 12.8 ± 2.1** | 0.9 ± 0.2** |
| AUC0–24 (µg·h/mL) | ||||
| Control group (n = 45) | 28.9 ± 5.2 | 56.7 ± 8.9 | 287.5 ± 42.6 | 24.7 ± 3.5 |
| Study group (n = 45) | 45.6 ± 6.7** | 85.6 ± 12.3** | 412.8 ± 58.3** | 35.2 ± 4.8** |
| t½ (h) | ||||
| Control group (n = 45) | 4.3 ± 0.9 | 4.8 ± 0.7 | 12.4 ± 1.9 | 11.7 ± 1.6 |
| Study group (n = 45) | 5.8 ± 1.1** | 5.2 ± 0.8* | 16.8 ± 2.5** | 12.5 ± 1.8* |
| CL (L/h) | ||||
| Control group (n = 45) | 34.6 ± 5.2 | 10.6 ± 1.8 | 4.3 ± 0.7 | 24.2 ± 3.1 |
| Study group (n = 45) | 22.0 ± 3.5** | 7.0 ± 1.2** | 3.0 ± 0.5** | 17.0 ± 2.3** |
Table 6.
Effect of dialysis on clearance of major antituberculosis drugs (x̄ ± s)
Table 7.
Incidence of adverse reactions (n (%))
| Adverse events | Control group (n = 45) | Study group (n = 45) | χ2 | P |
|---|---|---|---|---|
| Liver injury | 22.2% (10/45) | 6.7% (3/45) | 4.68 | 0.031 |
| Optic neuritis | 15.6% (7/45) | 0% (0/45) | 7.50 | 0.006 |
| Hyperuricemia | 31.1% (14/45) | 13.3% (6/45) | 4.18 | 0.041 |
| Peripheral neuropathy | 8.9% (4/45) | 8.9% (4/45) | 0.00 | 1.000 |
| Total adverse reactions | 62.2% (28/45) | 24.4% (11/45) | 13.31 | <0.001 |