
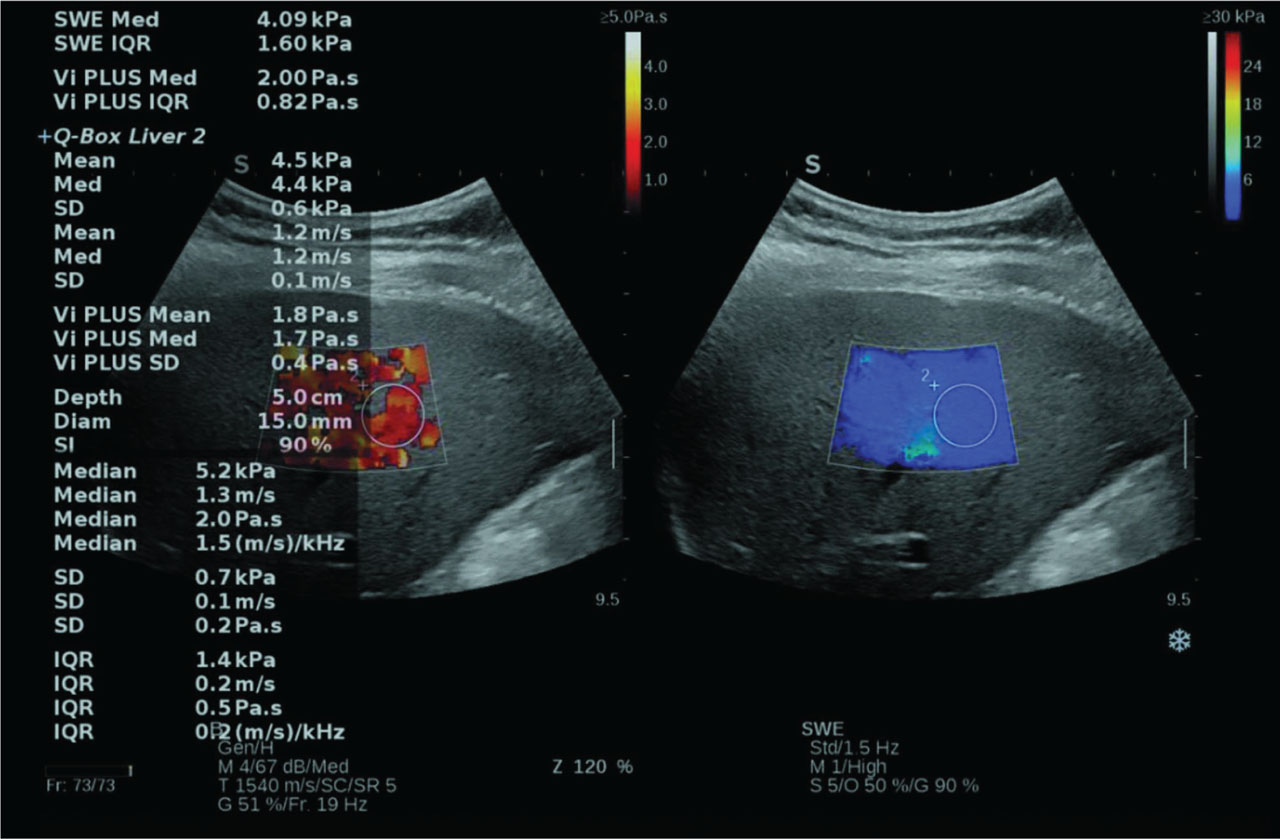
Figure 1.
The image of a Vi.PLUS measurement, which was performed in a NAFLD patient. The viscosity is displayed in the left part of the image. Colors close to yellow white are indicative of high viscosity, while red means low viscosity. Numeric Vi.PLUS results (expressed in Pa.S) are shown on the left side of the image. NAFLD, non-alcoholic fatty liver disease; SD, standard deviation; SI, stability index; Vi.PLUS, Viscosity plane-wave ultrasound.
Table 1.
Displays the main characteristics of the patients and measurements
| Parameter (mean ± SD) | n = 149 |
|---|---|
| Age (years) | 55.8 ± 13.6 |
| Gender | |
| Males | 78/149 (52.3%) |
| Females | 71/149 (47.7%) |
| BMI (kg/m2) | 27.7 ± 4.6 |
| Abdominal circumference (cm) | 96.2 ± 13.9 |
| AST (U/L) | 26.5 ± 11.7 |
| ALT (U/L) | 35.9 ± 23.5 |
| Vi.PLUS (Pa.S) | 2.0 ± 0.5 |
| LSM by MRE (kPa) | 2.6 ± 1.1 |
| LF distribution by MRE | |
| Normal | 63.1% (94/149) |
| Normal or inflammation | 18.1% (27/149) |
| Stage 1–2 fibrosis | 6.7% (10/149) |
| Stage 2–3 fibrosis | 1.3% (2/149) |
| Stage 3–4 fibrosis | 5.4% (8/149) |
| Stage 4 fibrosis | 5.4% (8/149) |
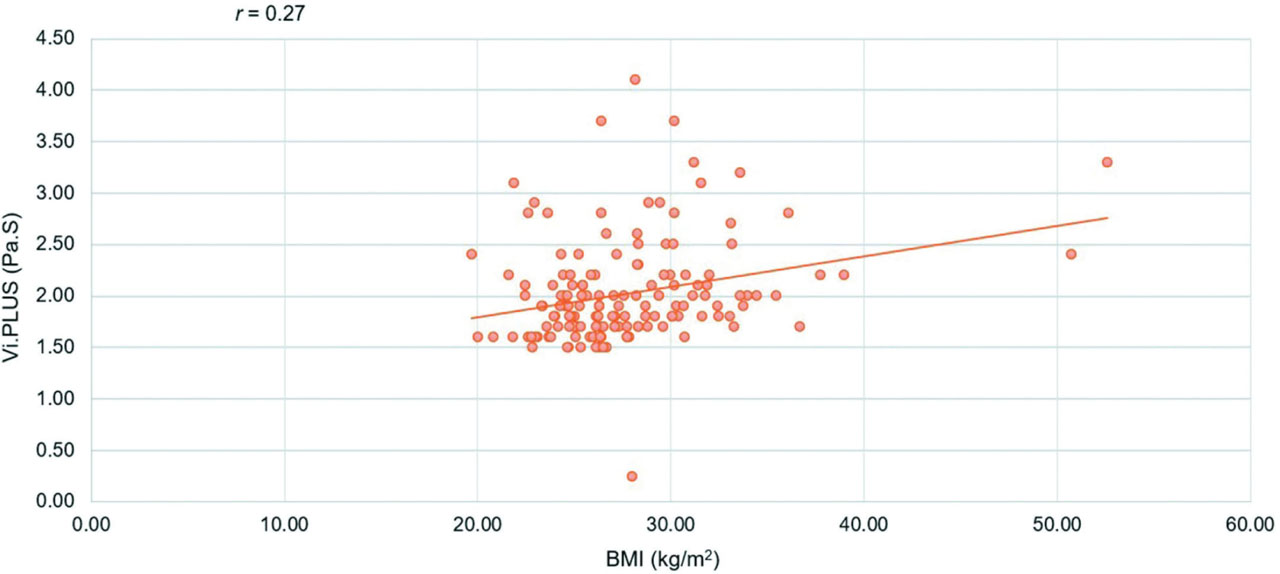
Figure 2.
Relationship between BMI and Vi.PLUS; Pearson correlation coefficient, r = 0.27. BMI, body mass index; Vi.PLUS, Viscosity plane-wave ultrasound.
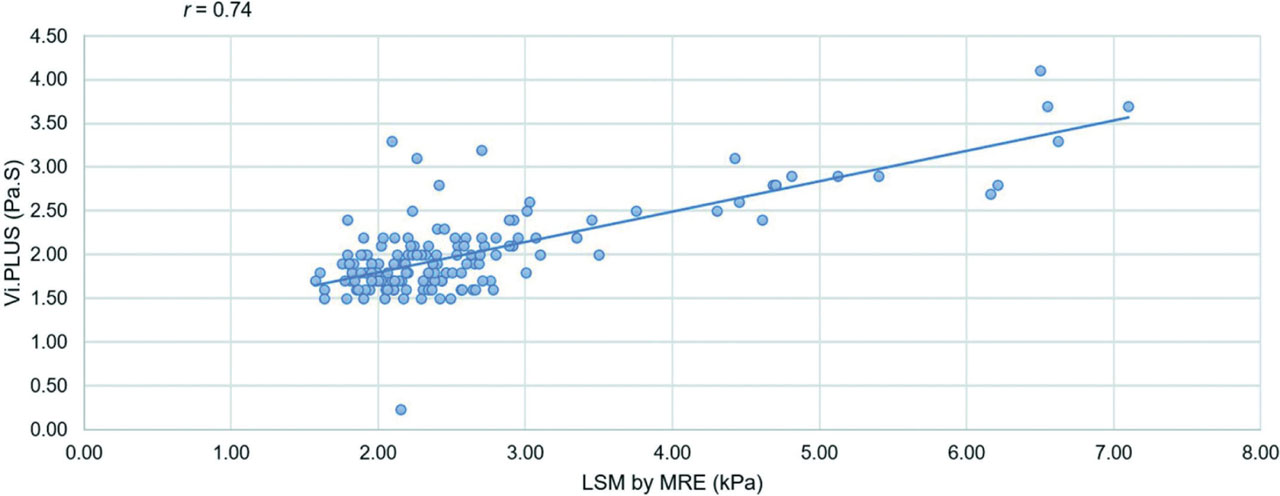
Figure 3.
Relationship between LSM by MRE and Vi.PLUS; Pearson correlation coefficient, r = 0.74. LSM, liver stiffness measurement; MRE, magnetic resonance elastography; Vi.PLUS, Viscosity plane-wave ultrasound.