
Table 1.
Summary of conditions for the ACE2 G8790A and AT2R A1675G genetic analyses
| ACE2 G8790A (rs2285666) | AT2R A1675G (rs14035430) | |
|---|---|---|
| Primer sequence (5′–3′) | F:CATGTGGTCAAAAGGATATCT | F:AGAGATCTGGTGCTATTACG |
| R:AAAGTAAGGTTGGCAGACAT | R:CACTTGAAGACTTACTGGTTG | |
| PCR reaction conditions |
|
|
| PCR product size | 466 bp | 310 bp |
| Restriction enzyme, incubation conditions | Alu I | HYP 188 III |
| 37°C overnight | 37°C overnight | |
| Fragment length (bp) | GG: 466 bp | AA: 310 bp |
| GA: 185 bp–281 bp–466 bp | GA: 104 bp–206 bp–310 bp | |
| AA: 185 bp–281 bp | GG: 104 bp–206 bp |
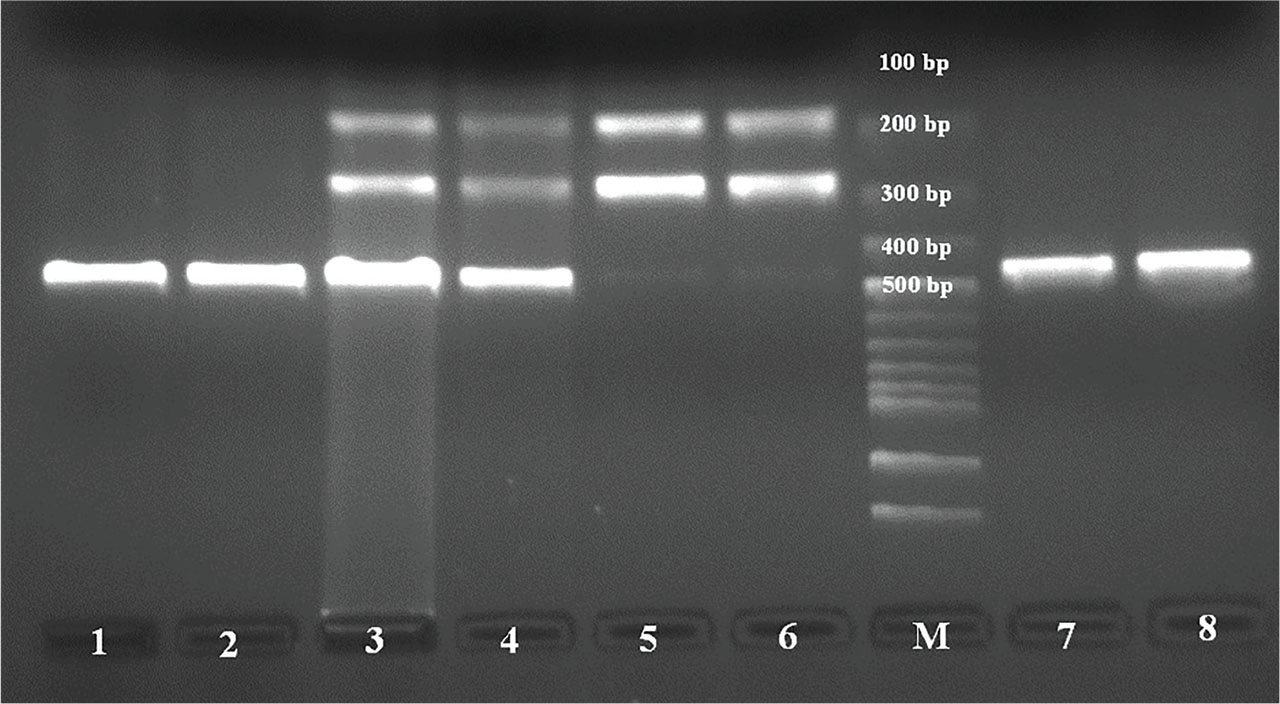
Figure 1.
Electrophoresis of ACE2 G8709A (rs2285666) gene polymorphism by enzyme digestion product sizes were 466 bp for GG genotype, 185 bp–281 bp–466 bp for GA genotype, and 185 bp–281 bp for AA genotype. Lanes 1 and 2 are the GG genotype; lanes 3 and 4 are the GA genotype; lanes 5 and 6 are the AA genotype; lanes 7 and 8 are the PCR products (466 bp). ACE2, angiotensin-converting enzyme 2; M, DNA molecular weight marker.
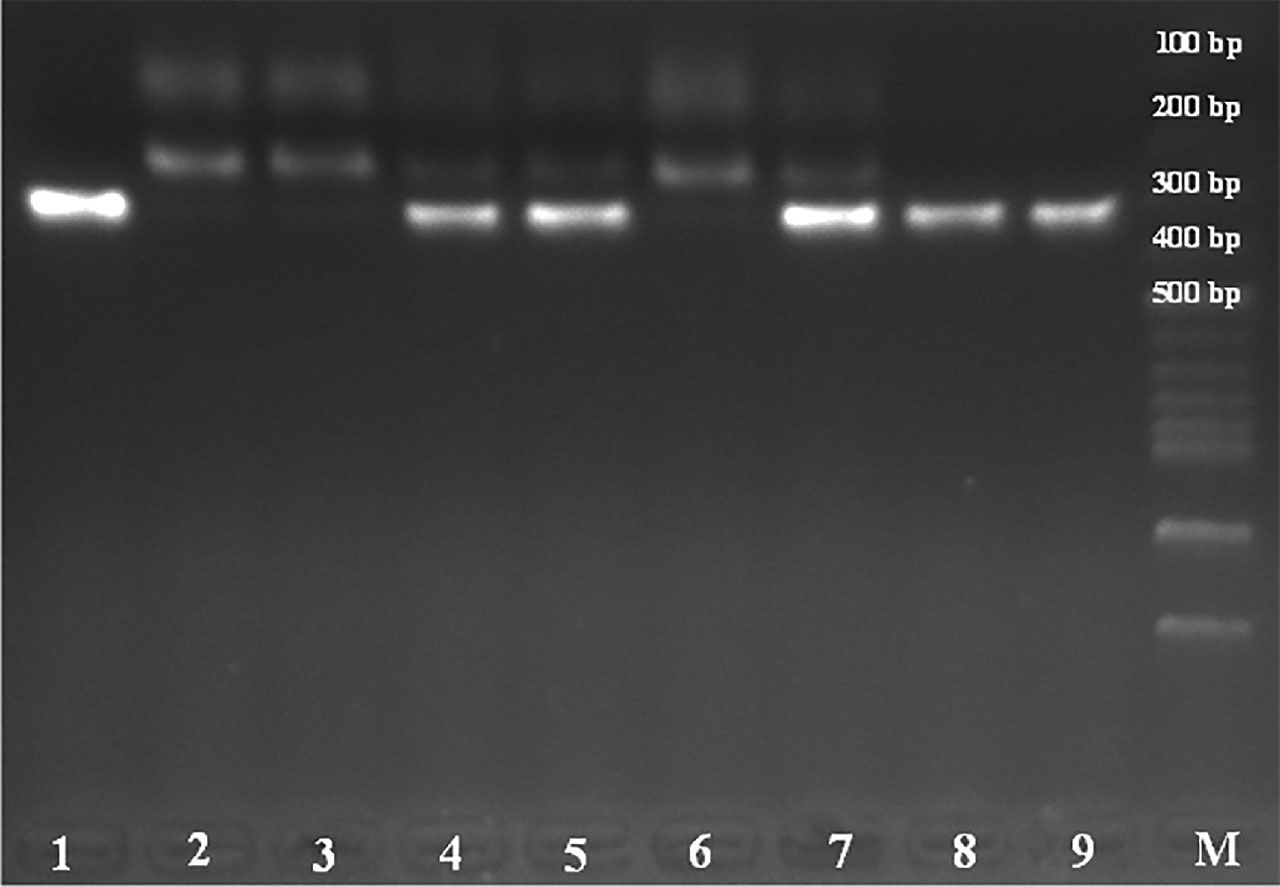
Figure 2.
Electrophoresis of AT2R A1675G (rs14035430) gene polymorphism by enzyme digestion product sizes were 310 bp for AA genotype, 104 bp–206 bp–310 bp for AG genotype, and 104 bp–206 bp for GG genotype. Lanes 1, 8, and 9 are the AA genotype; lanes 4, 5, and 7 are the AG genotype; lanes 2, 3, and 6 are the GG genotype. AT2R, angiotensin II type 2 receptor; M, DNA molecular weight marker.
Table 2.
Characteristics of the study population
| Variables | Control Group n = 80 | Infected Group n = 80 | P-value |
|---|---|---|---|
| Sex (M/F) n (%) | 42 (52.5)/38 (47.5) | 39 (48.8)/41 (51.2) | 0.63 |
| Age (years) | 41.3 ± 16.0 | 48.3 ± 16.7 | 0.20 |
| WBC (103/mm3) | 6.47 ± 2.14 | 6.96 ± 3.26 | 0.008** |
| PLT (103/mm3) | 226.1 ± 63.4 | 213.0 ± 57.4 | 0.44 |
| Neutrophil (103/μL) | 4.21 ± 1.93 | 4.84 ± 2.80 | 0.023* |
| Lymphocyte (103/μL) | 1.64 ± 0.78 | 1.60 ± 0.80 | 0.45 |
| Eosinophil (103/μL) | 00.7 ± 0.08 | 0.05 ± 0.10 | 0.65 |
| Hemoglobin (g/dL) | 14.4 ± 1.87 | 13.9 ± 2.42 | 0.40 |
| D-dimer (μg/mL) | 510.0 ± 391.9 | 825.7 ± 818.3 | <0.001** |
| Fibrinogen (mg/dL) | 340.1 ± 122.6 | 429.9 ± 126.2 | 0.07 |
| Ferritin (ng/mL) | 91.4 ± 123.8 | 253.3 ± 323.4 | <0.001** |
| CRP (mg/L) | 19.1 ± 35.6 | 55.3 ± 67.3 | <0.001** |
| AST (IU/L) | 27.6 ± 17.0 | 32.3 ± 15.8 | 0.25 |
| ALT (IU/L) | 29.3 ± 26.3 | 29.5 ± 15.5 | 0.34 |
| Creatinin (mg/dL) | 0.96 ± 0.18 | 1.04 ± 0.57 | 0.27 |
| Urea (mg/dL) | 28.1 ± 11.4 | 34.4 ± 22.3 | 0.018* |
Table 3.
Hardy–Weinberg equilibrium for ACE2 G8790A and AT2R A1675G gene polymorphisms in COVID patients without/with lung involvement
Table 4.
Distribution of ACE2 (G8709A) and AT2R (A1675G) genotypes and alleles frequencies in COVID patients without/with lung involvement
| Control Group | Infected Group | OR (95% CI) | P-value | OR (95% CI) | P-value | ||||
|---|---|---|---|---|---|---|---|---|---|
| n = 80 | % | n = 80 | % | ||||||
| GG | 65 | 55.6 | 52 | 44.4 | 1 | - | 0.29 (0.10–0.84) | 0.01* | |
| GA | 10 | 41.7 | 14 | 58.3 | 1.75 (0.72–4.26) | 0.21 | 0.50 (0.14–1.84) | 0.29 | |
| AA | 5 | 26.3 | 14 | 73.7 | 3.50 (1.18–10.3) | 0.001** | 1 | - | |
| ACE2 G8709A (rs2285666) | χ2 = 6.37, df = 2, P = 0.04* | ||||||||
| G allele | 140 | 54.3 | 118 | 45.7 | 1 | - | 0.40 (0.22–0.72) | 0.001** | |
| A allele | 20 | 32.3 | 42 | 67.7 | 2.49 (1.39–4.48) | 0.001** | 1 | - | |
| χ2 = 9.68, df = 1, P = 0.002** | |||||||||
| AA | 37 | 51.4 | 35 | 48.6 | 1.69 (0.76–3.76) | 0.19 | 0.55 (0.26–1.15) | 0.11 | |
| AG | 18 | 36.7 | 31 | 63.3 | 3.08 (1.28–7.38) | 0.01* | 1 | ||
| GG | 25 | 64.1 | 14 | 35.9 | 1 | 0.33 (0.14–0.78) | 0.01* | ||
| AT2R A1675G (rs14035430) | χ2 = 6.60, df = 2, P = 0.03* | ||||||||
| A allele | 92 | 47.7 | 101 | 52.3 | 1.27 (0.81–1.98) | 0.30 | 1 | ||
| G allele | 68 | 53.5 | 59 | 46.5 | 1 | 0.79 (0.50–1.24) | 0.30 | ||
| χ2 = 1.05, df = 1, P = 0.30 | |||||||||
Table 5.
Analysis of the influence of ACE2 G8790A and AT2R A1675G gene polymorphisms on clinical-laboratory variables in COVID-19 patients without lung involvement
| Variables | Control Group (n = 80) | |||||||
|---|---|---|---|---|---|---|---|---|
| ACE2 G8709A genotype | AT2R A1675G genotype | |||||||
| GG | GA | AA | P-value | AA | AG | GG | P-value | |
| Age (years) | 49.9 ± 16.7 | 43.0 ± 17.6 | 48.0 ± 15.8 | 0.39 | 49.9 ± 17.2 | 45.3 ± 18.9 | 51.4 ± 7.90 | 0.43 |
| WBC (103/mm3) | 7.21 ± 3.27 | 5.98 ± 2.02 | 6.98 ± 4.18 | 0.46 | 6.65 ± 2.50 | 7.06 ± 3.79 | 7.49 ± 3.83 | 0.70 |
| PLT (103/mm3) | 213.2 ± 61.0 | 214.6 ± 48.2 | 210.5 ± 55.2 | 0.98 | 208.4 ± 55.3 | 217.6 ± 59.4 | 214.4 ± 61.0 | 0.80 |
| Neutrophil (103/μL) | 5.08 ± 2.81 | 3.70 ± 1.68 | 5.06 ± 3.52 | 0.25 | 4.71 ± 2.39 | 4.74 ± 3.06 | 5.38 ± 3.31 | 0.73 |
| Lymphocyte (103/μL) | 1.61 ± 0.84 | 1.78 ± 0.70 | 1.36 ± 0.71 | 0.39 | 1.45 ± 0.71 | 1.79 ± 0.98 | 1.55 ± 0.45 | 0.21 |
| Eosinophil (103/μL) | 00.6 ± 0.12 | 0.04 ± 0.04 | 0.06 ± 0.09 | 0.82 | 0.05 ± 0.08 | 0.07 ± 0.14 | 0.04 ± 0.07 | 0.62 |
| Hemoglobin (g/dL) | 13.6 ± 2.70 | 14.4 ± 1.78 | 14.2 ± 1.75 | 0.47 | 13.6 ± 3.03 | 13.9 ± 1.88 | 14.3 ± 1.68 | 0.61 |
| D-dimer (μg/mL) | 988.3 ± 941.2 | 534.5 ± 386.6 | 513.1 ± 376.7 | 0.05* | 914.5 ± 1044.5 | 784.0 ± 381.8 | 696.2 ± 914.2 | 0.66 |
| Fibrinogen (mg/dL) | 455.9 ± 139.1 | 384.2 ± 97.9 | 379.2 ± 59.0 | 0.04* | 442.1 ± 131.5 | 425.7 ± 129.4 | 408.7 ± 109.4 | 0.69 |
| Ferritin (ng/mL) | 289.3 ± 374.0 | 164.2 ± 133.4 | 208.5 ± 230.1 | 0.37 | 297.9 ± 362.6 | 148.0 ± 179.0 | 374.7 ± 412.3 | 0.05* |
| CRP (mg/L) | 68.2 ± 76.6 | 32.1 ± 38.4 | 30.6 ± 32.7 | 0.06 | 67.4 ± 80.8 | 37.3 ± 44.8 | 65.0 ± 67.1 | 0.16 |
| AST (IU/L) | 34.0 ± 17.3 | 30.7 ± 13.9 | 27.1 ± 10.7 | 0.32 | 29.9 ± 14.1 | 29.3 ± 9.42 | 44.6 ± 24.6 | 0.005** |
| ALT (IU/L) | 31.7 ± 16.9 | 26.9 ± 12.2 | 23.6 ± 10.9 | 0.17 | 27.8 ± 16.1 | 26.0 ± 12.2 | 41.2 ± 15.7 | 0.005** |
| Creatinin (mg/dL) | 1.09 ± 0.69 | 0.96 ± 0.18 | 0.97 ± 0.27 | 0.67 | 1.16 ± 0.83 | 0.93 ± 0.21 | 0.99 ± 0.13 | 0.25 |
| Urea (mg/dL) | 36.6 ± 25.3 | 31.8 ± 17.3 | 28.7 ± 12.0 | 0.45 | 39.5 ± 29.9 | 30.1 ± 13.8 | 30.7 ± 10.8 | 0.19 |
Table 6.
Analysis of the influence of ACE2 G8790A and AT2R A1675G gene polymorphisms on clinical-laboratory variables in COVID-19 patients with lung involvement
| Variables | Infected group (n = 80) | |||||||
|---|---|---|---|---|---|---|---|---|
| ACE2 G8709A genotype | AT2R A1675G genotype | |||||||
| GG | GA | AA | P-value | AA | AG | GG | P-value | |
| Age (years) | 42.2 ± 14.7 | 30.8 ± 14.3 | 51.8 ± 26.1 | 0.03* | 38.4 ± 16.7 | 44.4 ± 11.8 | 45.6 ± 17.1 | 0.22 |
| WBC (103/mm3) | 6.63 ± 2.16 | 5.66 ± 1.91 | 6.00 ± 2.43 | 0.36 | 6.49 ± 2.04 | 6.86 ± 1.94 | 6.17 ± 2.46 | 0.58 |
| PLT (103/mm3) | 228.4 ± 64.6 | 235.1 ± 51.7 | 179.0 ± 60.0 | 0.22 | 236.2 ± 618.9 | 228.3 ± 65.4 | 209.6 ± 51.3 | 0.26 |
| Neutrophil (103/μL) | 4.35 ± 1.90 | 3.40 ± 1.81 | 4.08 ± 2.52 | 0.35 | 4.16 ± 2.03 | 4.54 ± 1.80 | 4.05 ± 1.91 | 0.69 |
| Lymphocyte (103/μL) | 1.64 ± 0.78 | 1.72 ± 0.61 | 1.45 ± 1.23 | 0.83 | 1.71 ± 0.74 | 1.64 ± 0.72 | 1.52 ± 0.89 | 0.64 |
| Eosinophil (103/μL) | 00.8 ± 0.08 | 0.06 ± 0.04 | 0.05 ± 0.05 | 0.53 | 0.07 ± 0.07 | 0.07 ± 0.08 | 0.07 ± 0.09 | 0.99 |
| Hemoglobin (g/dL) | 14.5 ± 1.83 | 13.2 ± 1.93 | 15.8 ± 0.92 | 0.02* | 14.3 ± 1.71 | 14.3 ± 2.29 | 14.6 ± 1.83 | 0.75 |
| D-dimer (μg/mL) | 491.4 ± 349.7 | 559.1 ± 566.6 | 654.6 ± 562.9 | 0.61 | 414.9 ± 340.8 | 641.4 ± 483.6 | 523.1 ± 303.8 | 0.08 |
| Fibrinogen (mg/dL) | 345.1 ± 129.6 | 312.7 ± 89.7 | 330.4 ± 87.1 | 0.73 | 324.4 ± 129.0 | 354.9 ± 132.9 | 352.0 ± 92.8 | 0.57 |
| Ferritin (ng/mL) | 93.6 ± 131.5 | 45.8 ± 59.0 | 154.8 ± 89.5 | 0.26 | 88.1 ± 144.3 | 95.4 ± 115.5 | 93.0 ± 90.8 | 0.97 |
| CRP (mg/L) | 17.9 ± 33.5 | 15.1 ± 19.7 | 42.6 ± 73.9 | 0.31 | 17.9 ± 40.5 | 27.0 ± 42.1 | 15.3 ± 18.7 | 0.55 |
| AST (IU/L) | 28.4 ± 18.6 | 23.4 ± 6.60 | 26.6 ± 5.36 | 0.68 | 24.9 ± 8.51 | 30.6 ± 20.0 | 29.6 ± 23.2 | 0.40 |
| ALT (IU/L) | 30.1 ± 27.7 | 20.7 ± 11.3 | 35.6 ± 29.3 | 0.49 | 25.1 ± 15.7 | 43.0 ± 46.1 | 25.7 ± 14.9 | 0.04* |
| Creatinin (mg/dL) | 0.98 ± 0.18 | 0.78 ± 0.12 | 1.05 ± 0.15 | 0.002** | 0.93 ± 0.18 | 1.02 ± 0.19 | 0.96 ± 0.18 | 0.22 |
| Urea (mg/dL) | 27.8 ± 8.75 | 21.5 ± 4.60 | 45.6 ± 28.7 | <0.001** | 27.6 ± 9.00 | 26.4 ± 7.08 | 30.0 ± 16.3 | 0.56 |