
Table 1.
Comparison of baseline data between the observation group and control group
| Basic factors | Non-HT group (n = 94) | HT group (n = 63) | t/x2 | P |
|---|---|---|---|---|
| Sex (male, %) | 59/60.8 | 39/61.9 | 0.003 | 0.958 |
| Age (year) | 35.85 ± 6.9 | 33.75 ± 8.1 | 0.372 | 0.666 |
| Smoking, n (%) | 24 (25.53) | 16 (25.39) | 0.116 | 0.142 |
| Alcohol, n (%) | 23 (23/93) | 10 (10/63) | 1.112 | 0.292 |
| FBG (mmol/L) | 7.427 ± 2.660 | 7.365 ± 3.131 | 0.139 | 0.1128 |
| Atrial fibrillation | 11 (11/93) | 15 (15/63) | 2.814 | 0.093 |
| WBC (×109) | 7.266 ± 2.547 | 7.237 ± 2.863 | 0.073 | 0.2543 |
| PLT (×109) | 279.2 ± 52.80 | 275.3 ± 49.89 | 0.4653 | 0.6423 |
| NEUT (×109) | 4.262 ± 0.8894 | 4.390 ± 0.8848 | 0.9808 | 0.374 |
| LYM (×109) | 1.254 ± 0.3528 | 1.311 ± 0.374 | 0.966 | 0.336 |
| TC (mmol/L) | 4.410 ± 0.4997 | 4.311 ± 0.7162 | 1.015 | 0.312 |
| TG (mmol/L) | 1.441 ± 0.2841 | 1.489 ± 0.2812 | 1.029 | 0.3052 |
| LDL-C (mmol/L) | 3.224 ± 0.8313 | 3.119 ± 0.498 | 0.903 | 0.368 |
| HCY (μmol/L) | 17.615 ± 4.2904 | 16.914 ± 5.4401 | 0.90 | 0.370 |
| FIB (g/L) | 3.163 ± 0.6877 | 3.382 ± 0.809 | 1.747 | 0.083 |
| D-D (mg/L) | 0.5832 ± 0.3270 | 0.2484 ± 0.07191 | 0.219 | 0.827 |
| PLR | 100.654 ± 47.667 | 139.219 ± 54.945 | 4.672 | <0.0001 |
| NIHSS | 9.0745 ± 4.467 | 10.667 ± 4.276 | 2.226 | 0.027 |
[i] D-D, D-dimer; FBG, fasting blood glucose; FIB, fibrinogen; HCY, homocysteine; LYM, lymphocyte; NEUT, neutrophil; NIHSS, National Institute of Health Stroke Scale; PLR, platelet to lymphocyte ratio; PLT, platelet; TC, total cholesterol; TG, triglycerides; WBC, white blood cell.
Table 2.
Univariate and multivariate Logistic Regression Analysis for Factors Associated with hemorrhagic transformation
| Variables | Univariate analysis | Multivariate analysis | ||||
|---|---|---|---|---|---|---|
| B (beta values) | P | 95% CI (Confidence interval) | B (beta values) | P | 95% CI (Confidence interval) | |
| PLR | 0.14 | <0.0001 | 0.979–0.992 | 0.31 | <0.0001 | 0.956–0.984 |
| NIHSS | 0.082 | 0.029 | 6.032 | 0.202 | 0.014 | 1.042–1.438 |
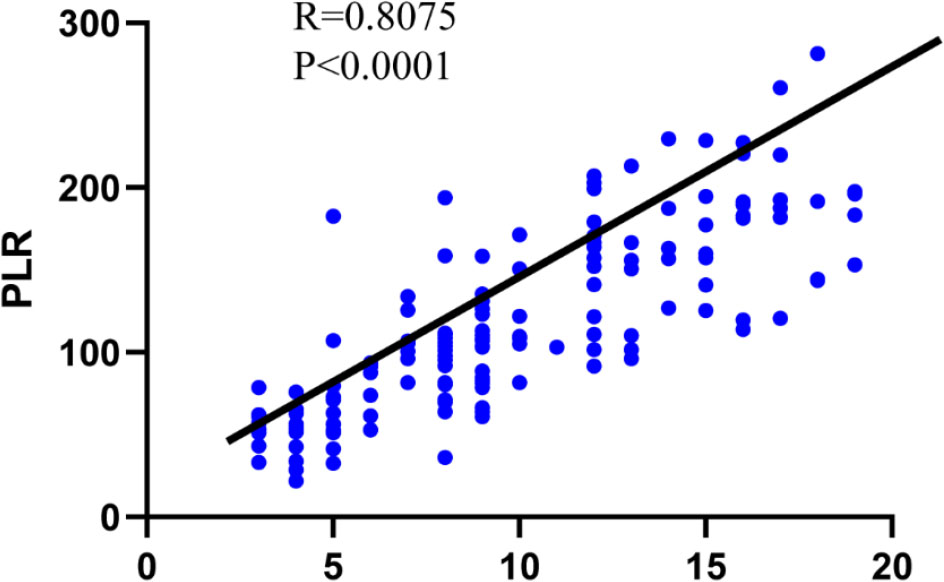
Figure 1.
Pearson's correlation of the PLR levels and NIHSS score.
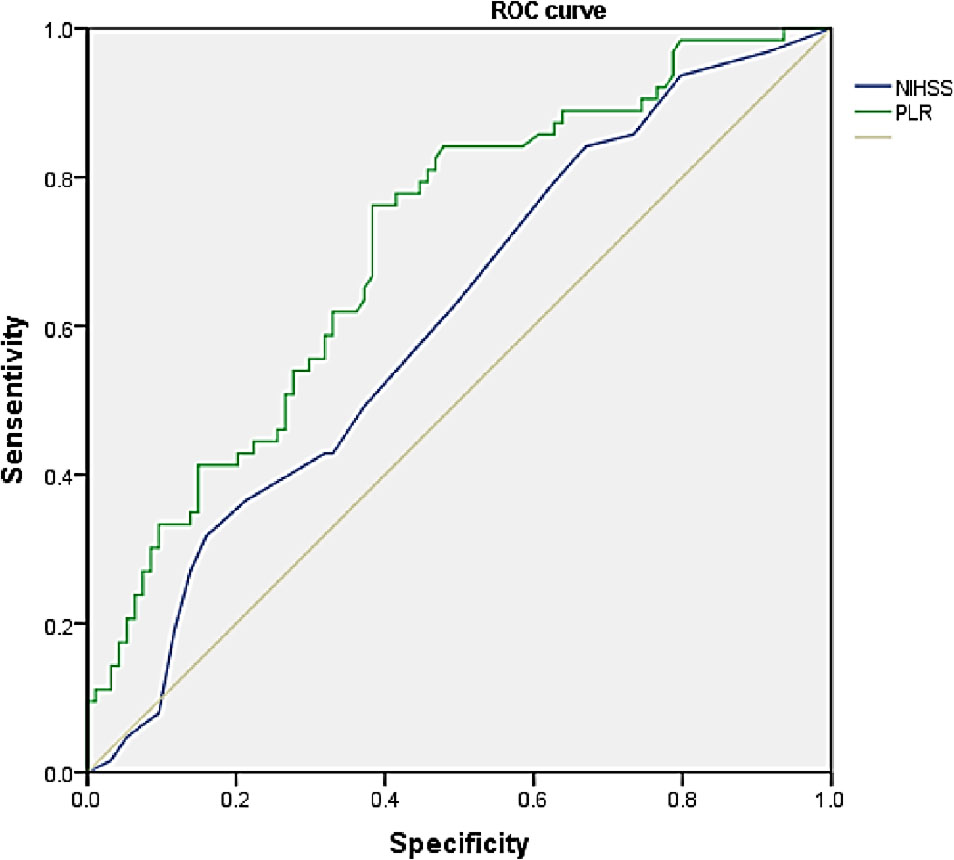
Figure 2.
The ROC curve of PLR levels and NIHSS.