
Table 1.
Primers used in this work
| Name | Sequence (5′–3′) |
|---|---|
| TOP2A-R | TTGGCATCATCGAGTTTGGGA |
| TOP2A-F | TGGCTGTGGTATTGTAGAAAGC |
| GAPDH-F | GACTTCAACAGCAACTCCCA |
| GAPDH-R | TGGGTGGTCCAGGGTTTCTT |
| miR-30c-2-3p-RT | GTCGTATCCAGTGCGTGTCGTGGA-GTCGGCAATTGCACT GGATACGACAGAGTAA |
| miR-30c-2-3p-F | ATCCAGTGCGTGTCGTG |
| miR-30c-2-3p-R | TGCTCTGGGAGAAGGCTGT |
| U6-RT | CGCTTCACGAATTTGCGTGTCAT |
| U6-R | CGCTTCACGAATTTGCGTGTCAT |
| U6-F | GCTTCGGCAGCACATATACTAAAAT |
[i] F, forward; GAPDH, glyceraldehyde-3-phosphate dehydrogenase; miR, micoRNA; R, reverse; RT, reverse transcription primer; TOP2A, DNA topoisomerase II alpha.
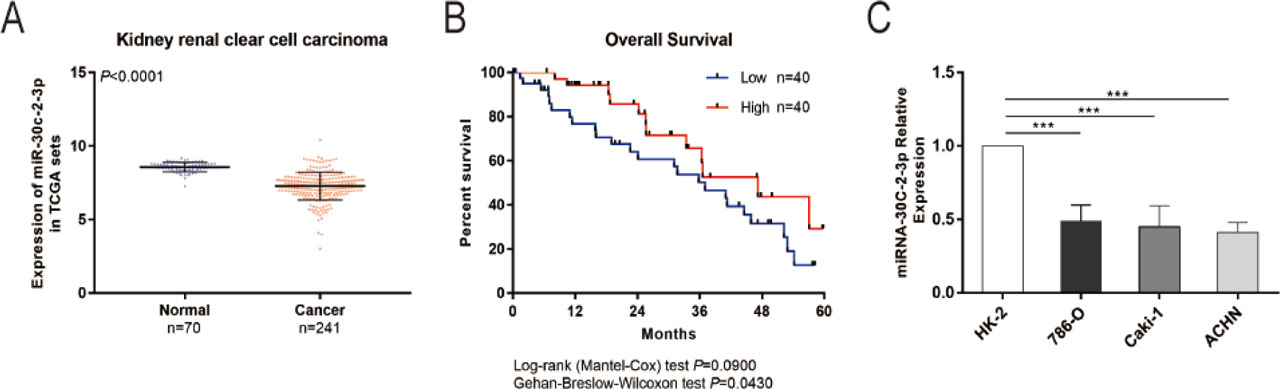
Figure 1.
miR-30c-2-3p expression in RCC cells. (A) The TCGA database was used to undertake an expression study of miR-30c-2-3p in RCC tissues (n = 241) and normal adjacent tissues (n = 70). (B) Analysis of the 5-year overall survival rate for RCC patients. (C) The expression of miR-30c-2-3p in RCC cell lines (786-O, Caki-1, and ACHN) and normal renal tubular epithelial cell line was examined using qRT-PCR (HK-2). ***P < 0.001.
miR, microRNA; qRT-PCR, quantitative real-time polymerase chain reaction; RCC, renal cell carcinoma; TCGA, The Cancer Genome Atlas.
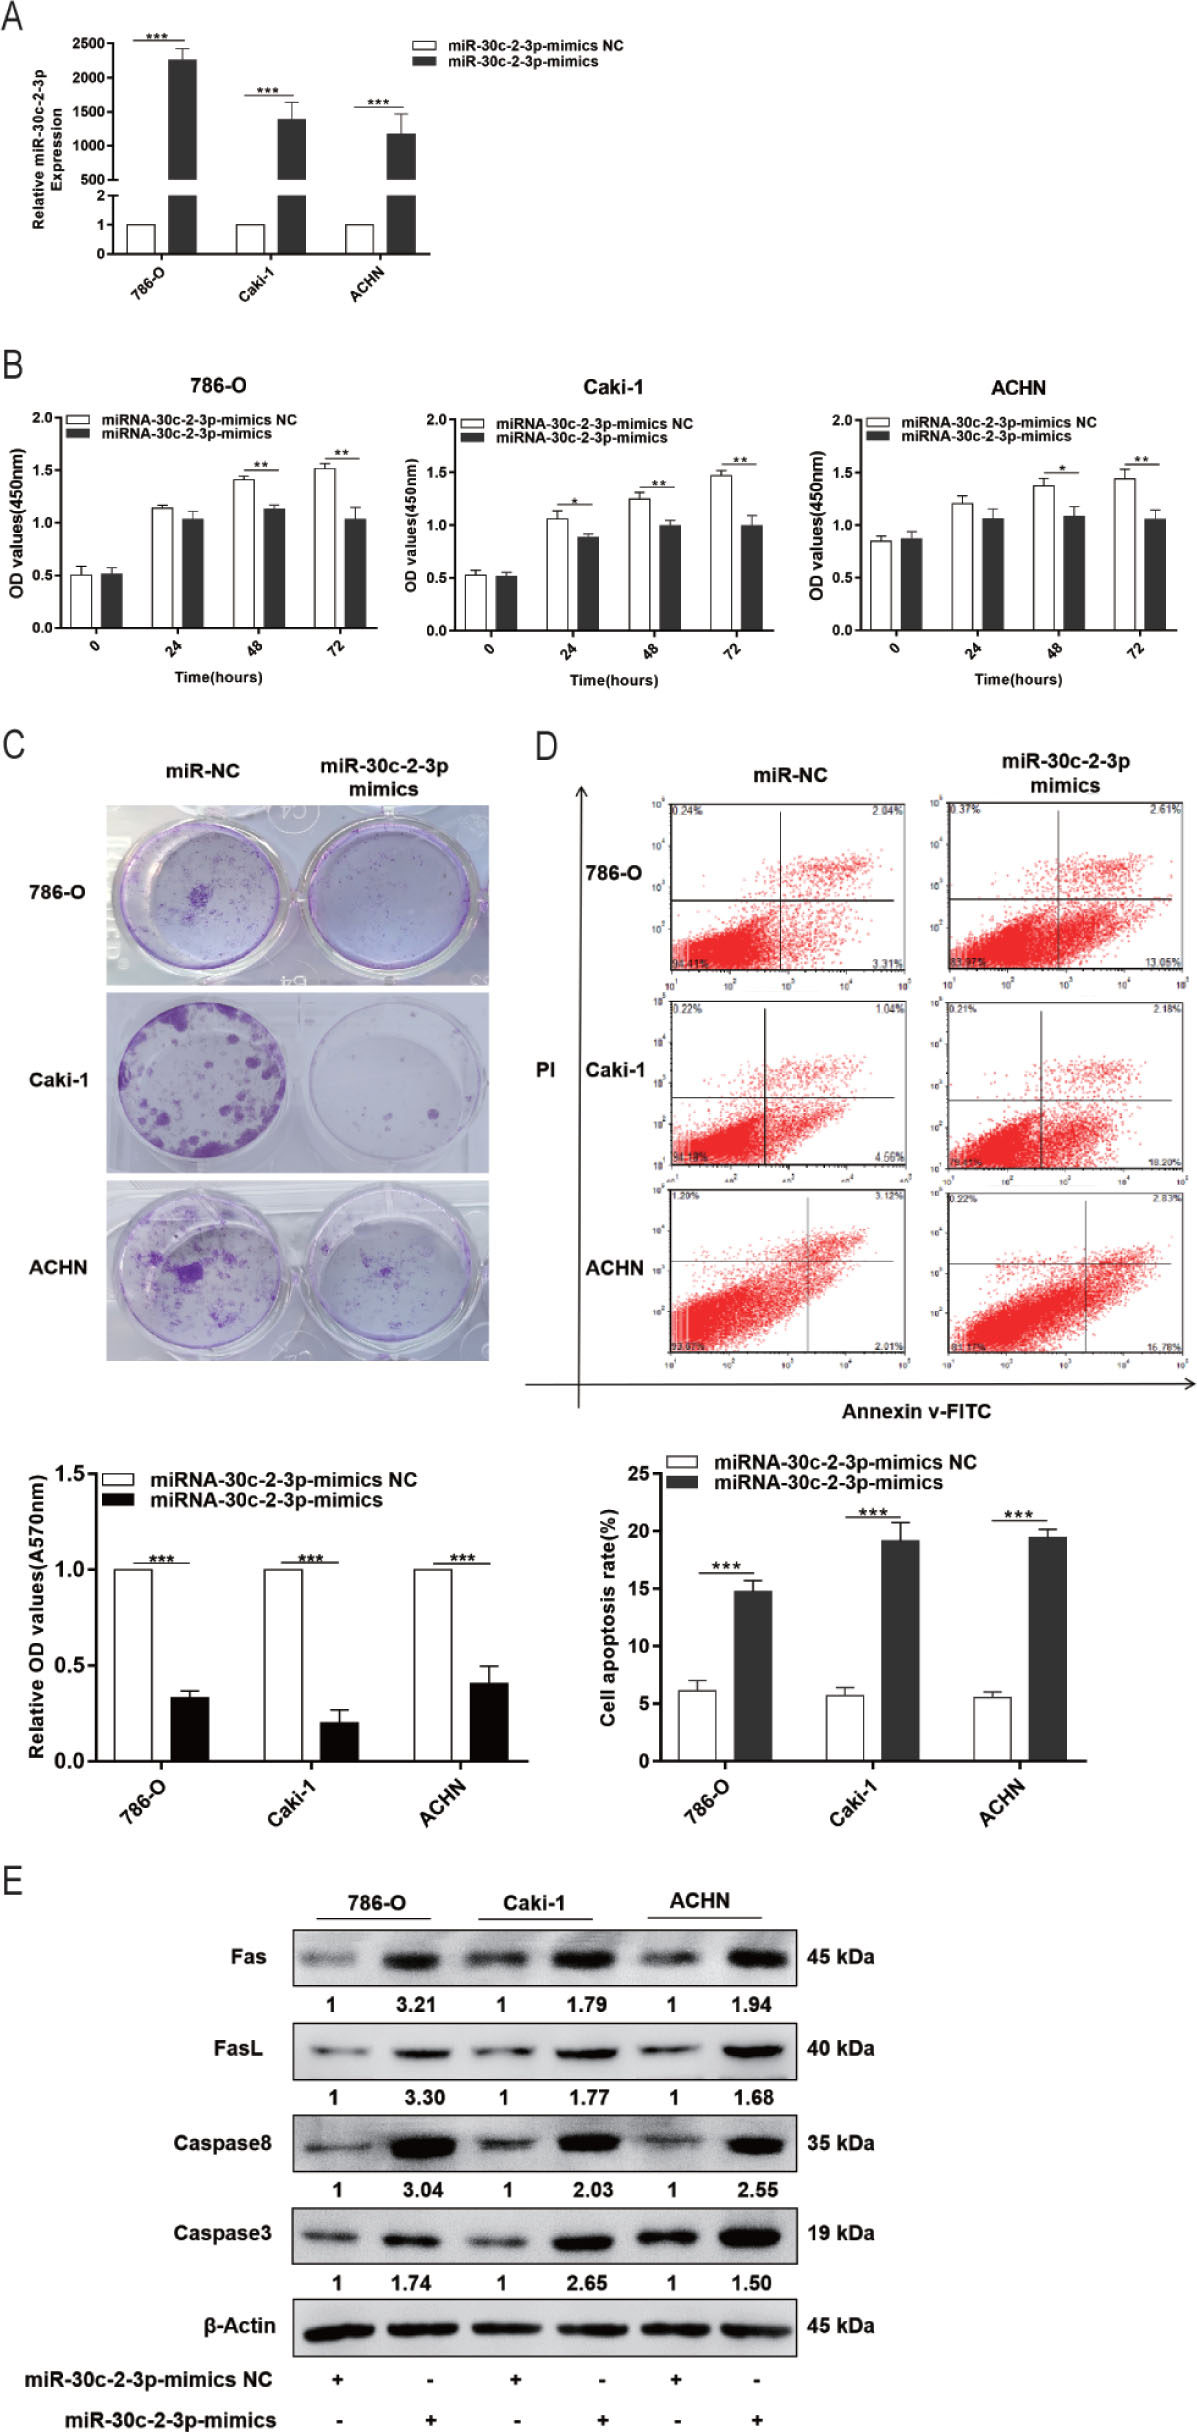
Figure 2.
RCC cells experience reduced proliferation and increased apoptosis when miR-30c-2-3p is expressed more typically. (A) miR-30c-2-3p expression after transfection. (B) Cell proliferation at 24 h, 48 h, and 72 h posttransfection. (C) After transfection, 786-O, Caki-1, and ACHN cells form colonies. (D) Analysis of apoptosis by flow cytometry following transfection with NC or miR-30c-2-3p mimics. (E) Fas, FasL, caspase 3, and caspase 8 protein expression in 786-O, Caki-1, and ACHN cells after miR-30c-2-3p mimic transfection or NC. *P < 0.05, **P < 0.01, ***P < 0.001. miR, microRNA; NC, negative control; RCC, renal cell carcinoma; TOP2A, DNA topoisomerase II alpha; UTR, untranslated region.
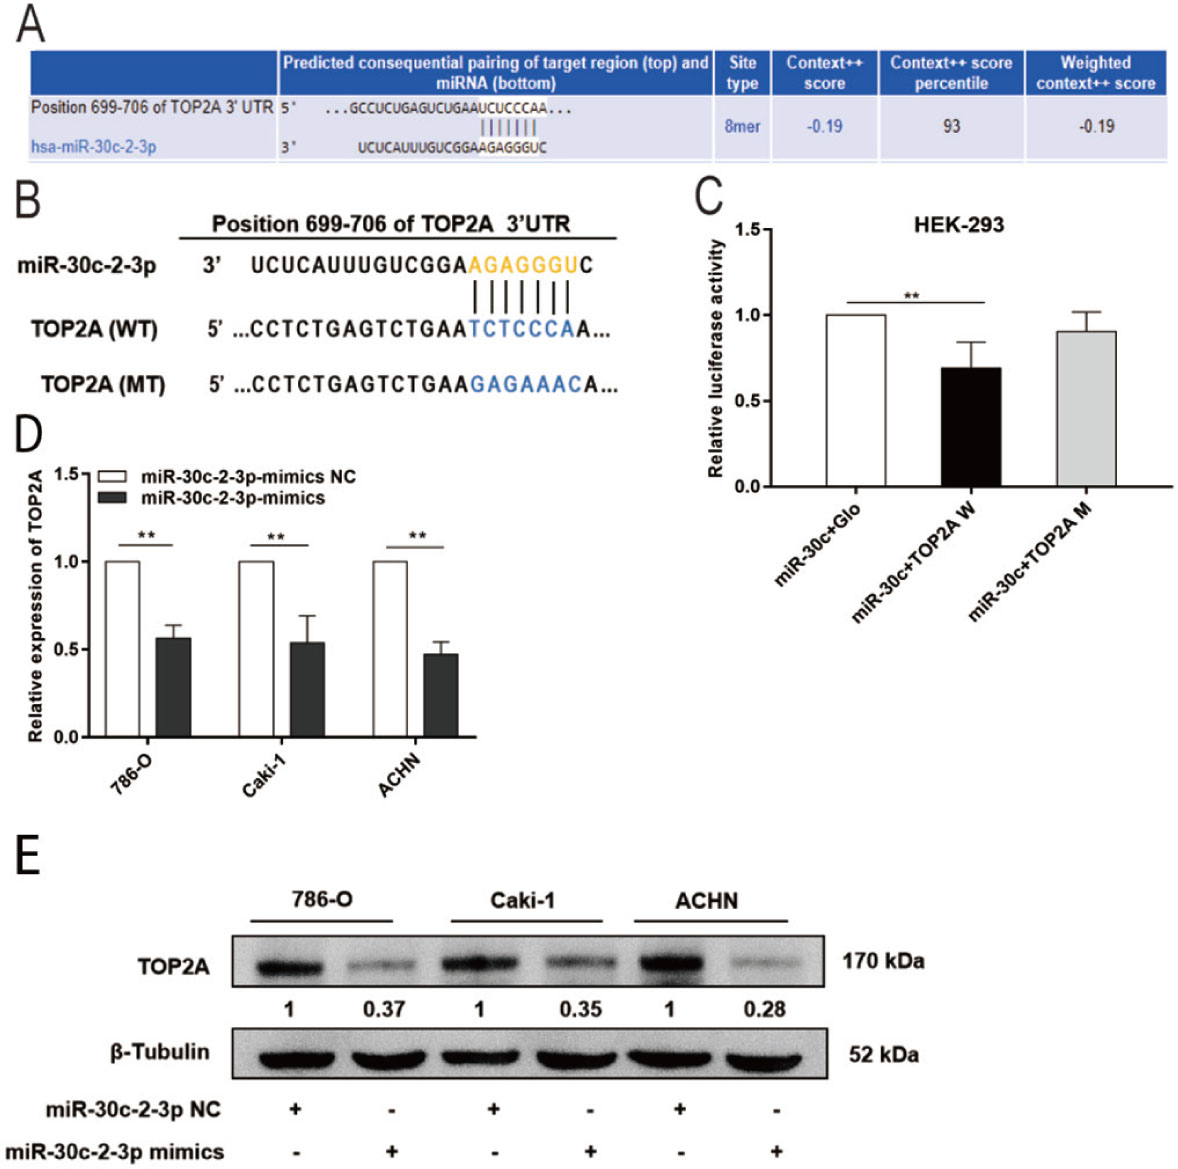
Figure 3.
TOP2A is the direct target of miR-30c-2-3p. (A) Predicted binding site of miR-30c-2-3p in TOP2A mRNA 3′-UTR. (B) The sequences of wild-type (TOP2A W) and mutant (TOP2A M) genes. (C) Dual-luciferase reporter assay to determine the influence of miR-30c-2-3p on wild-type and mutant miR-30c-2-3p binding site on TOP2A 3‘-UTR. Cells transfected with miR-30c-2-3p overexpression plasmid and GLO plasmids were used as controls. (D, E) TOP2A mRNA and protein expression in 786-O, Caki-1, and ACHN cells following transfection with miR-30c-2-3p mimics or NC. **P < 0.01.
miR, microRNA; NC, negative control TOP2A, DNA topoisomerase II alpha; UTR, untranslated region.
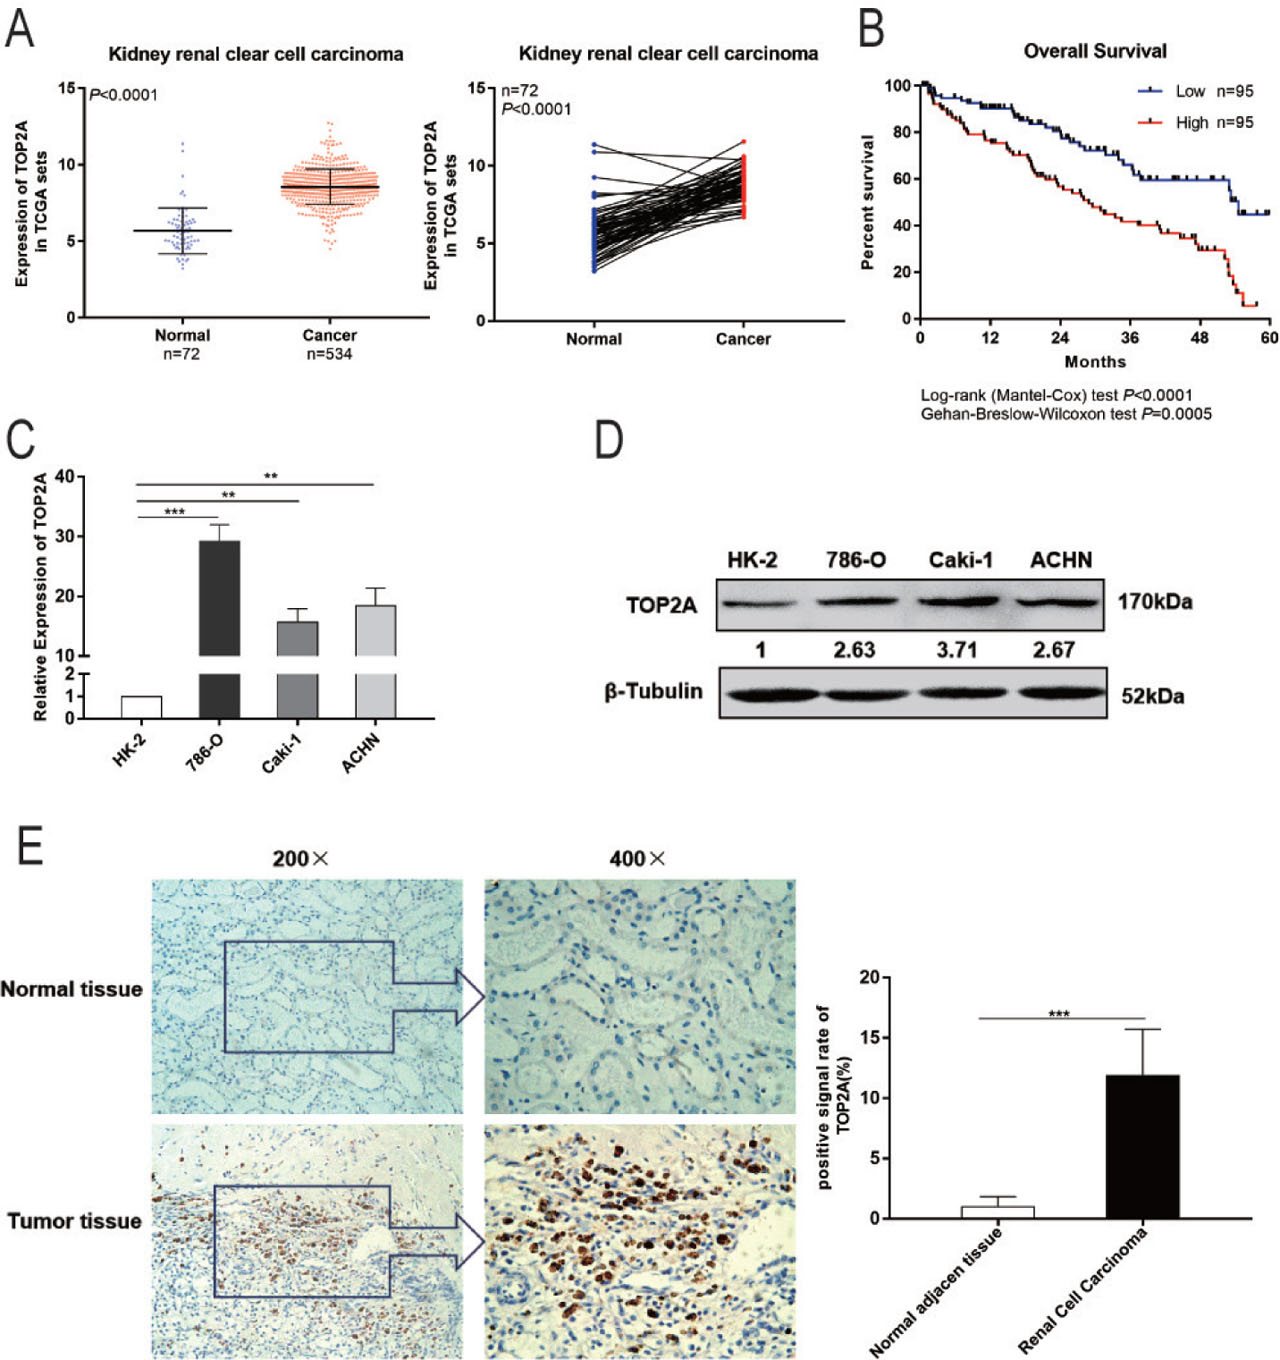
Figure 4.
Expression of TOP2A in RCC tissues and cell lines. (A) Expression analysis of TOP2A in RCC tissues (n = 534) and normal adjacent tissues (n = 72) performed in TCGA database. (B) Five-year overall survival percentage analysis of patients with RCC. (C, D) TOP2A expression in 786-O, Caki-1, ACHN, and HE-2 cells. (E) TOP2A expression in RCC and adjacent tissues. **P < 0.01, ***P < 0.001.
miR, microRNA; RCC, renal cell carcinoma; TCGA, The Cancer Genome Atlas; TOP2A, DNA topoisomerase II alpha; UTR, untranslated region.
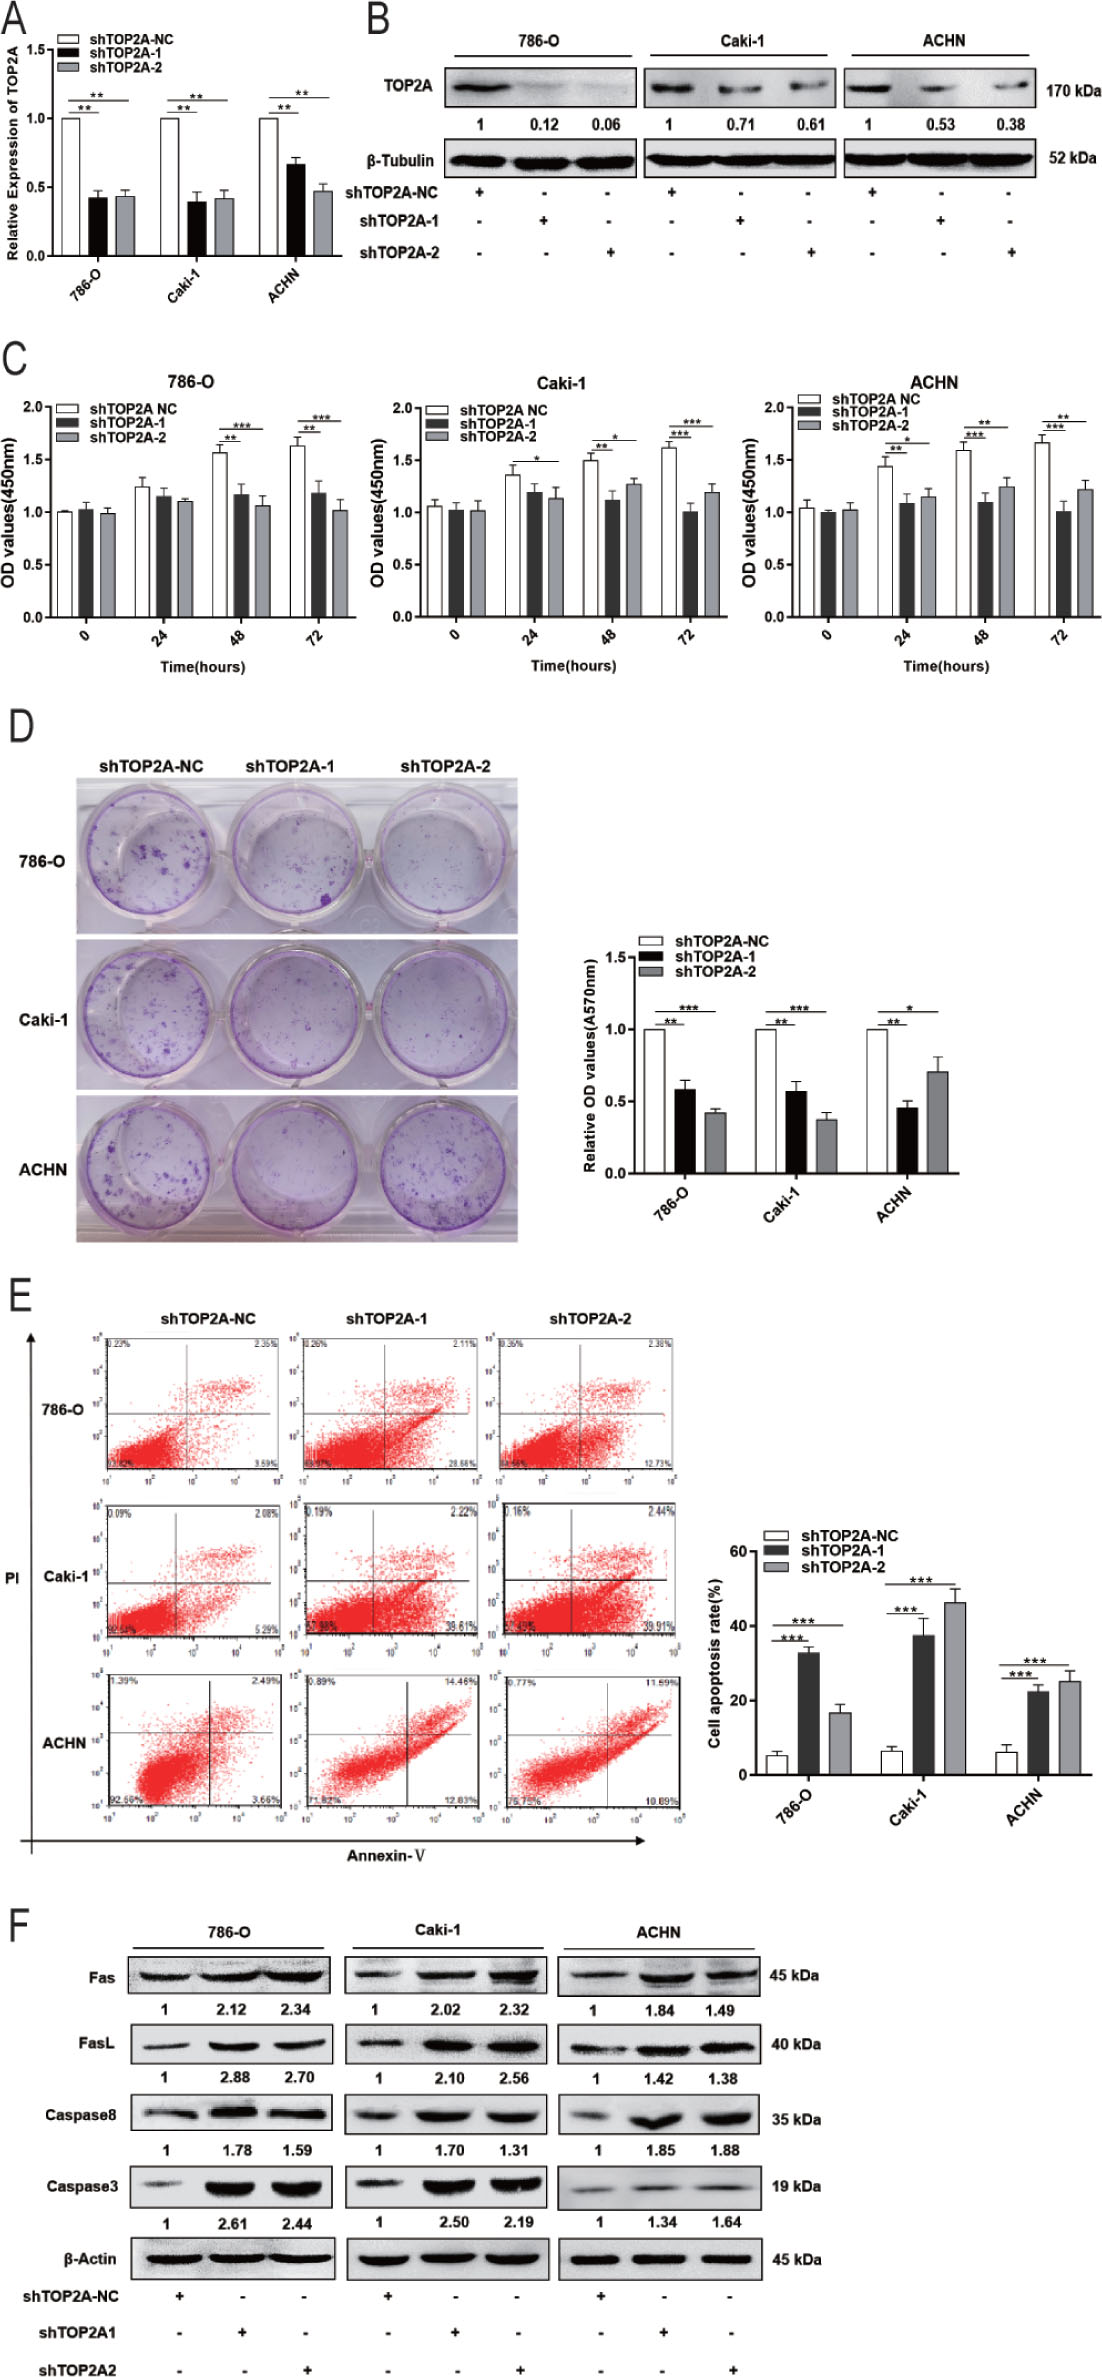
Figure 5.
TOP2A interference inhibits growth of RCC cells and promotes their apoptosis. ACHN, 786-O, and Caki-1 cells were transfected with shTOP2A-1, shTOP2A-2, or a negative control. (A, B) TOP2A mRNA and protein abundance after transfection. (C) Cell proliferation after transfection. (D) Colony formation in 786-O, Caki-1, and ACHN cells after transfection. (E) Study of apoptosis by flow cytometry following transfection with shTOP2A-1, shTOP2A-2, or a negative control. (F) Expression of Fas, FasL, caspase 8, and caspase 3 after transfection with shTOP2A-1, shTOP2A-2, or a negative control. *P < 0.05, **P < 0.01, ***P < 0.001.
miR, microRNA; RCC, renal cell carcinoma; sh, short hairpin; TOP2A, DNA topoisomerase II alpha.
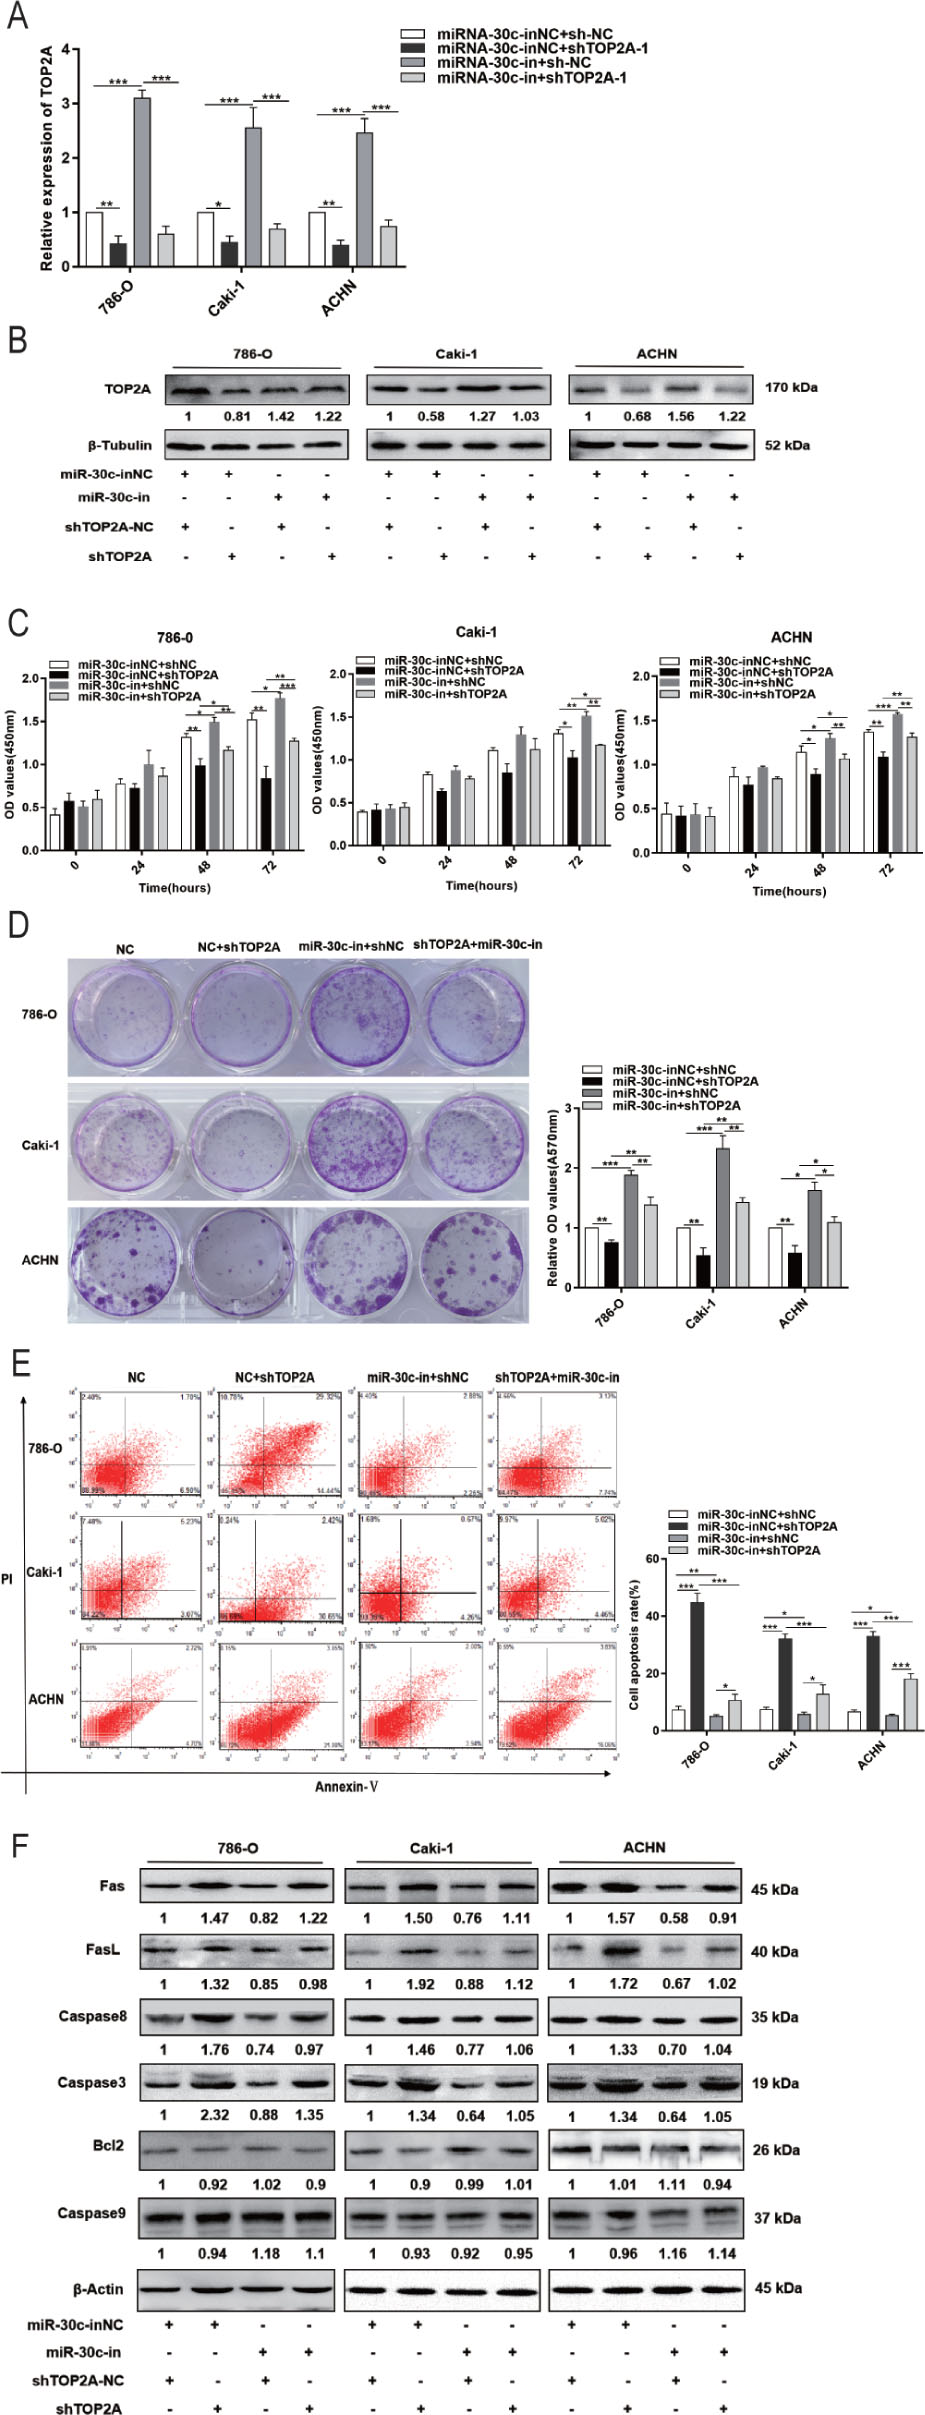
Figure 6.
RCC development regulated by miR-30c-2-3p is caused by TOP2A. (A, B) TOP2A expression in 786-O, Caki-1, and ACHN cells treated with miR-30c-2-3p inhibitors (miR-30c-in) and/or TOP2A interference RNAs (shTOP2A). (C, D) Viability and colony formation results of 786-O, Caki-1, and ACHN cells treated with miR-30c-2-3p inhibitors (miR-30c-in) and/or TOP2A interference RNAs (shTOP2A). (E) Apoptosis changes of 786-O, Caki-1, and ACHN cells pre-transfected with different RNAs for 48 h. (F) Abundance of Fas/FasL/caspase 8/caspase 3/Bcl2/caspase 9 proteina in 786-O, Caki-1, and ACHN cells treated with miR-30c-2-3p inhibitors (miR-30c-in) and/or TOP2A interference RNAs (shTOP2A). *P < 0.05, **P < 0.01, ***P < 0.001.
miR, microRNA; RCC, renal cell carcinoma; sh, short hairpin; TOP2A, DNA topoisomerase II alpha.
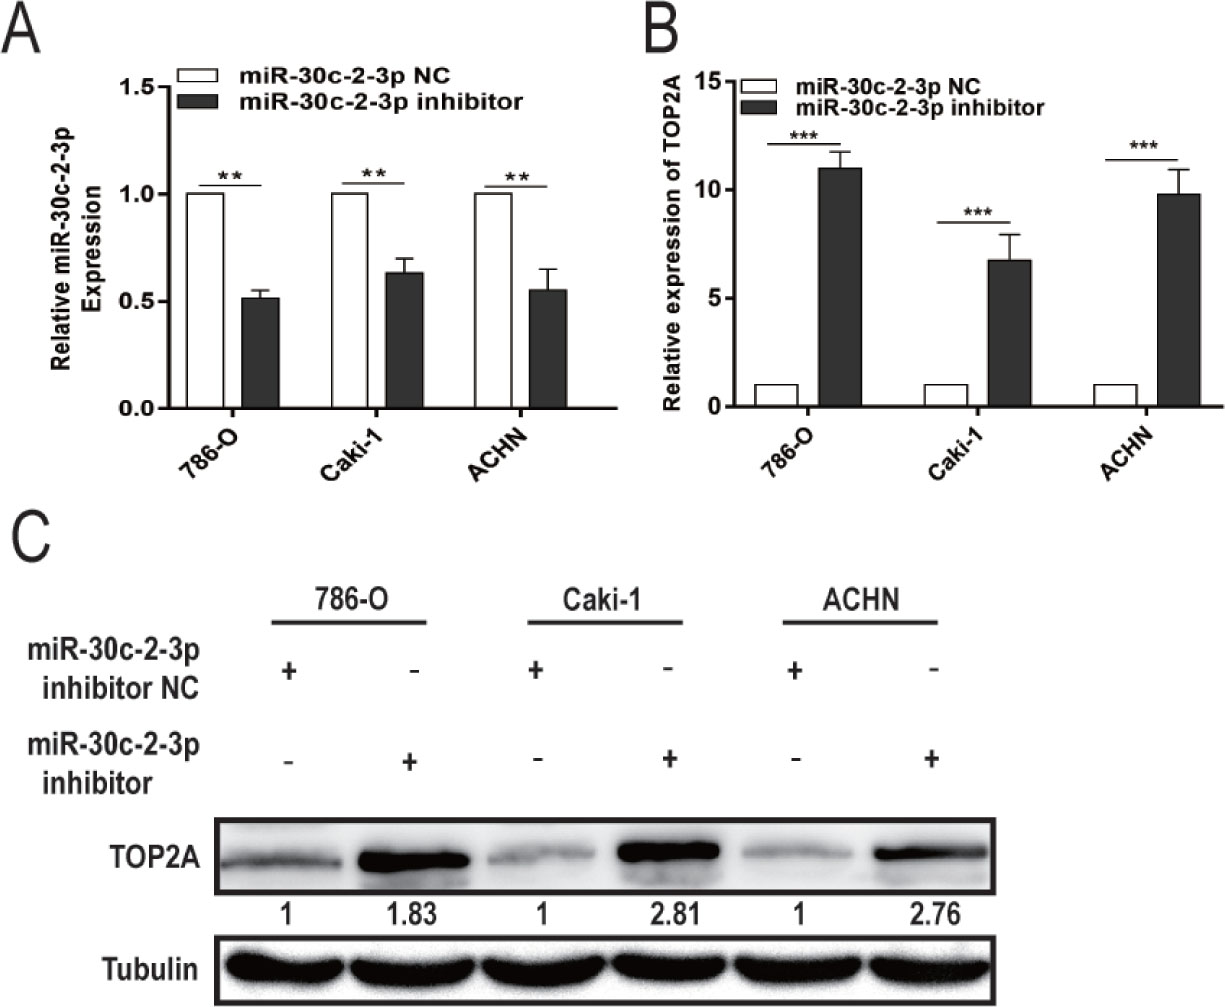
Figure S1.
Transfection efficiency verification of miR-30c-2-3p inhibitor. (A) miR-30c-2-3p expression after transfection with NC or miR-30c-2-3p inhibitor. (B) The mRNA expression of TOP2A after transfection with NC or miR-30c-2-3p inhibitor. (C) TOP2A protein expression in 786-O, Caki-1, and ACHN cells after miR-30c-2-3p mimic transfection or NC. **P < 0.01, ***P < 0.001.
miR, microRNA; TOP2A, DNA topoisomerase II alpha.