
Table 1.
Baseline characteristics of the study participants (n = 10,299).
| Characteristics | Without eosinophilia (n = 9311) | With eosinophilia (n = 988) | ||
|---|---|---|---|---|
| Having management (n = 174) | No management (n = 814) | P | ||
| Sex, n (%) | 0.625† | |||
| Male | 6287 (67.5) | 95 (54.6) | 425 (52.2) | |
| Female | 3024 (32.5) | 79 (45.4) | 389 (47.8) | |
| Age, years, median (Q1, Q3) | 51.0 (40.0, 60.0) | 53.0 (41.2, 61.0) | 53.0 (43.0, 61.0) | 0.676‡ |
| Clinic that analyzed CBC results, n (%) | <0.001† | |||
| GP | 6927 (74.4) | 73 (42.0) | 684 (84.0) | |
| Premium checkup clinic | 1978 (21.2) | 97 (55.7) | 100 (12.3) | |
| Primary care unit | 406 (4.4) | 4 (2.3) | 30 (3.7) | |
| AEC, cells/uL, median (Q1, Q3) | 152.6 (88.5, 250.0) | 811.7 (602.5, 1178.0) | 666.4 (567.5, 926.9) | <0.001‡ |
Table 2.
Type of management received by patients with eosinophilia classified by clinic that analyzed CBC results (n = 174).
| Type of management | GP (n = 73) | Primary care unit (n = 4) | Premium checkup (n = 97) | Total (n = 174) |
|---|---|---|---|---|
| History | 20 (27.4) | 0 | 12 (12.4) | 32 (18.4) |
| Atopic history | 14 (19.2) | 0 | 10 (10.3) | 24 (13.8) |
| Risk of parasite infection† | 10 (13.7) | 0 | 2 (2.1) | 12 (6.9) |
| Photosensitive rash, polyarthritis | 1 (1.4) | 0 | 0 | 1 (0.6) |
| Family history of eosinophilia | 0 | 0 | 0 | 0 |
| Physical examination | 63 (86.3) | 2 (50.0) | 97 (100.0) | 162 (93.1) |
| Abnormal lung sound | 60 (82.2) | 2 (50.0) | 96 (99.0) | 158 (90.8) |
| Skin lesion | 21 (28.8) | 1 (25.0) | 14 (14.4) | 36 (20.7) |
| Hepatosplenomegaly | 18 (24.7) | 0 | 91 (93.8) | 109 (62.6) |
| Abdominal mass | 18 (24.7) | 0 | 5 (5.2) | 23 (13.2) |
| Lymphadenopathy | 4 (5.5) | 0 | 17 (17.5) | 21 (12.1) |
| Laboratory investigation | 13 (17.8) | 0 | 3 (3.1) | 16 (9.2) |
| Repeat CBC | 2 (2.7) | 0 | 0 | 2 (1.1) |
| Stool examination | 11 (15.1) | 0 | 3 (3.1) | 14 (8.0) |
| Others‡ | 0 | 0 | 0 | 0 |
| Anthelmintic drug was prescribed | 51 (69.9) | 4 (100.0) | 77 (79.4) | 132 (75.9) |
| No request for stool examination | 44 (60.3) | 4 (100.0) | 77 (79.4) | 125 (71.8) |
| Stool examination returning a normal result | 5 (6.8) | 0 | 0 | 5 (2.9) |
| Stool examination returning an abnormal result | 2 (2.7) | 0 | 0 | 2 (1.1) |
| Internist consultation | 10 (13.7) | 0 | 16 (16.5) | 26 (14.9) |
Data are presented as number (%).
† From eating raw cooked food, walking barefoot, or traveling to an endemic area prone to parasite infections.
‡ Others included serology for infection (hepatitis B and C virus, human immunodeficiency virus, parasite), autoantibody, skin prick test, and imaging studies (ultrasound, computed tomography, magnetic resonance imaging).
CBC, complete blood count; GP, general practice.
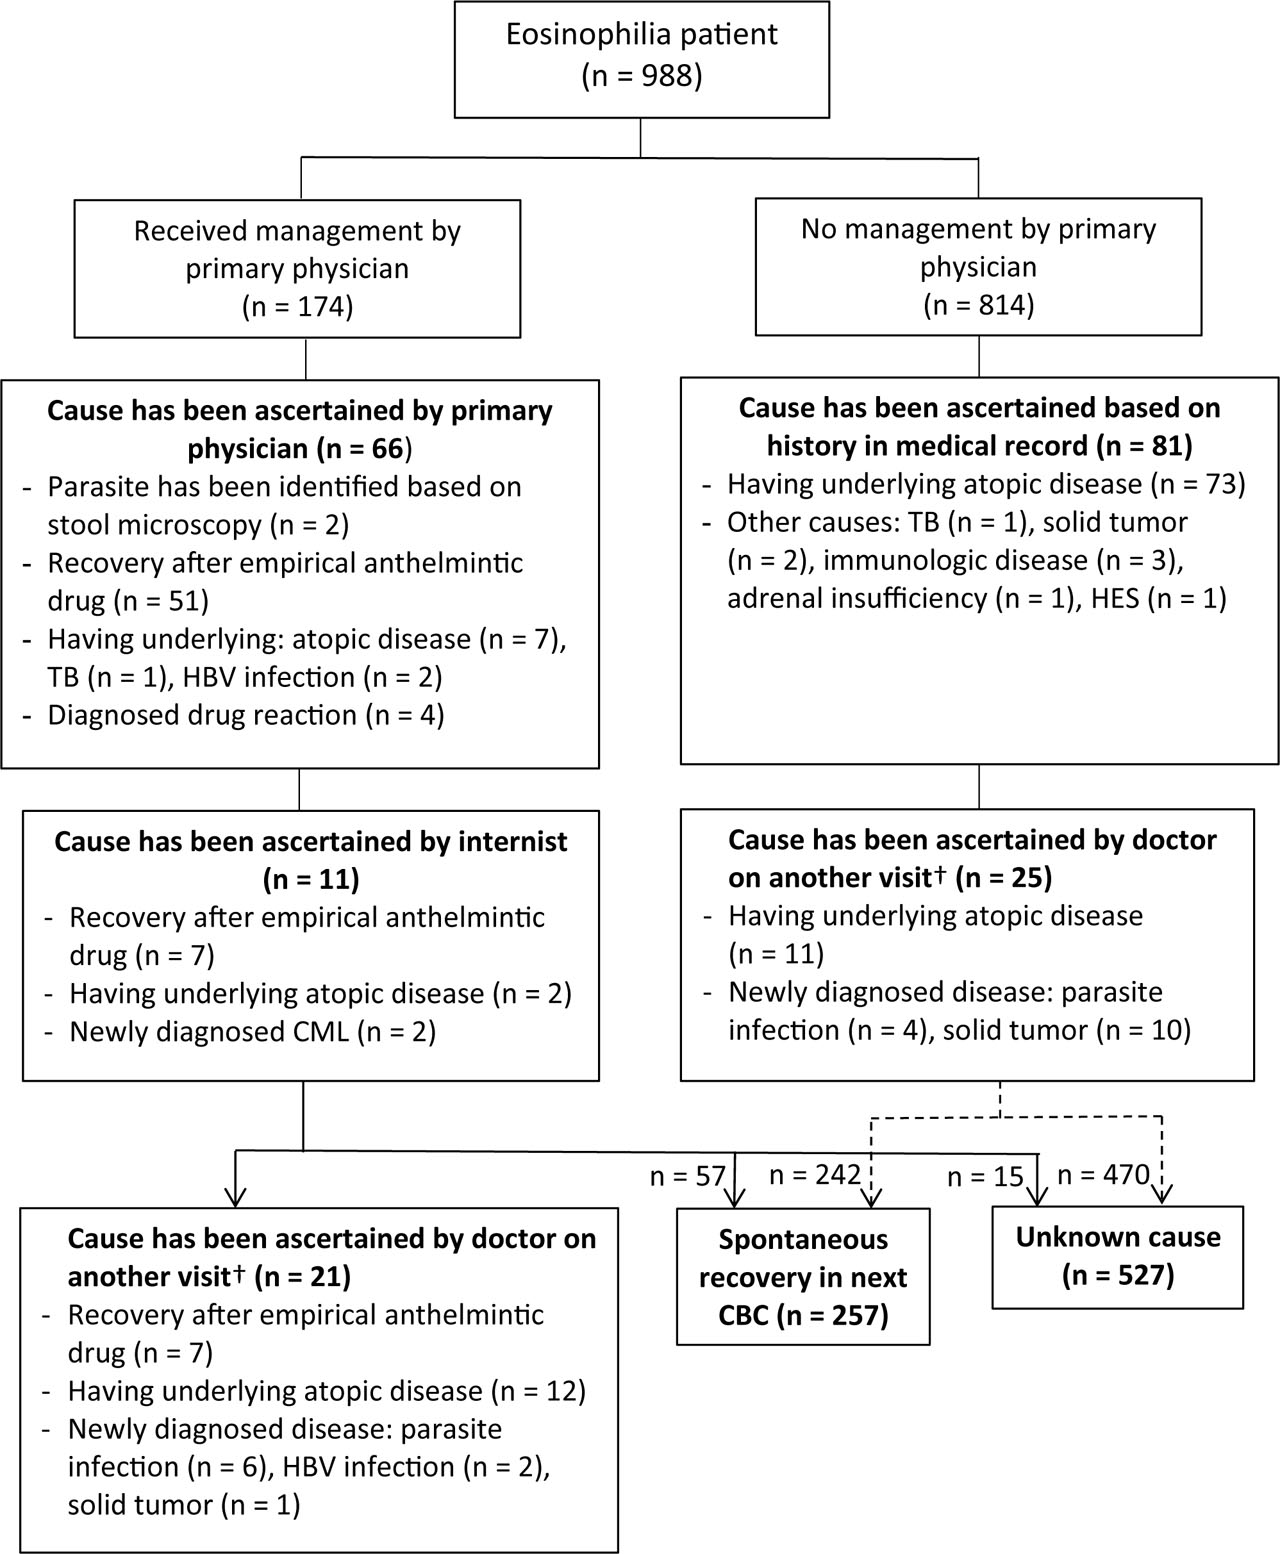
Figure 1.
Details of management and outcome of eosinophilia (n = 988).
†Based on review of medical records, diseases were diagnosed within 3 years after the visit where CBC tests showed eosinophilia. CBC, complete blood count; CML, chronic myeloid leukemia; HBV, hepatitis B virus; HES, hypereosinophilic syndrome; TB, tuberculosis.
Table 3.
Prevalence of possible causes of eosinophilia stratified by diagnosis (n = 204).
| Possible causes | Total | Known underlying disease (n = 91) | Diagnosed by the primary physician (n = 66) | Diagnosed by an internist (n = 11) | Diagnosed by a doctor on another visit† (n = 36) |
|---|---|---|---|---|---|
| Atopic disease | 105 (51.5) | 84 (80.0) | 7 (6.7) | 2 (1.9) | 12 (11.4) |
| Allergic rhinitis | 65 (31.9) | 56 (86.2) | 2 (3.1) | 0 | 7 (10.7) |
| Asthma | 23 (11.3) | 20 (87.0) | 0 | 1 (4.3) | 2 (8.7) |
| Allergic rhinitis and asthma | 7 (3.4) | 7 (100.0) | 0 | 0 | 0 |
| Atopic dermatitis | 3 (1.5) | 1 (33.3) | 1 (33.3) | 0 | 1 (33.3) |
| Urticaria | 4 (2.0) | 0 | 2 (50.0) | 0 | 2 (50.0) |
| Food allergy | 2 (1.0) | 0 | 1 (50.0) | 1 (50.0) | 0 |
| Allergic conjunctivitis | 1 (0.5) | 0 | 1 (100.0) | 0 | 0 |
| Infection | 75 (36.8) | 1 (1.3) | 55 (73.4) | 7 (9.3) | 12 (16.0) |
| Parasite infestation | 70 (34.3) | 0 | 53 (75.7) | 7 (10.0) | 10 (14.3) |
| Viral infection | 3 (1.5) | 0 | 1 (33.3) | 0 | 2‡ (66.7) |
| TB | 2 (1.0) | 1 (50.0) | 1 (50.0) | 0 | 0 |
| Solid tumor | 13 (6.4) | 2 (15.4) | 0 | 0 | 11 (84.6) |
| Breast cancer | 5 (2.5) | 1 (20.0) | 0 | 0 | 4 (80.0) |
| Prostate cancer | 3 (1.5) | 1 (33.3) | 0 | 0 | 2 (66.7) |
| Lung cancer | 2 (1.0) | 0 | 0 | 0 | 2 (100.0) |
| Rectal cancer | 1 (0.5) | 0 | 0 | 0 | 1 (100.0) |
| Ovarian cancer | 1 (0.5) | 0 | 0 | 0 | 1 (100.0) |
| Parotid cancer | 1 (0.5) | 0 | 0 | 0 | 1 (100.0) |
| Drug reaction: allopurinol | 4 (2.0) | 0 | 4 (100.0) | 0 | 0 |
| Autoimmune disease | 3 (1.4) | 3 (100.0) | 0 | 0 | 0 |
| Rheumatoid arthritis | 1 (0.5) | 1 (100.0) | 0 | 0 | 0 |
| Psoriasis | 1 (0.5) | 1 (100.0) | 0 | 0 | 0 |
| Autoimmune thyroid disease | 1 (0.5) | 1 (100.0) | 0 | 0 | 0 |
| Hematologic disease | 3 (1.4) | 1 (33.3) | 0 | 2 (64.7) | 0 |
| HES | 1 (0.5) | 1 (100.0) | 0 | 0 | 0 |
| Chronic myeloid leukemia | 2 (1.0) | 0 | 0 | 2 (100.0) | 0 |
| Adrenal insufficient | 1 (0.5) | 0 | 0 | 0 | 1 (100.0) |
Table 4.
Factors associated with the primary physician’s management and identified cause of eosinophilia (n = 988).
| Factor | Diagnosis of eosinophilia | Sending laboratory diagnostic work-up of eosinophilia | Internist consultation | Identified cause of eosinophilia | ||||
|---|---|---|---|---|---|---|---|---|
| Adjusted OR (95% CI) | P | Adjusted OR (95% CI) | P | Adjusted OR (95% CI) | P | Adjusted OR (95% CI) | P | |
| Age ≥60 years (n = 289) | 0.93 (0.62, 1.41) | 0.747 | 0.40 (0.11, 1.44) | 0.163 | 1.15 (0.40, 3.25) | 0.798 | 0.91 (0.57, 1.46) | 0.704 |
| Sex: Female (n = 468) | 0.91 (0.63, 1.33) | 0.625 | 0.58 (0.19, 1.78) | 0.339 | 0.78 (0.30, 2.07) | 0.625 | 1.29 (0.84, 1.96) | 0.243 |
| Clinic | ||||||||
| GP (n = 757) | 1 | 1 | 1 | 1 | ||||
| PCU (n = 34) | 0.82 (0.19, 3.55) | 0.789 | 0 (0, Inf) | 0.995 | 0 (0, Inf) | 0.993 | 0.42 (0.06, 2.75) | 0.367 |
| Premium checkup (n = 197) | 4.59 (1.57, 13.42) | 0.005* | 0.33 (0, 26.89) | 0.619 | 2.06 (0.06, 67.49) | 0.685 | 0.88 (0.21, 3.73) | 0.860 |
| Physician | ||||||||
| Intern (n = 765) | 1 | 1 | 1 | 1 | ||||
| Resident FM (n = 11) | 0 (0, Inf) | 0.975 | 0 (0, Inf) | 0.997 | 0 (0, Inf) | 0.996 | 1.76 (0.17, 18.62) | 0.640 |
| Staff FM (n = 212) | 2.39 (0.82, 6.98) | 0.110 | 2.76 (0.03, 227.88) | 0.652 | 6.01 (0.18, 199.46) | 0.315 | 1.40 (0.33, 5.91) | 0.646 |
| CBC results | ||||||||
| WBC ≥10,000 cells/μL (n = 104) | 0.85 (0.47, 1.54) | 0.593 | 0 (0, Inf) | 0.991 | 1.54 (0.44, 5.31) | 0.497 | 0.51 (0.22, 1.15) | 0.105 |
| Severity of eosinophilia | ||||||||
| Mild (n = 908) | 1 | 1 | 1 | 1 | ||||
| Moderate to severe (n = 80) | 3.52 (1.97, 6.32) | <0.001* | 17.13 (5.74, 51.11) | <0.001* | 6.38 (1.95, 20.93) | 0.002 * | 1.94 (0.98, 3.83) | 0.056 |
| Anemia† (n = 102) | 1.63 (0.91, 2.94) | 0.102 | 1.79 (0.43, 7.40) | 0.422 | 1.78 (0.48, 6.63) | 0.392 | 0.65 (0.30, 1.40) | 0.271 |
| Abnormal platelet count‡ (n = 27) | 1.11 (0.40, 3.11) | 0.840 | 3.35 (0.58, 19.44) | 0.178 | 0.76 (0.08, 7.19) | 0.810 | 1.005 (0.29, 3.47) | 0.994 |
CBC, complete blood count; CI, confidence interval; FM, family medicine; GP, general practice; OR, odds ratio; PCU, primary care unit; WBC, white blood cell count.