
Table 1.
HBsAg and anti-HBs levels after 1417 newborns were vaccinated with the hepatitis B vaccine
| HBsAg | Number of newborns | Anti-HBs | ||
|---|---|---|---|---|
| <10 mIU/mL (%) | 10–99 mIU/mL (%) | ≥100 mIU/mL (%) | ||
| ≤ 0.06 IU/mL | 1111 | 229 (20.6) | 259 (23.3) | 623 (56.1) |
| >0.06 IU/mL | 306 | 204 (66.7) | 69 (22.6) | 33 (10.8) |
[i] Anti-HBs, hepatitis B surface antibodies; HBsAg, hepatitis B surface antigen.
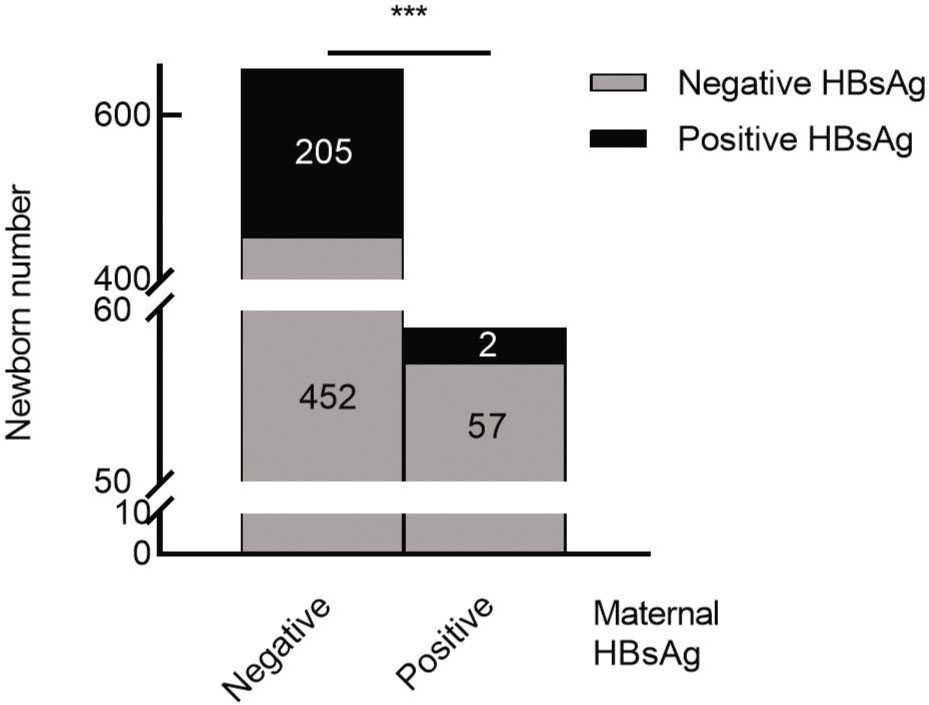
Figure 1.
Newborn HBsAg status (black bars, positive; gray bars, negative) grouped by maternal HBsAg status. ***P < 0.01 (Fisher exact test). HBsAg, hepatitis B surface antigen.
Table 2.
HBsAg and the distribution of anti-HBs in neonates with different concentrations of anti-HBs in the mothers
| Newborn | Maternal anti-HBs (mIU/mL) | ||
|---|---|---|---|
| <10 (%) | 10–99 (%) | ≥100 (%) | |
| Number | 225 | 167 | 265 |
| HBsAg-positive rate (%)*** | 61.33 | 25.15 | 9.34 |
| Anti-HBs <10 mIU/mL | 193 (85.8) | 8 (4.8) | 4 (1.5) |
| 10.00 IU/mL ≤ anti-HBs ≤ 99 IU/mL | 24 (10.7) | 133 (79.5) | 5 (1.9) |
| Anti-HBs ≥ 100 mIU/mL | 8 (3.6) | 26 (15.7) | 256 (96.6) |
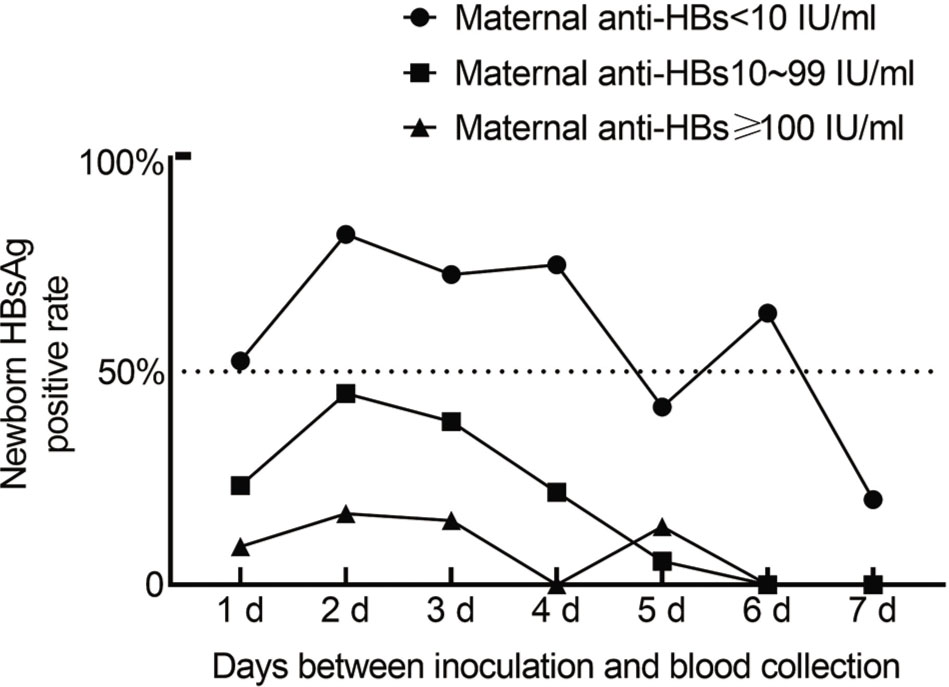
Figure 2.
The proportion of neonatal HBsAg positives (mother with negative HBsAg) at various maternal anti-HBs concentrations (solid circles, <10 IU/mL; solid squares, 10–99 IU/mL; solid triangles, ≥100 IU/mL) and with days between vaccination and blood collection. Within 7 d of vaccination, among newborns with negative anti-HBs, the proportion of those (positive rate) of HBsAg was close to or >50%, while that for mothers with low and high levels of anti-HBs was <50%. Anti-HBs, hepatitis B surface antibodies; HBsAg, hepatitis B surface antigen.
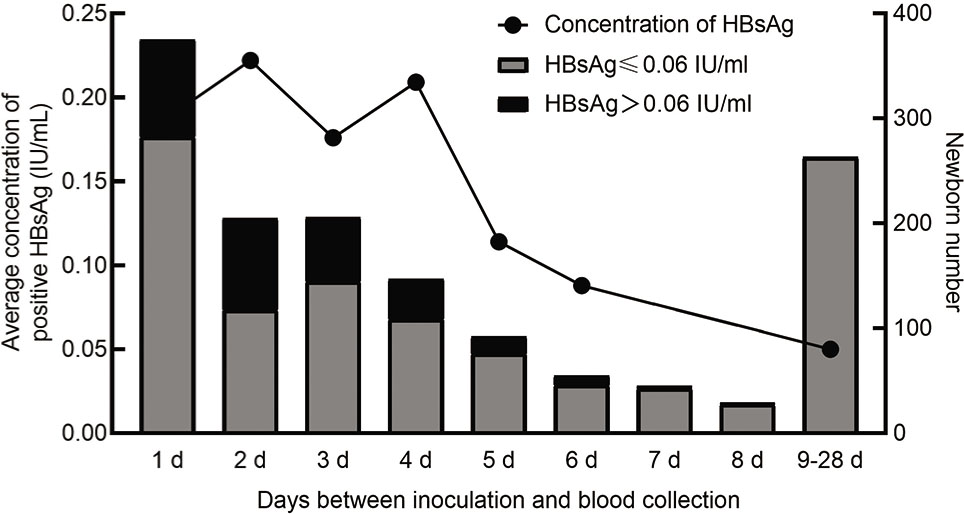
Figure 3.
The proportion of neonates positive for HBsAg and the average concentration of HBsAg in neonates (gray ≤0.06 IU/mL; black bars >0.06 IU/mL) after vaccination (solid circles). Neonates continued to appear positive for HBsAg 1–8 d after vaccination; the highest proportion was found on the second day after vaccination, and then the proportion gradually decreased with time. HBsAg, Hepatitis B surface antigen.
Table 3.
HBsAg distribution at different blood collection times after 1417 neonates were vaccinated with hepatitis B vaccine
| Interval (days) | Number of newborns | Number of newborns (%) | HBsAg (IU/mL) mean (range) | |
|---|---|---|---|---|
| HBsAg ≤0.06 IU/mL | HBsAg >0.06 IU/mL | |||
| 1 | 375 | 283 (75.47) | 92 (24.53) | 0.188 (0.106–0.312) |
| 2 | 205 | 118 (57.56) | 87 (42.44) | 0.222 (0.110–0.405) |
| 3 | 207 | 145 (70.05) | 62 (29.95) | 0.178 (0.099–0.346) |
| 4 | 147 | 109 (74.15) | 38 (25.85) | 0.209 (0.123–0.338) |
| 5 | 91 | 76 (83.52) | 15 (16.48) | 0.117 (0.095–0.188) |
| 6 | 55 | 46 (83.64) | 9 (16.36) | 0.088 (0.083–0.120) |
| 7 | 45 | 43 (95.56) | 2 (4.44) | – |
| 8 | 29 | 28 (96.55) | 1 (3.45) | – |
| 9–28 | 263 | 263 | 0 | <0.05 |
| Total | 1417 | 1111 | 306 | 0.186 (0.104–0.339) |
[i] Anti-HBs, hepatitis B surface antibodies; HBsAg, hepatitis B surface antigen.
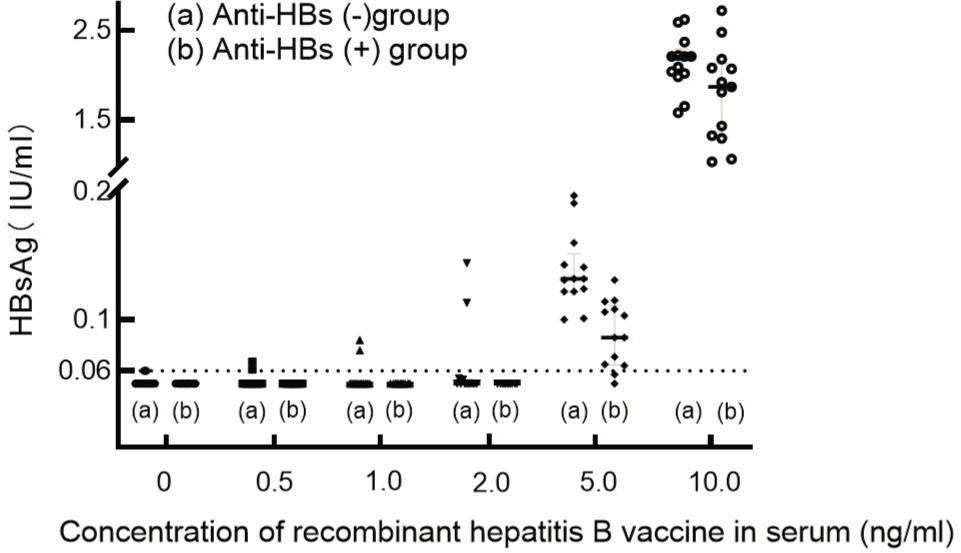
Figure 4.
(A) HBsAg status after various concentrations of recombinant hepatitis B vaccine were added to anti-HBs (−) serum. (B) HBsAg results after various concentrations of recombinant hepatitis B vaccine were added to anti-HBs (+) serum. When the recombinant hepatitis B vaccine was not added to the serum, the HBsAg levels in both groups were ≤0.06 IU/mL. When the concentration of vaccine in serum was 0.5 ng/mL, 1 ng/mL, or 2 ng/mL, only 2 instances were HBsAg positive in the anti-HBs-negative group. When the concentration of vaccine in serum was 5 ng/mL, the HBsAg status in the anti-HBs negative group was all positive, while the proportion of HBsAg positives in the anti-HBs-positive group was 84.6%, and the average concentration of HBsAg in the anti-HBs negative group was higher than that in the anti-HBs-positive group. When the concentration of vaccine in serum was 10 ng/mL, the HBsAg status in the 2 groups was positive. Similarly, the average concentration of HBsAg in the anti-HBs negative group was higher than that in the anti-HBs-positive group. Anti-HBs, hepatitis B surface antibodies; HBsAg, hepatitis B surface antigen.
Table 4.
HBsAg after the recombinant hepatitis B vaccine was added to the serum samples
| Vaccine (ng/mL) | Group | |||
|---|---|---|---|---|
| Anti-HBs (−) | Anti-HBs (+) | |||
| Positive number (proportion) | HBsAg (IU/mL) mean (range) | Positive number (proportion) | HBsAg (IU/mL) mean (range) | |
| 0.5 | 2 (15.4%) | NA | 0 (0) | NA |
| 1 | 2 (15.4%) | NA | 0 (0) | NA |
| 2 | 2 (15.4%) | NA | 0 (0) | NA |
| 5 | 13 (100%) | 0.132 (0.122–0.143)*** | 11 (84.6%) | 0.103 (0.079–0.111) |
| 10 | 13 (100%) | 2.210 (2.02–2.22)* | 13 (100%) | 1.87 (1.32–2.08) |
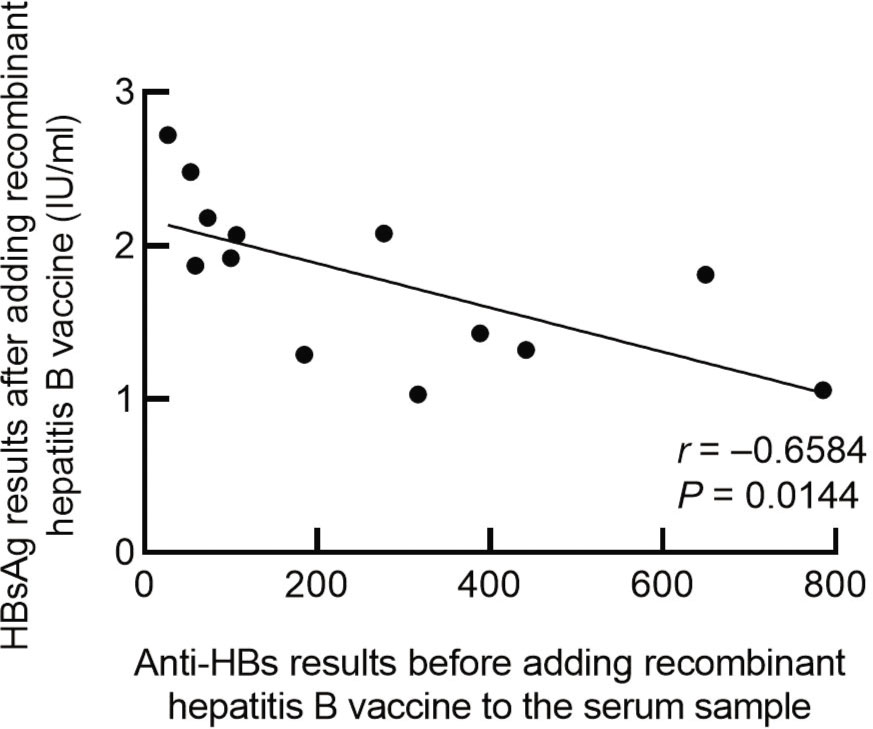
Figure 5.
In the anti-HBs (+) group, the correlation between HBsAg and anti-HBs was analyzed when the concentration of recombinant hepatitis B vaccine was 10 ng/mL. Pearson correlation analysis was performed on the anti-HBs detection results in the serum without recombinant hepatitis B vaccine and the HBsAg detection results after the addition of the hepatitis B vaccine. The Pearson correlation, r = −0.658, P < 0.014, indicates that the original anti-HBs concentration in the serum is negatively correlated with the HBsAg levels after adding the same amount of vaccine. Anti-HBs, hepatitis B surface antibodies; HBsAg, hepatitis B surface antigen.