
Table 1.
Search strategy for the databases
| Number | Keyword† |
|---|---|
| 1 | Dyslipidemia |
| 2 | Hyperlipidemia |
| 3 | Hypercholesterolemia |
| 4 | Hypertriglyceridemia |
| 5 | 1 OR 2 OR 3 OR 4 |
| 6 | Patient centered (text word) |
| 7 | Patient centered education |
| 8 | Patient education |
| 9 | Patient empowerment |
| 10 | 6 OR 7 OR 8 OR 9 OR 10 |
| 11 | 6 AND 10 |
Table 2.
Inclusion and exclusion criteria for articles
| Inclusion criteria | Exclusion criteria |
|---|---|
| ✓ English articles only | ➢ Review article (systematic review and meta-analysis) |
| ✓ RCT | ➢ Articles with study protocol only |
| ✓ Published from inception till April 2021 | ➢ Articles with poor randomization method |
| ✓ Included patient education as the intervention | ➢ Articles with unclear description of patient education |
| ✓ Intervention used PCE with the following criteria: | |
| – Applied SDM (the decision is mutually agreed by the patients and health-care professionals) | |
| – Mentioned patient-centered approaches such as MI | |
| ✓ Articles assessed by the CASP checklist for assessment of study quality |
[i] CASP, Critical Appraisal Skills Programme for RCTs [16]; MI, motivational interviewing; PCE, patient-centered education; RCT, randomized controlled trial; SDM, shared decision-making.
Table 3.
Summary of studies included
| Study’s first author, year | Study location | Design | Sample size | Patient demographic | Setting |
|---|---|---|---|---|---|
| Eaton (2011) [3] | New England | 2-arm RCT | 4,105 | Patients with regular follow-up and interested in coronary heart disease risk reduction | Primary care clinic |
| Goyer (2012) [6] | Canada | 3-arm RCT | 185 | Patients with at least 2 cardiovascular risk factors | Montreal Clinical Research Institute |
| McDermott (2012) [19] | The United States | 3-arm RCT | 355 | Peripheral arterial disease patients with LDL-C ≥ 70 mg·dL−1 | Medical institution (university) |
| Ockene (1999) [20] | The United States | 3-arm RCT | 1,162 | Patients with blood TC level in the highest 25th percentile and had a previous scheduled visit | Community health center (health maintenance organization) |
| Fortin (2016) [21] | Canada (North America) | 3-arm RCT | 664 | Patients aged 18–75 years with at least 1 chronic conditions or risk factors | Primary care practice |
| Lear (2002) [22] | Canada (North America) | 2-arm RCT | 302 | Patients with ischemic heart disease | Hospital |
| Lin (2012) [23] | The United States | 2-arm RCT | 214 | Patients with poorly controlled diabetes and coronary heart diseases | Hospital (medical center) |
| Allen (2011) [24] | The United States | 2-arm RCT | 525 | Patients with established CVD and LDL-C/BP/HbA1c exceeding target goal | Community health center |
| Babazono, (2007) [25] | Japan | 2-arm RCT | 99 | Patients with high SBP/DBP/HbA1c during annual health checkup | Health center |
| Bosworth (2018) [26] | The United States | 2-arm RCT | 428 | Patients with poorly controlled hypertension and/or hypercholesterolemia | Medical center/hospital |
| Byrne (2020) [27] | The United Kingdom | 2-arm RCT | 212 | Patients prescribed with statins and had TC ≥5 mmol·L−1 | Primary care center |
| Ho (2014) [28] | The United States | 2-arm RCT | 241 | Patients admitted with acute coronary syndrome as the primary reason | Medical center (hospital) |
| Iturralde (2019) [29] | The United States | 2-arm RCT | 647 | Patients with ≥1 uncontrolled CVD risk factors for at least 2 years before | Kaiser Permanente (non-profit integrated healthcare delivery system) |
| Jarab (2012) [30] | Jordan | 2-arm RCT | 156 | Follow-up patients with type 2 diabetes | Hospital |
| Jiang (2007) [31] | China | 2-arm RCT | 167 | Patients who were first hospitalized with either angina pectoris or myocardial infarction | Hospital |
| Maindal (2014) [32] | Denmark | 2-arm RCT | 509 | Patients aged 40–69 years at the time of screening and diagnosis of screening-detected type 2 diabetes | Primary care clinic |
| Mok (2013) [33] | Hong Kong | 2-arm RCT | 82 | Patients diagnosed with myocardial infarction | Hospital |
| Sol (2008) [34] | The Netherlands | 2-arm RCT | 154 | Referred patients with symptomatic vascular diseases | Hospital |
| Zhang (2019) [35] | China | 2-arm RCT | 62 | Patients with history of cardiometabolic syndrome | Medical university-affiliated hospital |
| Daumit (2020) [36] | The United States | 2-arm RCT | 269 | Patients with at least 1 cardiovascular risk factor | Community outpatient clinic |
[i] BP, blood pressure; CVD, cardiovascular diseases; DBP, diastolic blood pressure; HbA1c, glycated hemoglobin A; LDL-C, low density lipoprotein-cholesterol; RCT, randomized controlled trial; SBP, systolic blood pressure; TC, total cholesterol.
Table 4.
Summary of interventions
| First author, year | Interventions by | Intervention duration | Interventions | Patient-centered elements | Control | Theories/models/key mechanism |
|---|---|---|---|---|---|---|
| Eaton (2011) [3] | Physician | 12 months |
|
|
| Theory: chronic care model |
| Goyer (2012) [6] | Nutritionist Psychologist Kinesiologist Nurse Physician | 3 months |
|
|
| Theory/model: health belief model, Prochaska stages of change |
| McDermott (2012) [19] | Health counselor | 12 months |
|
|
| Key mechanism: health-care professional–patient relationship to promote patient activation (patient requested more-intensive lipid-lowering therapy from their physicians) |
| Ockene (1999) [20] | Physician | 12 months |
|
|
| Theory: social learning theory |
| Fortin (2016) [21] | Nurse CDPM professional | 3 months |
|
|
| Key mechanism: health-care professional–patient relationship to promote self-management, empowerment, and self-efficacy |
| Lear (2002) [22] | Dietitian Exercise specialist nurse | 48 months |
|
|
| Theory: transtheoretical theory, social cognitive theory |
| Lin (2012) [23] | Nurse Physician | 12 months |
|
|
| Theory: chronic care model |
| Allen (2011) [24] | Nurse Community health worker | 12 months |
|
|
| Theory: chronic care model |
| Babazono (2007) [25] | Dietitian Health exercise instructor Public health nurse | 12 months |
|
|
| Model: transtheoretical model |
| Bosworth (2018) [26] | Clinical pharmacist specialist | 12 months |
|
|
| Model: transtheoretical model |
| Byrne (2020) [27] | Facilitator (health-care professional) | 12 months |
|
|
| Theory: behavior change wheel |
| Ho (2014) [28] | Pharmacist Primary care clinician/cardiologist | 12 months |
|
|
| Model: Wagner chronic care model, medication adherence model |
| Iturralde (2019) [29] | Nurse Pharmacist | 12 months |
|
|
| Theory: chronic care model |
| Jarab (2012) [30] | Clinical pharmacist | 6 months |
|
|
| Theory/key mechanism: health-care professional–patient relationship to promote patient’s self-management behavior |
| Jiang (2007) [31] | Nurse | 3 months |
|
|
| Key mechanism: health-care professional–patient relationship in providing education to promote change in health behavior and physiological risk parameter |
| Maindal (2014) [32] | Nurse Dietitian Physiotherapist General physician | 3 months |
|
|
| Theory: motivation theory |
| Mok (2013) [33] | Nurse | 2 months |
|
|
| Key mechanism: health-care professional–patient relationship to promote dietary change |
| Sol (2008) [34] | Nurse | 12 months |
|
|
| Key mechanism: health-care professional–patient relationship to promote self-efficacy and improvement in vascular risk factors |
| Zhang (2019) [35] | Psychologist Internal medicine specialist | 3 months |
|
|
| Key mechanism: Skinner behavior intensified techniques |
| Daumit (2020) [36] | Nurse Physician Health coach | 18 months |
|
|
| Theory/model: behavioral self-management concepts, social cognitive theory, solution-focused therapy |
[i] BP, blood pressure; CDPM, chronic disease prevention and management; CRP, cardiac rehabilitation program; CVD, cardiovascular diseases; MI, motivational interviewing; PDA, personal digital assistant; SDM, shared-decision making.
Table 5.
Summary of impact of interventions
| First author | Psychosocial/cognitive | Behavioral (smoking/physical activity/diet or medication adherence) | Cholesterol level | Other cardiometabolic outcomes (BP/weight/BMI/HbA1c) | Other outcomes | Difference in LDL level (reduction) in intervention and control groups |
|---|---|---|---|---|---|---|
| Eaton [3] | – | – | 0 LDL (95% CI, OR = 1.27) 0 non-HDL (95% CI, OR = 1.23) | – | – | – |
| Goyer [6] | + Mental health status (P< 0.001) | + Kilocalories intake (P= 0.022) + Physical activity (P< 0.001) 0 Smoking status | + TC (P< 0.001) + TG (P= 0.047) 0 HDL + LDL (P= 0.046) | + SBP (P< 0.001) + Weight (P< 0.001) + BMI (P< 0.001) + HbA1c 0 Waist circumference | + Reduction in CVD risk score (Framingham Risk Score) (P< 0.005) | Difference in intervention group: 9.0 mg·dL−1 Difference in control group: 5.4 mg·dL−1 |
| McDermott [19] | + Patient activation (95% CI, P= 0.016) + Self-efficacy (95% CI, P< 0.001) | – | + LDL (95% CI, P= 0.035) | – | + Pharmacotherapy initiation and adjustments (95% CI, P< 0.001) | Difference in intervention group: 18.4 mg·dL−1 Difference in control group (usual care): 11.1 mg·dL−1 |
| Ockene [20] | – | + Reduction in consumption of saturated fats (P= 0.01) | 0 TC (P= 0.07) 0 LDL (P= 0.10) 0 HDL (P= 0.09) 0 TG (P= 0.03) | + Weight (P< 0.001) + BMI (P< 0.001) | – | Difference in intervention group: 1.98 mg·dL−1 Difference in control group (usual care): 0.18 mg·dL−1 |
| Fortin [21] | – | + Self-monitoring (95% CI, P= 0.001, RR = 2.40) + Emotional well-being (95% CI, P= 0.012, RR = 1.73) + Skill and technique acquisition (95% CI, P= 0.001, RR = 1.70) 0 Physical activity (95% CI, P= 0.276, OR = 3.81) 0 Fruit and vegetable consumption (95% CI, P= 0.198, OR = 2.36) | – | + BMI (95% CI, P< 0.001) | – | – |
| Lear [22] | 0 Self-efficacy 0 Perceived stress | 0 Smoking status 0 Physical activity | 0 TC 0 LDL 0 HDL 0 TG | + BMI (P< 0.05) + Waist circumference (P< 0.05) 0 BP | + Higher PTCA procedures (P< 0.05) + Less CABG procedures (P< 0.05) | – |
| Lin [23] | – | + Glucose monitoring (P= 0.06, RR = 1.28) + BP monitoring (P< 0.001, RR = 3.20) 0 Medication adherence | – | – | + Pharmacotherapy initiation and adjustment rates for antidepressants (P< 0.001, RR = 6.20) + Pharmacotherapy initiation and adjustment rates for insulin (P< 0.001, RR = 2.97) + Pharmacotherapy initiation and adjustment rates for antihypertensive medications (P< 0.001, RR = 1.86) | – |
| Allen [24] | + Perceptions of the quality of chronic illness care (95% CI, P< 0.001) | – | + TC (95% CI, P< 0.001) + LDL (95% CI, P< 0.001) + TG (95% CI, P= 0.013) 0 HDL (95% CI, P= 0.497) | + SBP (95% CI, P= 0.003) + DBP (95% CI, P= 0.013) + HbA1c (95% CI, P= 0.034) | – | Difference in intervention group: 21.6 mg·dL−1 Difference in control group (usual care): 5.7 mg·dL−1 |
| Babazono [25] | – | + Number of steps per day (P< 0.001) + Vegetable intake (95% CI, P< 0.05, OR = 3.80) 0 Total calorie intake | 0 TC 0 LDL 0 TG 0 HDL | 0 BMI 0 BP 0 HbA1c | – | Difference in intervention group: 1.4 mg·dL−1 Difference in control group (usual care): increment of 0.1 mg·dL−1 |
| Bosworth [26] | – | – | + TC (95% CI, P= 0.03) 0 LDL 0 HDL (95% CI, P= 0.08) | 0 SBP (P= 0.34) 0 DBP 0 HbA1c (95% CI) (P= 0.72) | – | Difference in intervention group: 9.7 mg·dL−1 Difference in control group (usual care): 8.9 mg·dL−1 |
| Byrne [27] | + Perceived control and understanding of the condition (95% CI, P< 0.027) | 0 Medication adherence to statin (95% CI, P= 0.968, OR = 1.02) + Walking activity (95% CI, P< 0.001) | 0 TC (95% CI, P= 0.120) 0 HDL (95% CI, P= 0.814) | 0 SBP (95% CI, P= 0.096) + DBP (95% CI, P= 0.002) + Waist circumference (95% CI, P= 0.012) 0 BMI (95% CI, P= 0.088) | 0 CVD risk score (95% CI, P= 0.165) | TC: difference in intervention group: 12.42 mg·dL−1 Difference in control group (usual care): 6.12 mg·dL−1 |
| Ho [28] | – | + Medication adherence (95% CI, P= 0.03) | 0 LDL (P= 0.90) | 0 SBP (P= 0.50) 0 DBP (P= 0.50) | – | Difference in intervention group: 13 mg·dL−1 Difference in control group (usual care): 12 mg·dL−1 |
| Iturralde [29] | + Patient activation (P= 0.01) + Patient-centered care (P= 0.003) | 0 Statin adherence (P= 0.93) | 0 LDL (P= 0.97) | 0 SBP (P= 0.80) 0 HbA1c (P= 0.28) | 0 1 year CVD risk factor + Engagement with the healthcare system using online tools (P= 0.01) | – |
| Jarab [30] | – | + Medication adherence (self-report) (P= 0.003) + Self-care activities (P= 0.007) | + LDL (P= 0.031, 95% CI) + TG (P= 0.017, 95% CI) 0 HDL (P= 0.728, 95% CI) | + SBP (P= 0.035, 95% CI) + DBP (P= 0.026, 95% CI) + HbA1c (P= 0.019, 95% CI) 0 BMI (P= 0.189, 95% CI) | – | Difference in intervention group: 10.8 mg·dL−1 Difference in control group (usual care): 7.2 mg·dL−1 |
| Jiang [31] | – | + Medication adherence (at 3 months) (P= 0.029) 0 Medication adherence (at 6 months) (P= 0.143) + Walking activity (at 6 months) (P= 0.002) + Step 2 diet adherence (at 6 months) (P= 0.002) 0 Smoking status | + TC (at 6 months) (P= 0.001) + TG (at 6 months) (P= 0.011) + LDL (at 6 months) (P= 0.001) 0 HDL (at 6 months) (P= 0.293) | + SBP (at 3 months) (P= 0.021) 0 SBP (at 6 months) (P= 0.216) + DBP (at 3 months) (P= 0.030) 0 DBP (at 6 months) (P= 0.148) 0 Body weight (at 3 months) (P= 0.157) 0 Body weight (at 6 months) (P= 0.099) | – | Difference in intervention group: 8.1 mg·dL−1 Difference in control group (usual care): 2.7 mg·dL−1 |
| Maindal [32] | + Patient activation (P= 0.002, 95% CI) | 0 Physical activity (P= 0.600, 95% CI) 0 Smoking status (P= 0.056, 95% CI) | + TC (P= 0.027, 95% CI) | 0 SBP (P= 0.372, 95% CI) 0 DBP (P= 0.140, 95% CI) 0 HbA1c (P= 0.371, 95% CI) 0 BMI (P= 0.831, 95% CI) | 0- to 10-year CVD risk score (P= 0.878, 95% CI) | TC: difference between intervention and control groups: 4.32 mg·dL−1 |
| Mok [33] | – | + Reduction in consumption of saturated fats and salted food (P< 0.001) + Increased intake of heart-healthy foods (P< 0.001) | 0 TC 0 TG + HDL (P= 0.001) | – | – | Difference in intervention group: no difference Difference in control group (usual care): increase 4.63 mg·dL−1 |
| Sol [34] | 0 Total self-efficacy + Self-efficacy in choosing healthy food (P= 0.01) + Self-efficacy in doing extra exercises (P= 0.03) | – | 0 LDL (95% CI, OR = 0.95) | 0 SBP (95% CI, OR = 1.07) 0 BMI (95% CI, OR = 0.93) | – | – |
| Zhang [35] | + Quality of life (P< 0.001) | 0 Physical activity 0 Smoking status | +TG (P< 0.001) | + SBP (P< 0.001) + Waist circumference (P< 0.001) | – | TG: difference in intervention group: 14.4 mg·dL−1 Difference in control group (usual care): increase of 3.6 mg·dL−1 |
| Daumit [36] | – | + Smoking status (P= 0.004, 95% CI) | 0 TC 0 HDL 0 LDL | 0 SBP | + Reduction in 10-year Framingham risk score (P= 0.02, 95% CI) | Difference in intervention group: 8.2 mg·dL−1 Difference in control group (usual care): 3.7 mg·dL−1 |
[i] + = Significant improvement (P< 0.05) compared with the control group.
[ii] 0 = No significant effect of the intervention (P≥ 0.05) compared with the control group.
[iii] − = No result reported.
[iv] 95% CI, 95% confidence interval reported in the article; BMI, body mass index; BP, blood pressure; CABG, coronary artery bypass graft; CI, confidence interval; CVD, cardiovascular disease; DBP, diastolic blood pressure; HbA1c, glycated hemoglobin A; HDL, high-density lipoprotein; LDL, low-density lipoprotein; OR, odds ratio; PTCA, percutaneous transluminal coronary angioplasty; RR, relative risk; SBP, systolic blood pressure; TC, total cholesterol; TG, triglyceride.
Table 6.
Criteria assessments for studies included
| Study’s first author | Does the study describe PCE? | 1. Clearly focused research question | 2. Was the assignment of participants randomized? | 3. Were all participants accounted for at its conclusion? | 4. Were the participants/investigators blinded to intervention? | 5. Were the study groups similar at the start of RCT? -was a baseline set?-were any differences found between study groups that may affect outcome | 6. Apart from the intervention, did each study group receive same level of care? | 7. Were the effects of intervention reported comprehensively? - were power calculation, etc., reported | 8. Was the precision of the estimate of the intervention or treatment effect reported? Were CIs reported? | 9. Do the benefits of the intervention outweigh the harms and costs? | 10. Can the results be applied to any local population? | 11. Would the intervention provide greater value than any of the existing interventions? |
|---|---|---|---|---|---|---|---|---|---|---|---|---|
| Eaton [3] | 1 | 1 | 1 | 1 | 0 | 1 | 1 | 1 | 1 | 1 | 1 | 1 |
| Goyer [6] | 1 | 1 | 1 | 1 | 1 | 1 | 1 | 1 | 1 | 1 | 1 | 1 |
| McDermott [19] | 1 | 1 | 1 | 1 | 0 | 1 | 1 | 1 | 1 | 1 | 1 | 1 |
| Ockene [20] | 1 | 1 | 1 | 1 | 0 | 1 | 1 | 1 | 1 | 1 | 1 | 1 |
| Fortin [21] | 1 | 1 | 1 | 1 | 1 | 1 | 1 | 1 | 1 | 1 | 1 | 1 |
| Lear [22] | 1 | 1 | 1 | 1 | 1 | 1 | 1 | 1 | 1 | 1 | 1 | 1 |
| Lin [23] | 1 | 1 | 1 | 1 | 0 | 1 | 1 | 1 | 1 | 1 | 1 | 1 |
| Allen [24] | 1 | 1 | 1 | 1 | 0 | 1 | 1 | 1 | 1 | 1 | 1 | 1 |
| Babazono [25] | 1 | 1 | 1 | 1 | 0 | 1 | 1 | 1 | 1 | 1 | 1 | 1 |
| Bosworth [26] | 1 | 1 | 1 | 1 | 0 | 1 | 1 | 1 | 1 | 1 | 1 | 1 |
| Byrne [27] | 1 | 1 | 1 | 1 | 1 | 1 | 1 | 1 | 1 | 1 | 1 | 1 |
| Ho [28] | 1 | 1 | 1 | 1 | 1 | 1 | 1 | 1 | 1 | 1 | 1 | 1 |
| Iturralde [29] | 1 | 1 | 1 | 1 | 1 | 1 | 1 | 1 | 1 | 1 | 1 | 1 |
| Jarab [30] | 1 | 1 | 1 | 1 | 1 | 1 | 1 | 1 | 1 | 1 | 1 | 1 |
| Jiang [31] | 1 | 1 | 1 | 1 | 1 | 1 | 1 | 1 | 1 | 1 | 1 | 1 |
| Maindal [32] | 1 | 1 | 1 | 1 | 1 | 1 | 1 | 1 | 1 | 1 | 1 | 1 |
| Mok [33] | 1 | 1 | 1 | 1 | 1 | 1 | 1 | 1 | 1 | 1 | 1 | 1 |
| Sol [34] | 1 | 1 | 1 | 1 | 1 | 1 | 1 | 1 | 1 | 1 | 1 | 1 |
| Zhang [35] | 1 | 1 | 1 | 1 | 1 | 1 | 1 | 1 | 1 | 1 | 1 | 1 |
| Daumit [36] | 1 | 1 | 1 | 1 | 1 | 1 | 1 | 1 | 1 | 1 | 1 | 1 |
[i] CI, confidence interval; PCE, patient-centered education; RCT, randomized controlled trial.
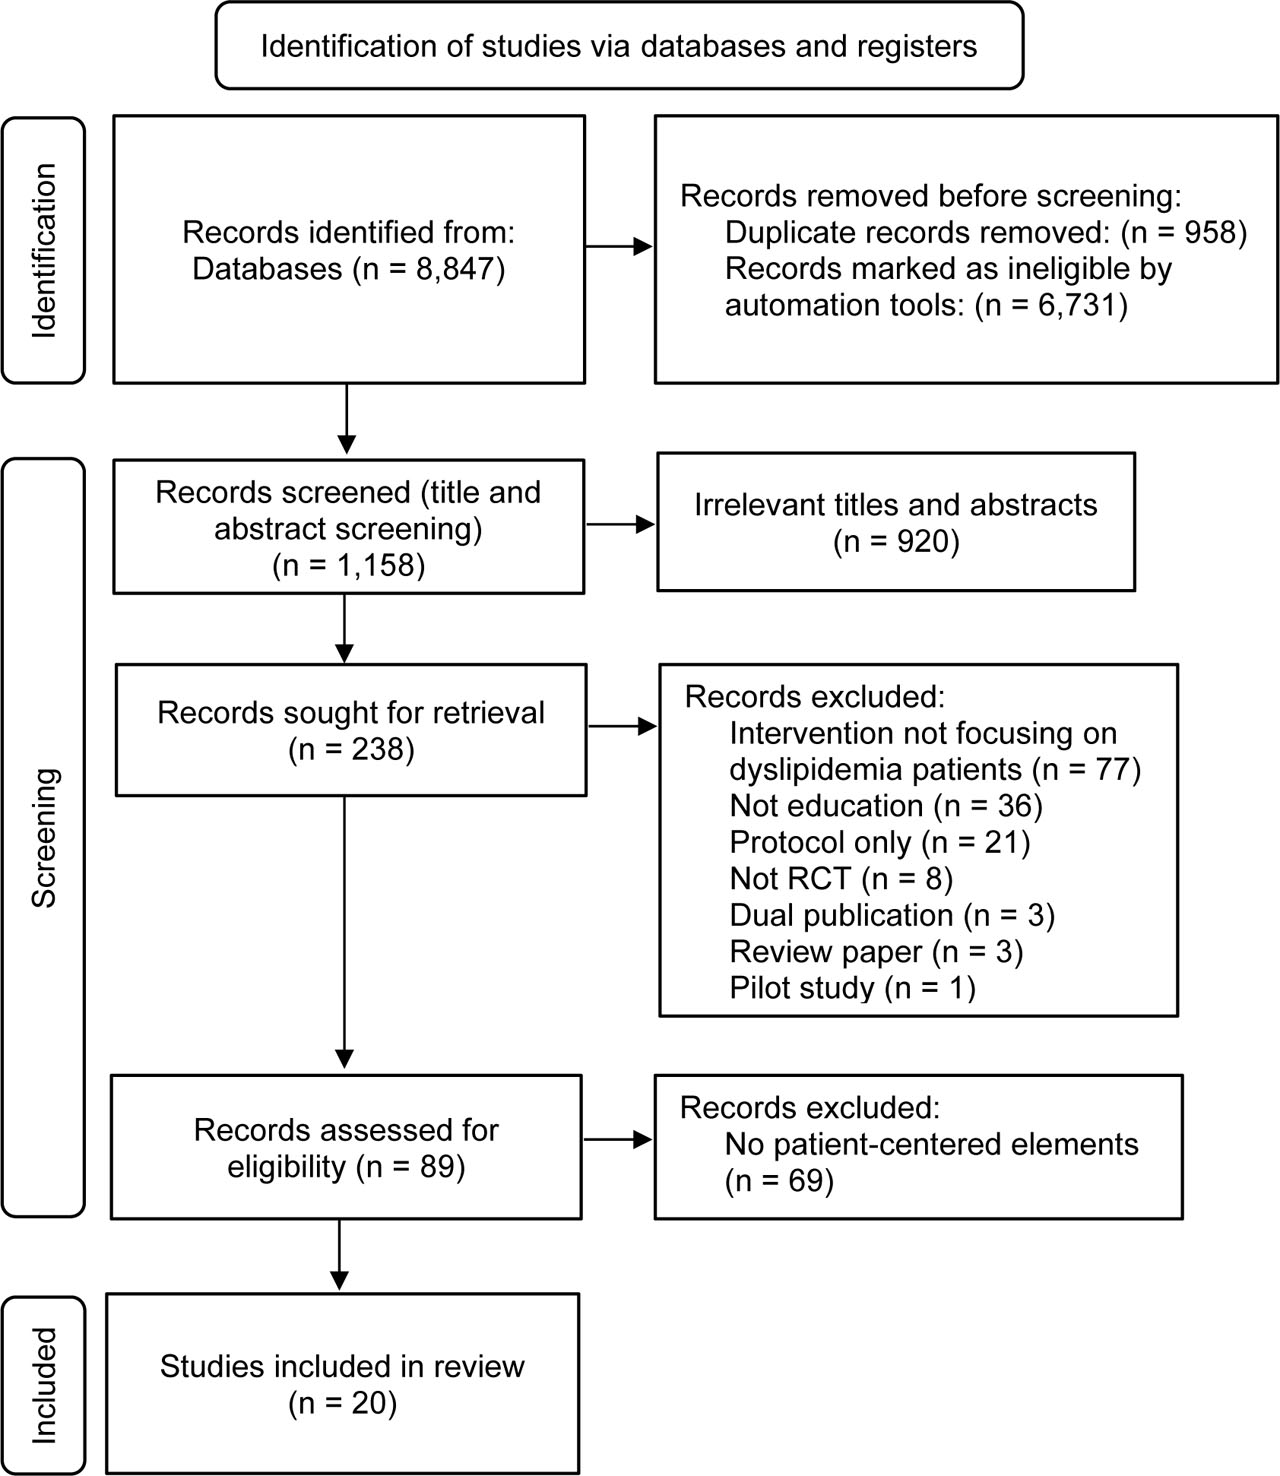
Figure 1.
Flow diagram of the study selection process according to PRISMA flowchart. PRISMA, Preferred Reporting Items for Systematic Review and Meta-Analyses; RCT, randomized controlled trial.