
Figure 1
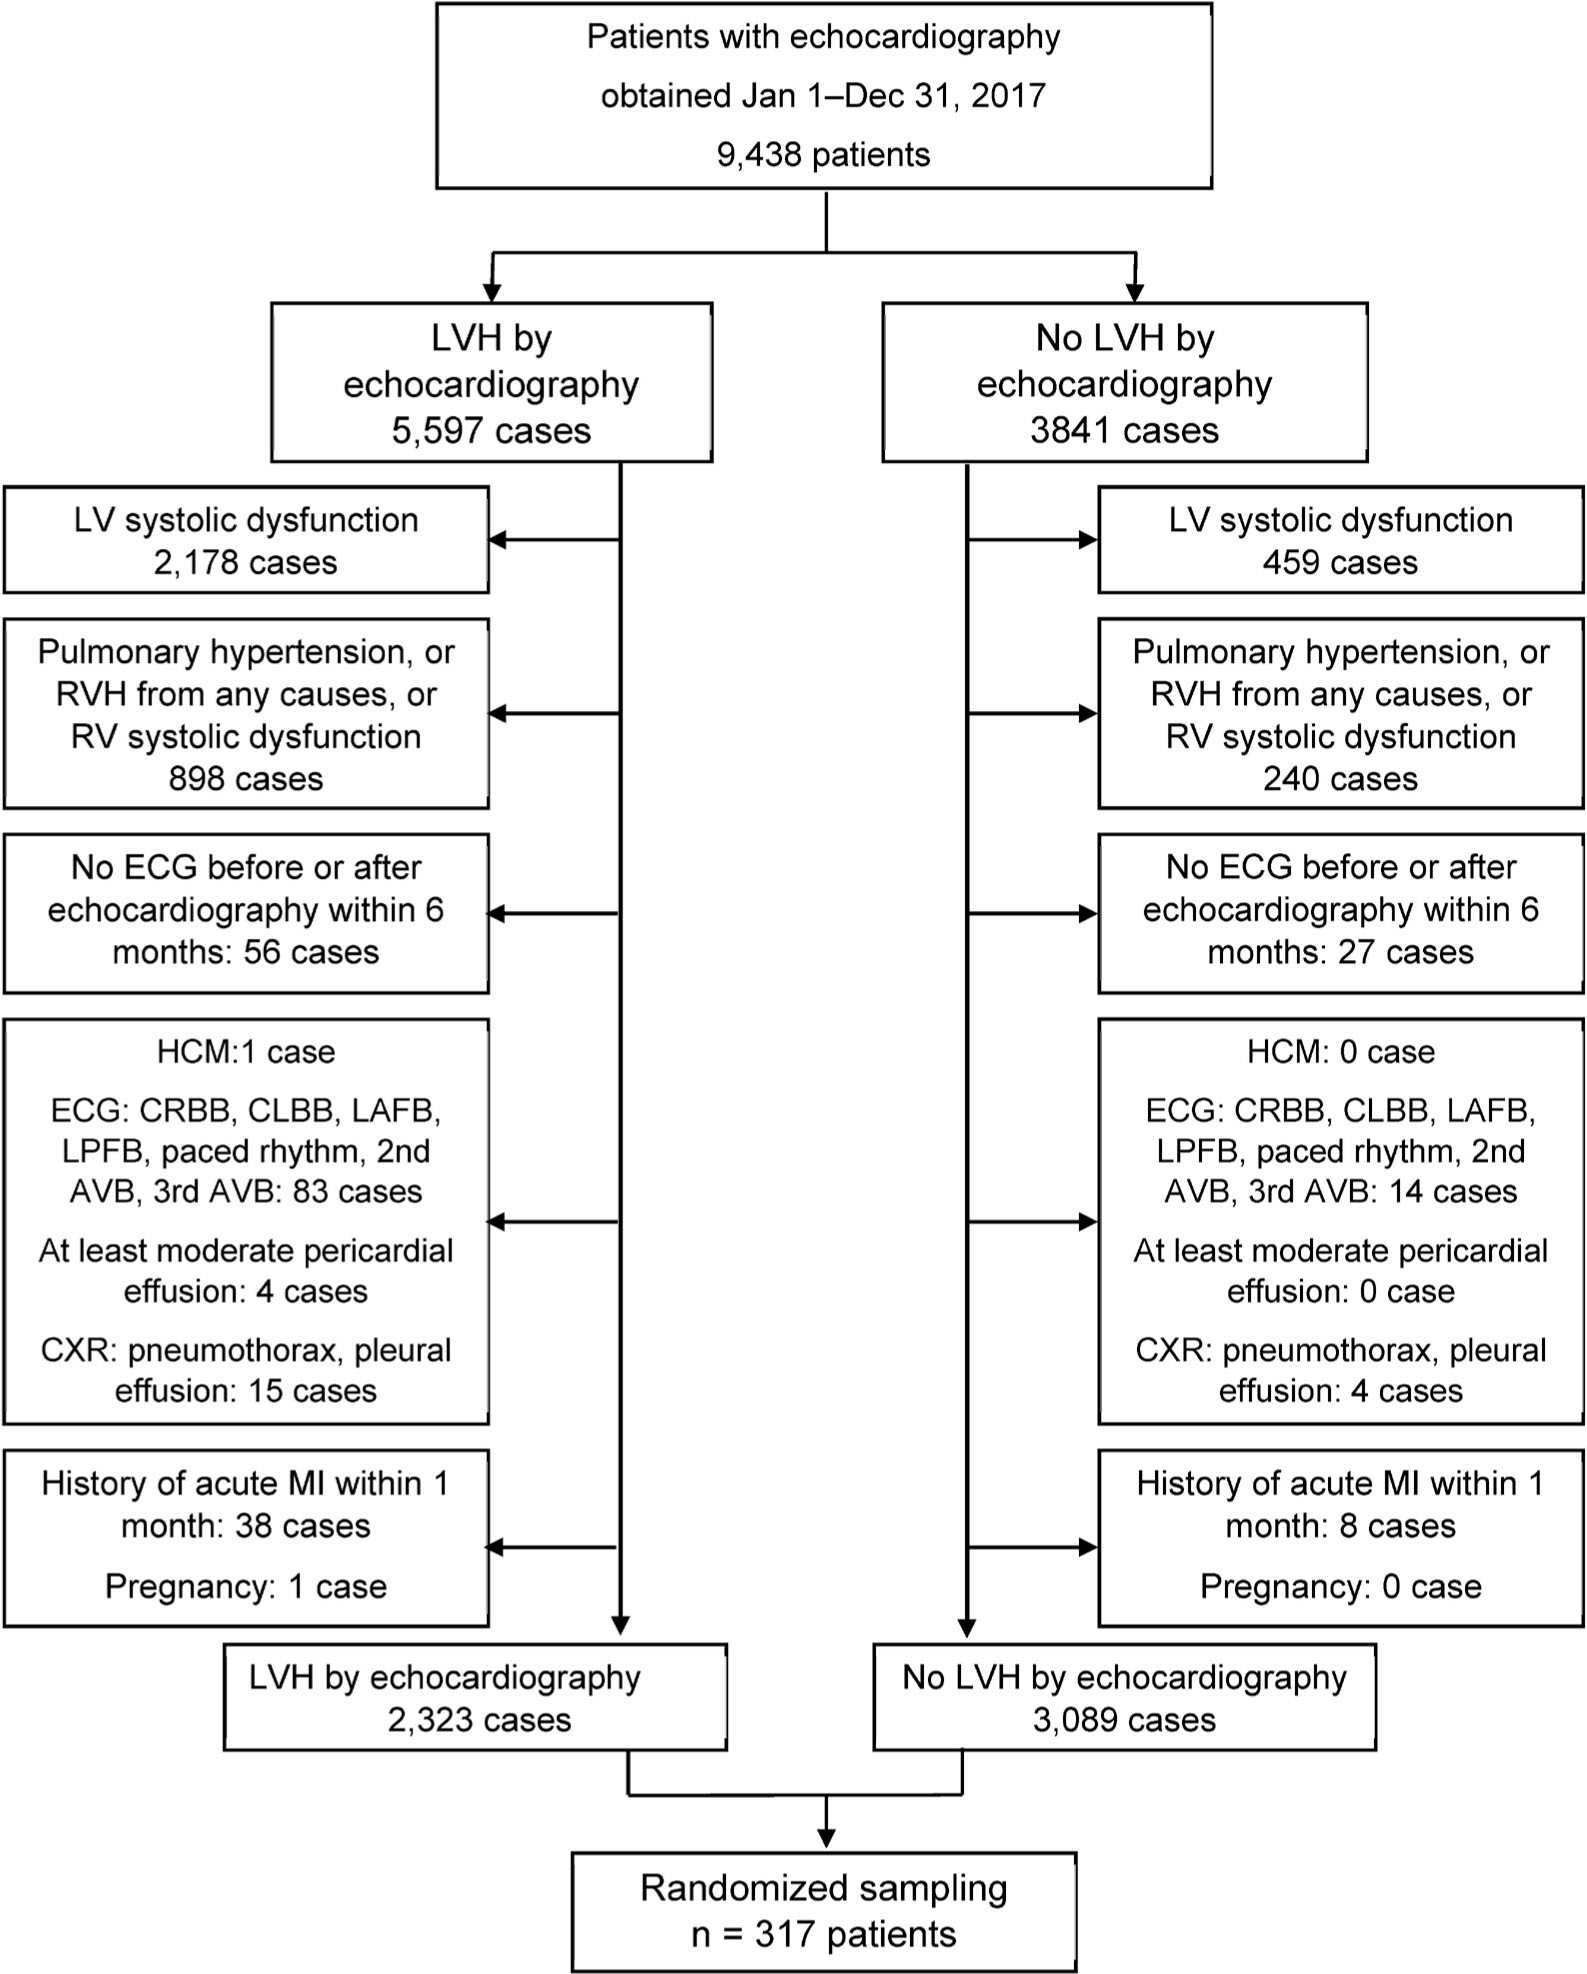
Flow chart for sampling of patients whose data were included in the study. Randomized sampling was web-based (https://www.sealedenvelope.com/simple-randomiser/v1/lists). AVB, atrioventricular block; CXR, chest X-ray imaging; CRBB, complete right bundle branch block; CLBB, complete left bundle branch block; ECG, electrocardiography; HCM, hypertrophic cardiomyopathy; LV, left ventricular; LVH, left ventricular hypertropy; LAFB, left anterior fascicular block; LPFB, left posterior fascicular block; MI, myocardial infarction; RV, right ventricular; RVH, right ventricular hypertrophy.
Table 1
Baseline characteristics of the patients with available echocardiography and with and without LVH
| Demographic | Total n = 317 n (%) or mean ± SD | LVH n = 164 n (%) or mean ± SD | No LVH n = 153 n (%) or mean ± SD | P |
|---|---|---|---|---|
| Age (years) | 57.2 ± 16.5 | 63.5 ± 13.2 | 50.4 ± 17.1 | <0.01 |
| Male sex | 134 (42.3%) | 59 (36%) | 75 (49%) | 0.02 |
| Body weight (kg) | 64.6 ± 15.2 | 64.6 ± 15.9 | 64.5 ± 14.5 | 0.98 |
| Body surface area (m2) | 1.7 ± 0.2 | 1.7 ± 0.2 | 1.7 ± 0.2 | 0.37 |
| Medical history | ||||
| Hypertension | 151 (48) | 97 (59) | 54 (35) | <0.01 |
| Diabetes mellitus | 53 (17) | 36 (22) | 17 (11) | 0.01 |
| Dyslipidemia | 158 (50) | 101 (62) | 57 (37) | <0.01 |
| COPD | 16 (5) | 11 (7) | 5 (3) | 0.16 |
| Heart failure | 58 (18) | 42 (26) | 16 (11) | <0.01 |
| Atrial fibrillation | 57 (18) | 29 (18) | 28 (18) | 0.89 |
| Peripheral arterial disease | 3 (1) | 1 (1) | 2 (1) | 0.52 |
| History of myocardial infarction | 20 (6) | 12 (7) | 8 (5) | 0.45 |
| Valvular heart disease | 76 (24) | 46 (28) | 30 (20) | 0.08 |
| • Aortic stenosis | 8 (3) | 7 (4) | 1 (1) | 0.04 |
| • Aortic regurgitation | 13 (4) | 12 (7) | 1 (1) | <0.01 |
| • Mitral regurgitation | 15 (5) | 13 (8) | 2 (1) | 0.01 |
| History of stroke or TIA | 12 (4) | 8 (5) | 4 (3) | 0.29 |
| Chronic kidney disease | 10 (3) | 7 (4) | 3 (2) | 0.24 |
| Prior PCI | 22 (7) | 15 (9) | 7 (5) | 0.11 |
| Prior CABG | 8 (3) | 5 (3) | 3 (2) | 0.54 |
| Echocardiographic parameters | ||||
| LVEF (%) | 66.5 ± 7.3 | 66.1 ± 7.5 | 67.1 ± 7.1 | 0.18 |
| LV mass index (g/m2) | 113.0 ± 41.1 | 141.6 ± 35.9 | 82.3 ± 17.3 | <0.01 |
| Relative wall thickness | 0.6 ± 2.3 | 0.8 ± 3.2 | 0.5 ± 0.1 | 0.24 |
| Medications | ||||
| • Beta-blockers | 95 (30) | 56 (34) | 39 (26) | 0.09 |
| • ACEIs/ARBs | 48 (15) | 32 (20) | 16 (11) | 0.03 |
| • Calcium channel blockers | 71 (22) | 48 (29) | 23 (15) | <0.01 |
| • Diuretics | 44 (14) | 33 (20) | 11 (7) | <0.01 |
| SBP (mmHg) | 130.1 ± 20.1 | 135.2 ± 20.8 | 124.6 ± 17.7 | <0.01 |
| DBP (mmHg) | 77.1 ± 13.3 | 78.1 ± 13.46 | 76.1 ± 13.0 | 0.20 |
| Creatinine (mg/dL) | 1.0 ± 0.7 | 1.1 ± 1.0 | 0.9 ± 0.3 | 0.23 |
| eGFR (mL/min/m2) | 83.4 ± 24.4 | 74.5 ± 24.2 | 91.4 ± 21.9 | <0.01 |
[i] ACEIs, angiotensin converting enzyme inhibitors; ARBs, angiotensin receptor blockers; CABG, coronary artery bypass grafting; COPD, chronic obstructive pulmonary disease; DBP, diastolic blood pressure; eGFR, estimated glomerular filtration rate; LVEF, left ventricular ejection fraction; LVH, left ventricular hypertrophy; PCI, percutaneous coronary intervention; SBP, systolic blood pressure; SD, standard deviation; TIA, transient ischemic attack.
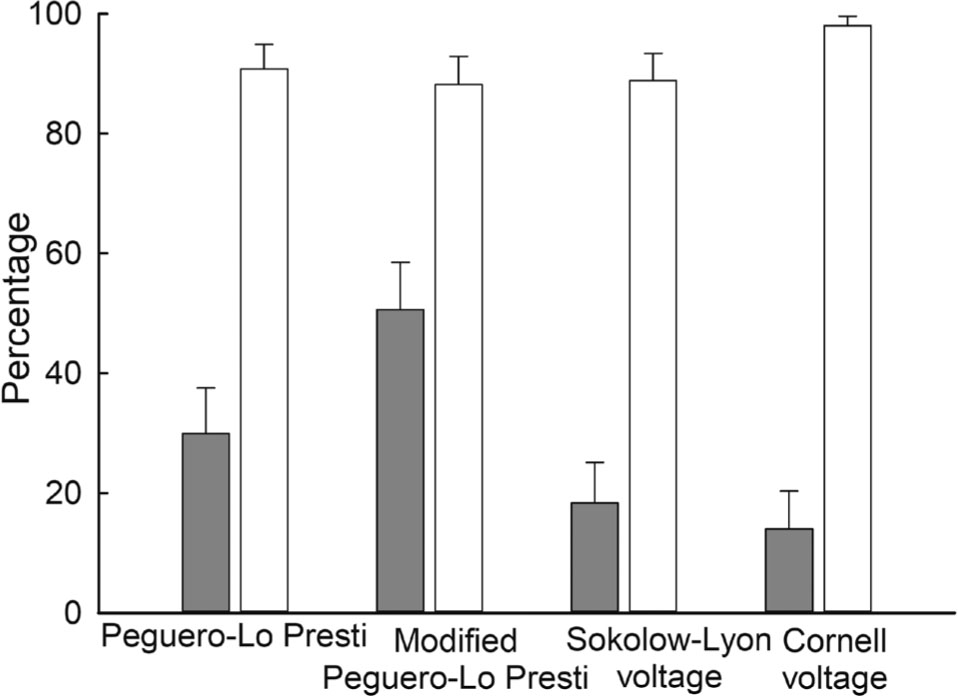
Figure 2
Sensitivity and specificity of the ECG criteria against the echocardiographic LVH. Dark gray bars indicate sensitivity and open bars indicate specificity. Error bars indicate 95% confidence intervals. ECG, electrocardiographic; LVH, left ventricular hypertrophy.
Table 2
McNemar test and AUC for the electrocardiographic criteria against the echocardiographic LVH
| Test | Sensitivity (%) | Specificity (%) | PPV (%) | NPV (%) | AUC | P AUC | *P McNemar |
|---|---|---|---|---|---|---|---|
| Peguero–Lo Presti LVH | 29.9 (23.0–37.5) | 90.9 (85.1–94.9) | 77.8 (65.5–87.3) | 54.7 (48.4–61.0) | 0.67 (0.61–0.73) | <0.01 | <0.01 |
| Modified Peguero–Lo Presti LVH | 50.6 (42.7–58.5) | 88.2 (82.0–92.9) | 82.2 (73.3–89.1) | 62.5 (55.7–69.0) | 0.67 (0.61–0.73) | <0.01 | <0.01 |
| Sokolow–Lyon LVH | 18.3 (12.7–25.1) | 88.9 (82.8–93.4) | 63.8 (48.5–77.3) | 50.4 (44.2–56.5) | 0.59 (0.53–0.66) | 0.06 | <0.01 |
| Cornell LVH | 14.0 (9.1–20.3) | 98.0 (94.4–99.6) | 88.5 (69.8–97.6) | 51.5 (45.6–57.4) | 0.71 (0.65–0.76) | 0.08 | <0.01 |
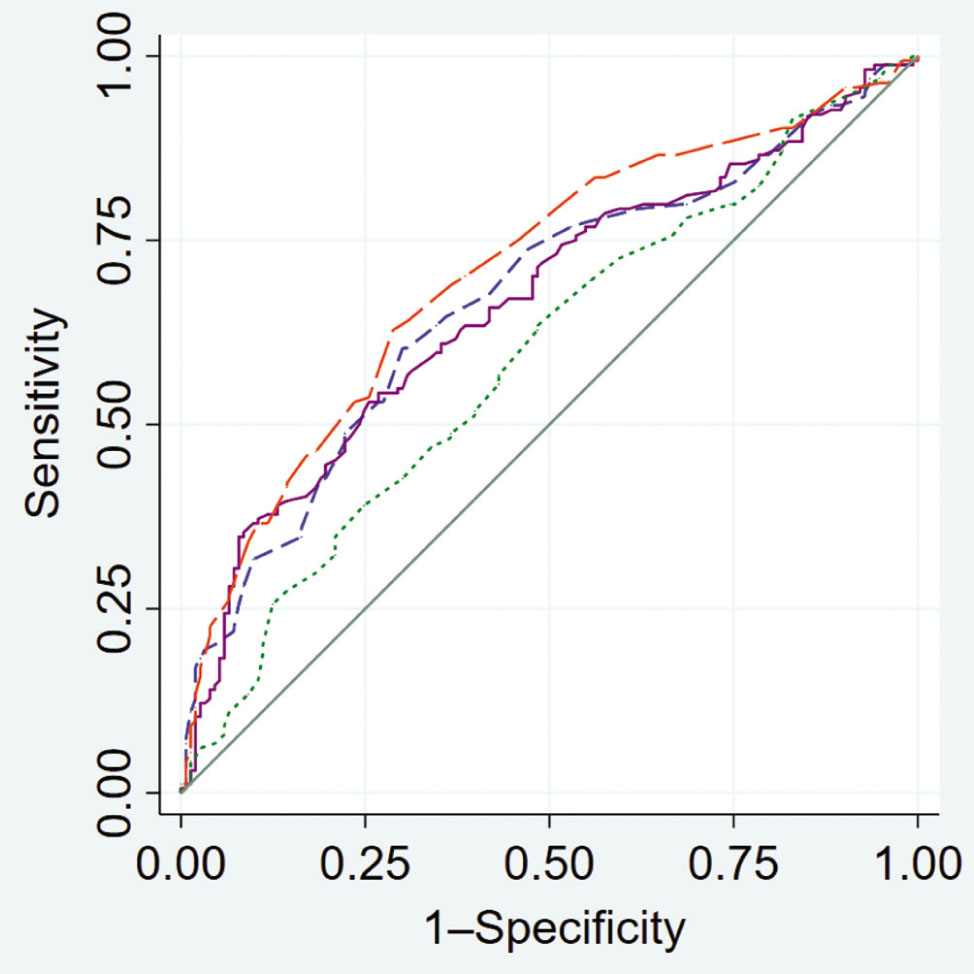
Figure 3
AUC of the ECG criteria against the echocardiographic LVH. Dashed blue line indicates Peguero–Lo Presti criteria (AUC 0.67), solid purple line indicates Peguero–Lo Presti criteria modified by BSA (AUC 0.67), short-dashed green line indicates Sokolow–Lyon voltage criteria (AUC 0.59), and long-dashed orange line indicates Cornell voltage criteria (AUC 0.71). The teal line is for reference. AUC, area under a receiver-operating characteristic curve; BSA, body surface area; ECG, electrocardiographic; LVH, left ventricular hypertrophy.