
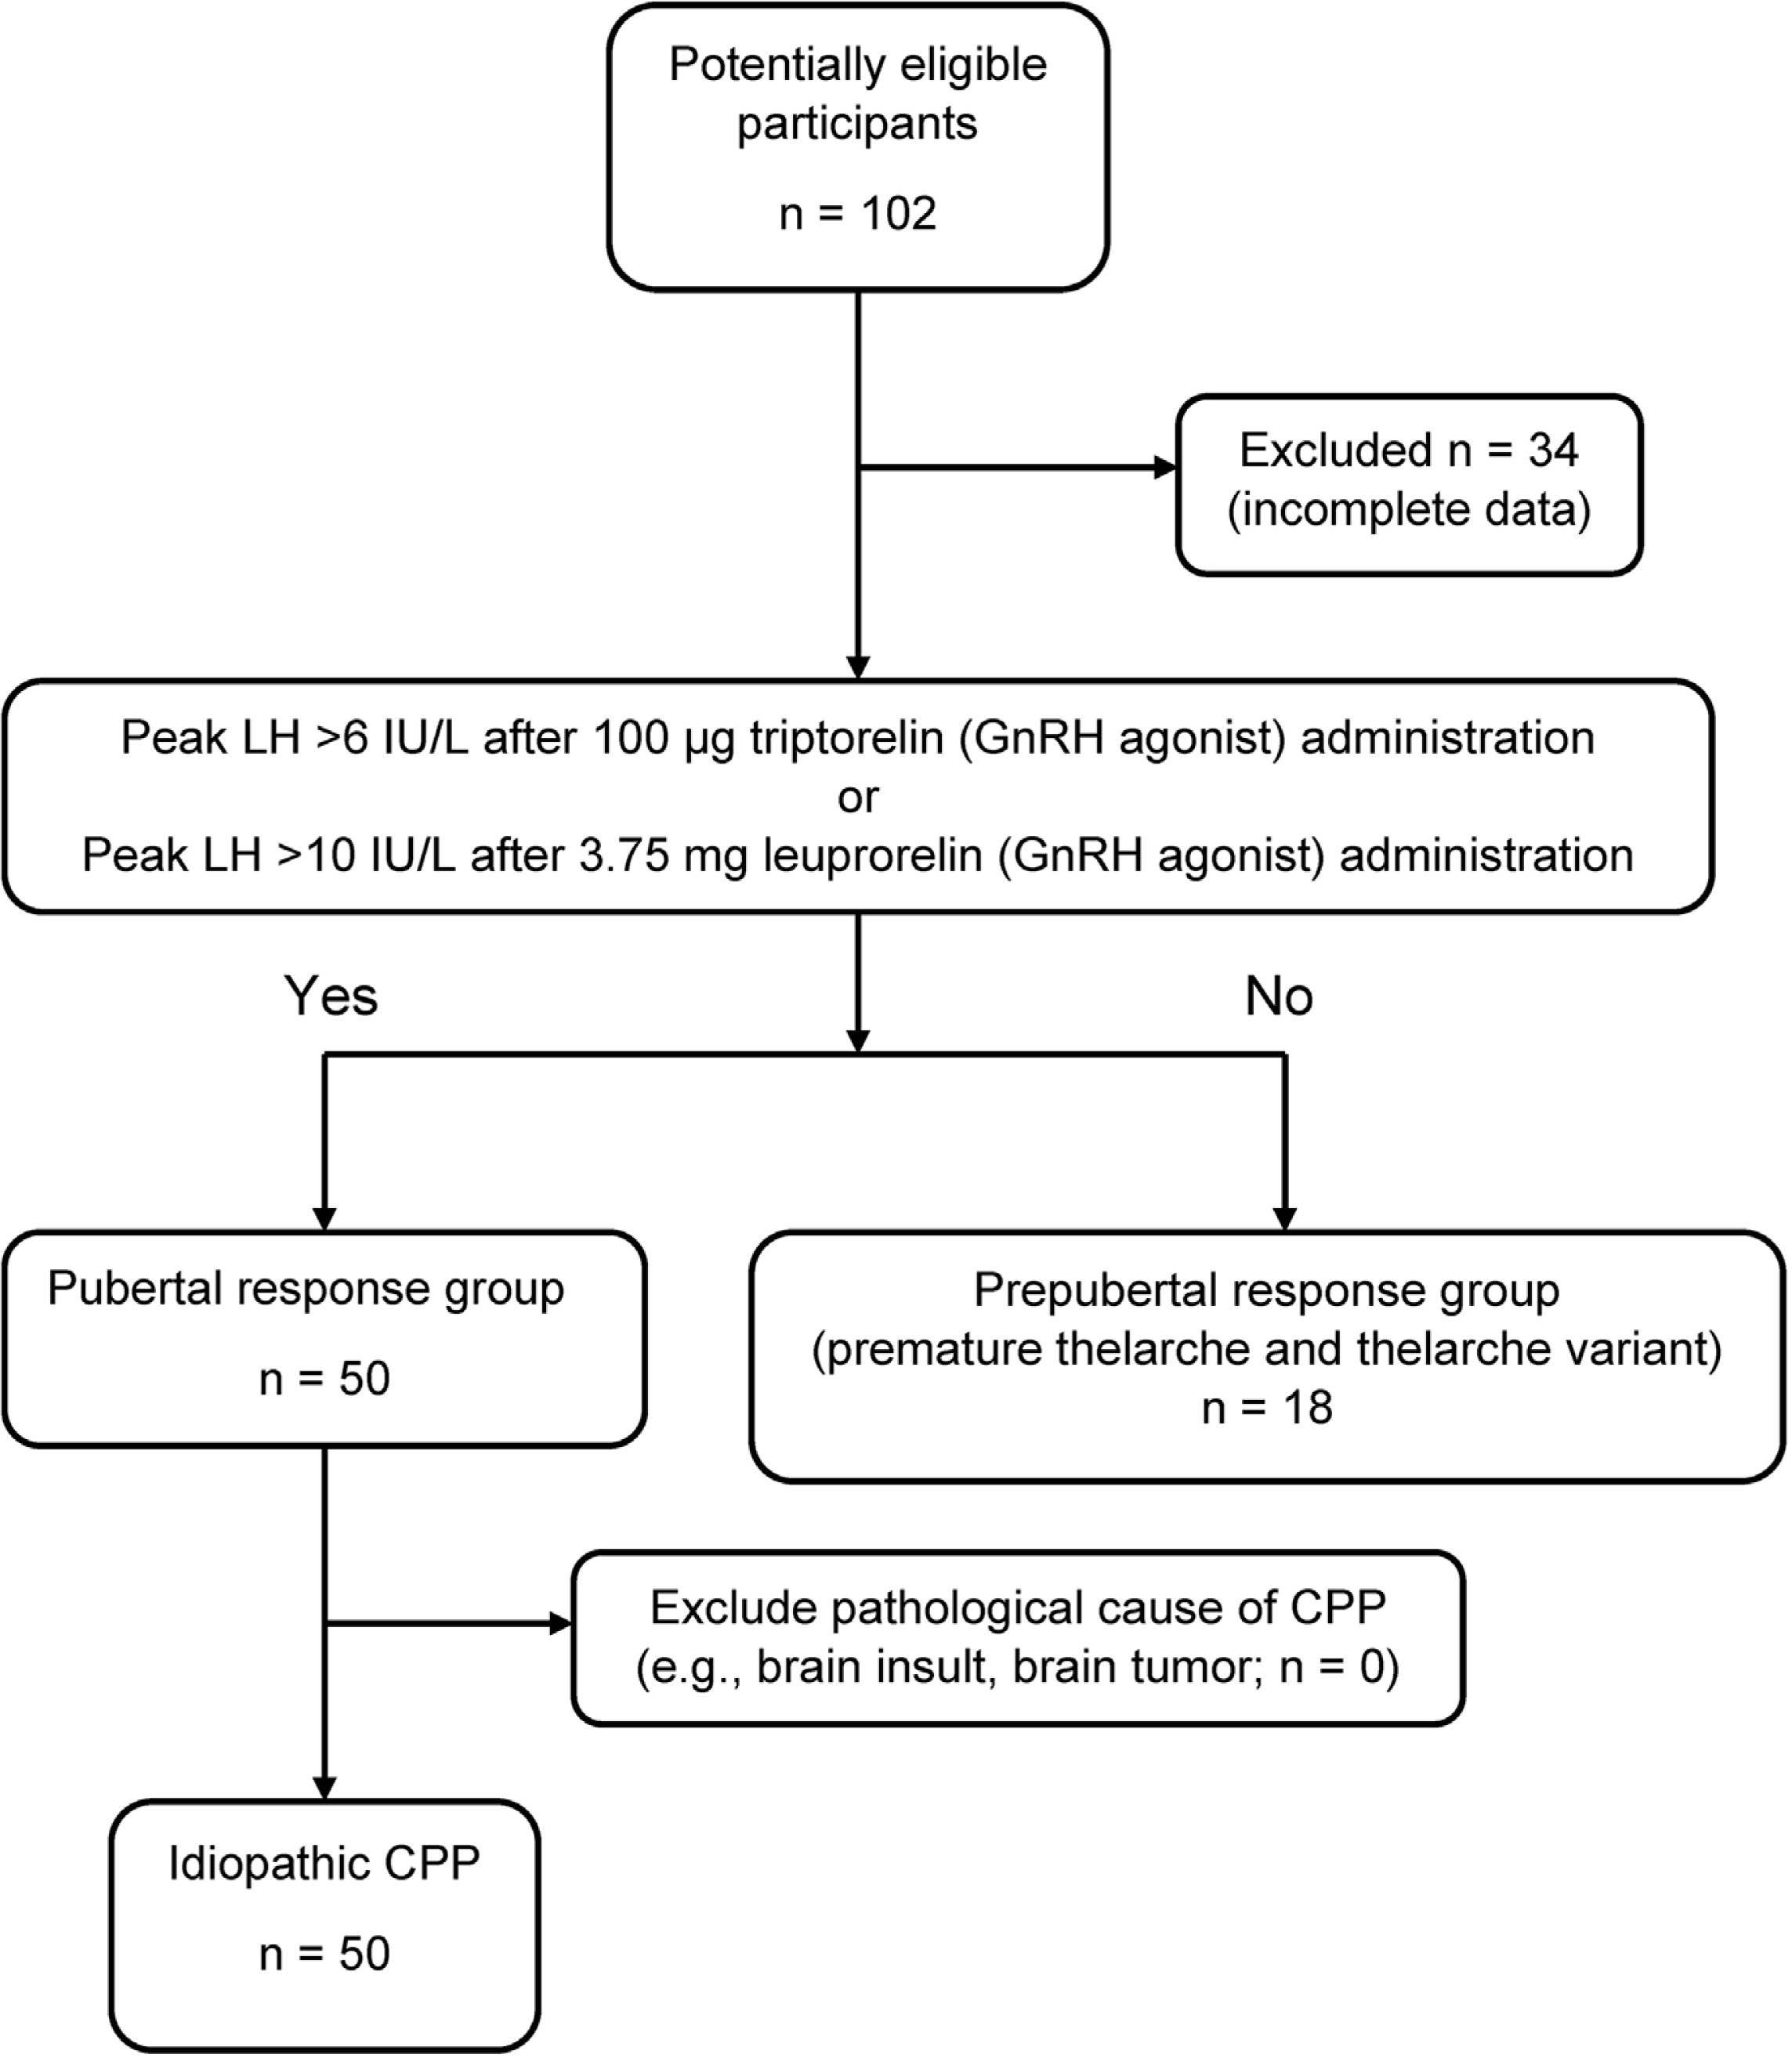
Figure 1
Flow diagram showing the flow of participants though the study. CPP, central precocious puberty; GnRH, gonadotropin-releasing hormone; LH, luteinizing hormone.
Table 1
Clinical and laboratory characteristics of the girls with a prepubertal (PT, TV) or pubertal response (CPP) to a GnRH stimulation test
| Parameter | Prepubertal response (n = 18) | Pubertal response (n = 50) | P |
|---|---|---|---|
| Mean (SD) | Mean (SD) | ||
| Chronological age (years) | 6.37 (1.77) range 2–8.2 | 8.46 (1.46) range 4.8–11 | 0.41 |
| Bone age (years) | 7.91 (2.05) range 4–11 | 10.43 (1.88) range 6.8–12 | 0.85 |
| Uterine length (cm) | 3.34 (0.64) | 4.25 (1.18) | 0.007* |
| Uterine thickness (cm) | 0.95 (0.39) | 1.53 (0.71) | 0.001* |
| Uterine width (cm) | 1.49 (0.60) | 2.43 (0.96) | 0.31 |
| Uterine volume (cm3) | 2.56 (1.53) | 10.96 (11.58) | 0.001* |
| Bilateral ovarian length (cm) | 1.31 (0.31) | 1.48 (0.43) | 0.20 |
| Bilateral ovarian thickness (cm) | 1.09 (0.30) | 1.32 (0.44) | 0.15 |
| Bilateral ovarian width (cm) | 1.30 (0.31) | 1.43 (0.37) | 0.53 |
| Bilateral ovarian volume (cm3) | 1.69 (0.71) | 2.77 (2.06) | 0.01* |
| Basal LH (IU/L) | 0.22 (0.35) | 2.63 (3.99) | 0.001* |
| Basal FSH (IU/L) | 1.34 (1.51) | 2.90 (1.97) | 0.03* |
| Basal E2 (pg/mL) | 51.9 (54.6) | 134.6 (182.2) | 0.049* |
| Peak LH (IU/L) | 4.33 (2.75) | 41.29 (36.19) | <0.001* |
| Peak FSH (IU/L) | 9.45 (4.49) | 13.19 (5.61) | 0.28 |
| Peak E2 (pg/mL) | 53.9 (45.6) | 139.7 (196.3) | 0.10 |
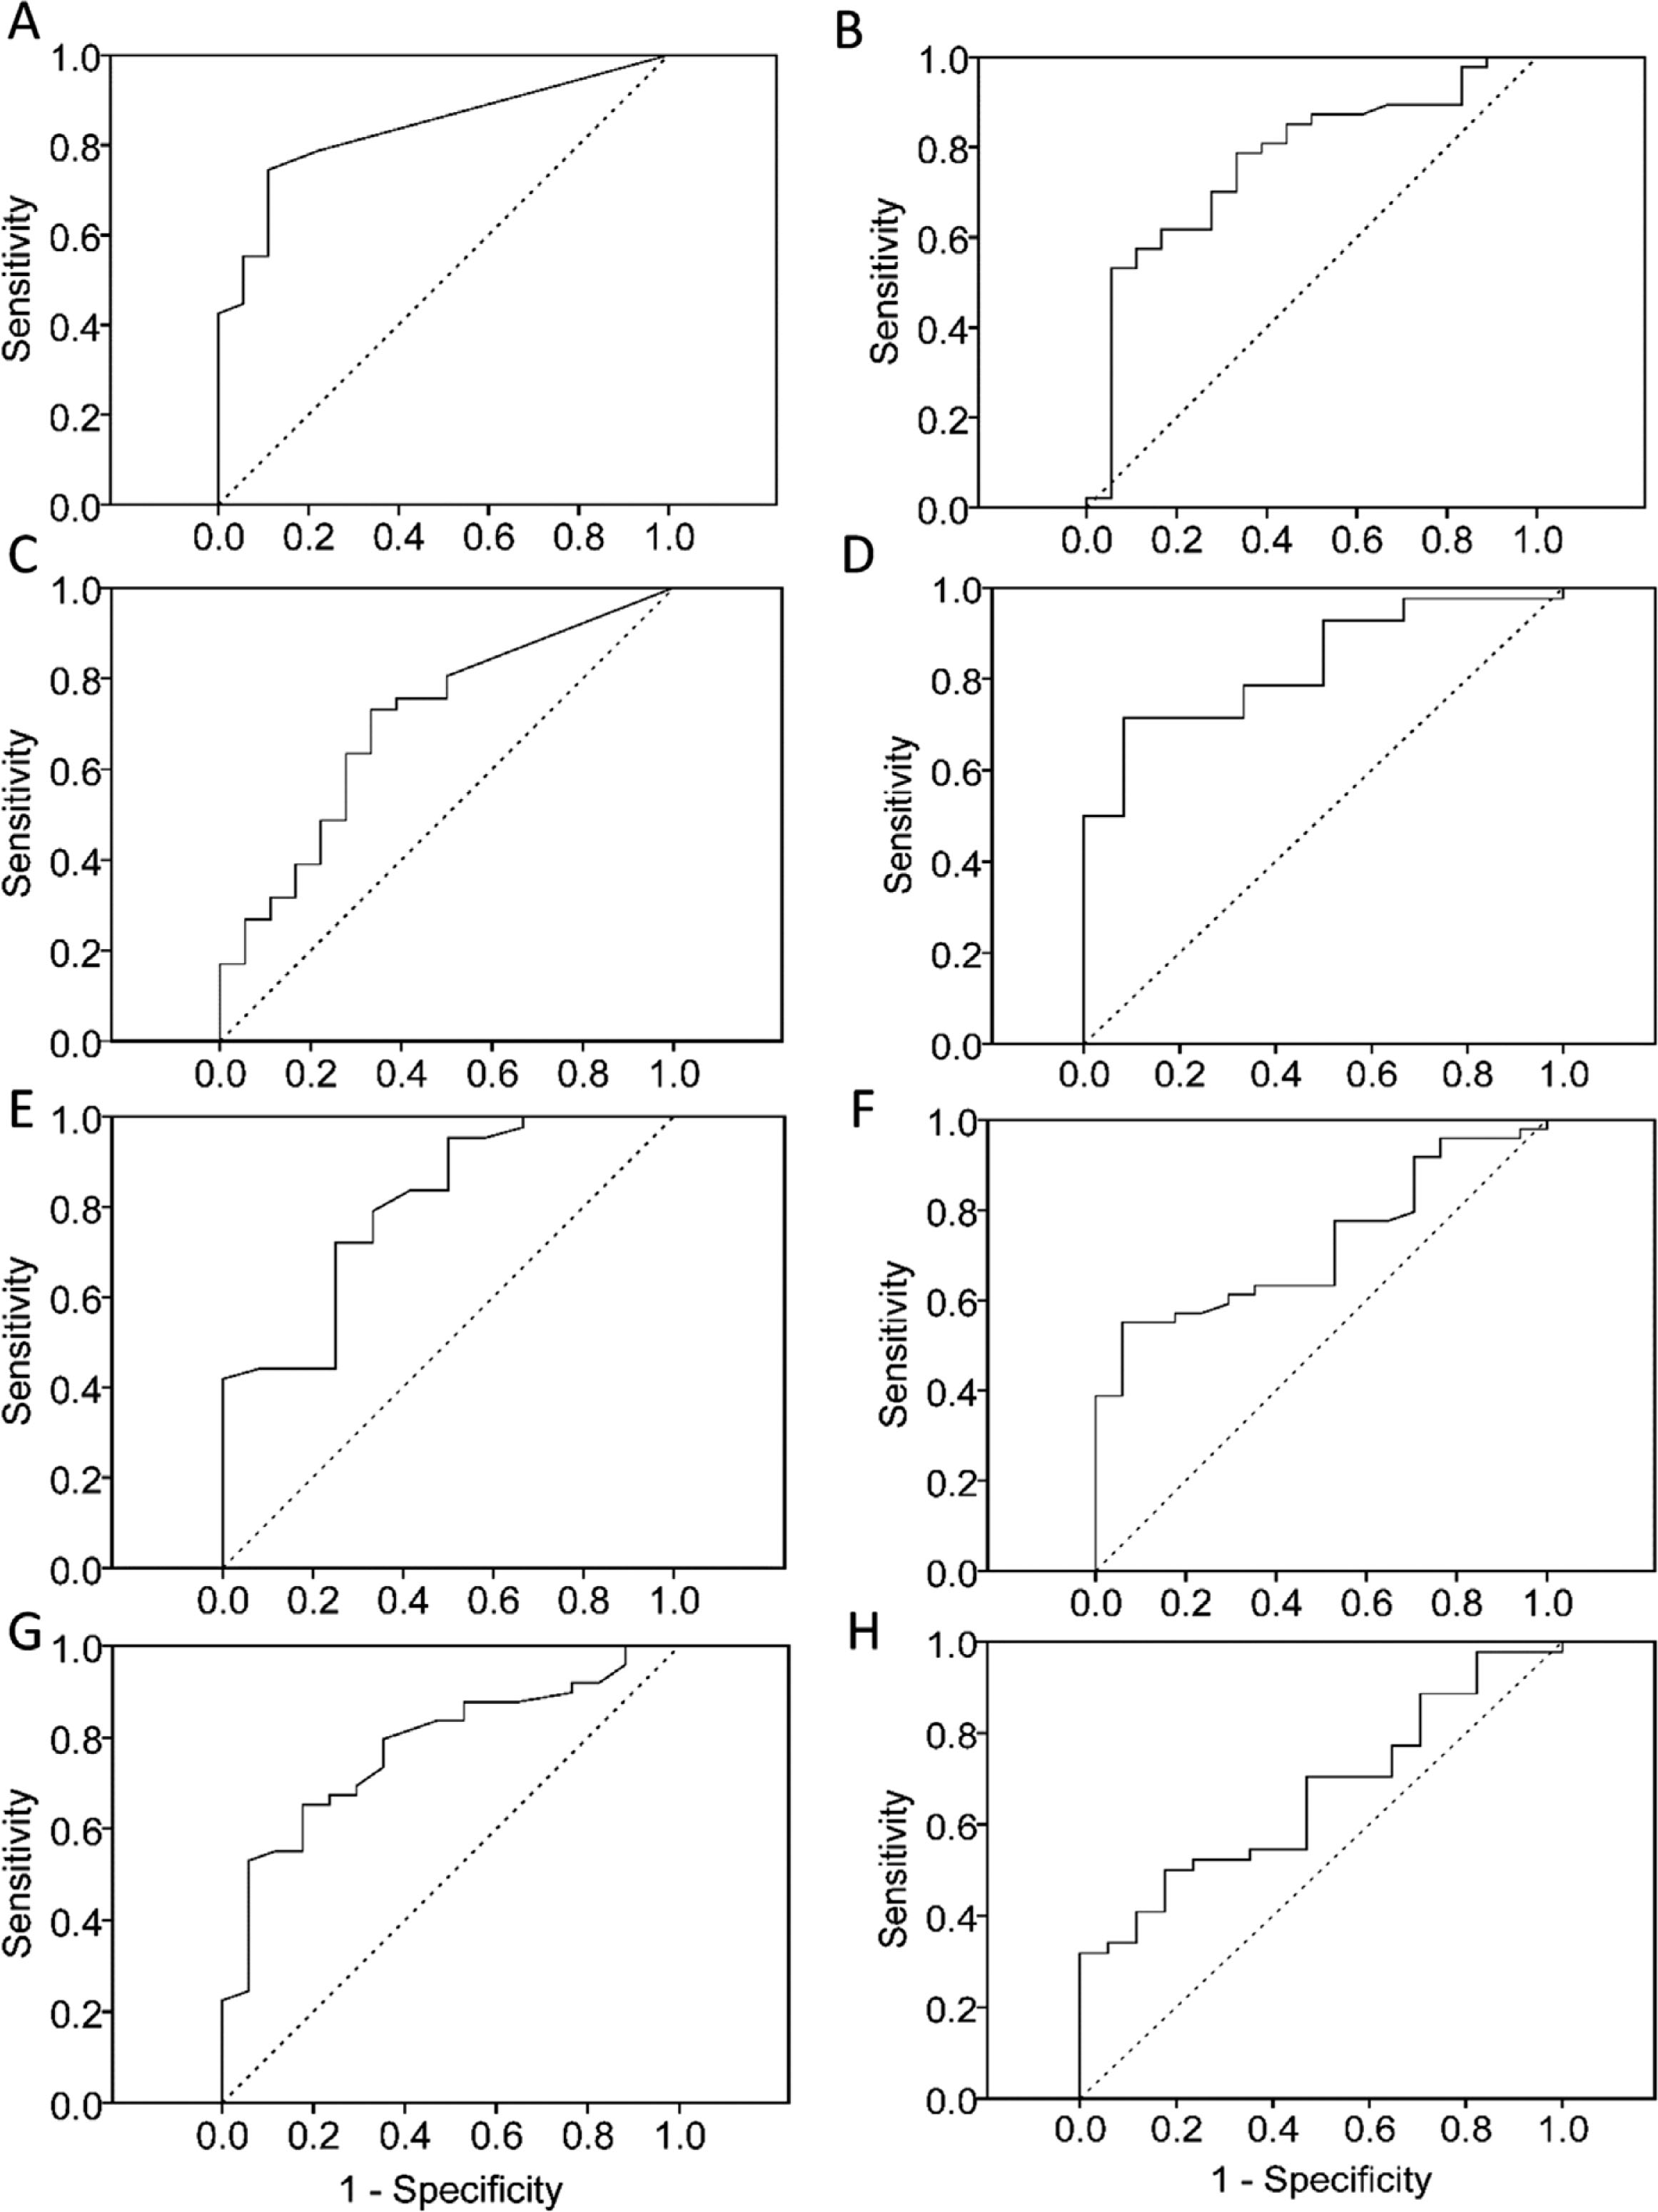
Figure 2
Receiver operating characteristic curves for various ultrasonographic and hormonal parameters. A. Basal luteinizing hormone. B. Basal follicle stimulating hormone. C. Basal estradiol. D. Uterine volume. E. Uterine width. F. Uterine length. G. Uterine thickness. H. Bilateral ovarian volume. Solid lines indicate the variable parameter and dashed lines indicate a reference line. Diagonal segments are produced by ties.
Table 2
Area under the ROC curve, cut off point, sensitivity, specificity, PPV, and NPV of each ultrasonographic and hormonal parameters
| Parameter | AUC | 95% CI | Cut-off | Sensitivity (%) | Specificity (%) | PPV (%) | NPV (%) |
|---|---|---|---|---|---|---|---|
| Basal LH (IU/L) | 0.84 | 0.74–0.93 | 0.25 | 75.0 | 88.9 | 94.7 | 57.1 |
| Basal FSH (IU/L) | 0.77 | 0.64–0.90 | 1 | 85.4 | 55.6 | 83.7 | 58.8 |
| Basal estradiol (pg/mL) | 0.70 | 0.56–0.85 | 25 | 76.2 | 61.1 | 82.1 | 52.4 |
| Uterine width (cm) | 0.80 | 0.66–0.94 | 1.7 | 83.7 | 58.3 | 87.8 | 50.0 |
| Uterine thickness (cm) | 0.78 | 0.66–0.90 | 1 | 73.5 | 64.7 | 85.7 | 45.8 |
| Uterine length (cm) | 0.72 | 0.60–0.85 | 3.5 | 62.0 | 64.7 | 83.8 | 36.7 |
| Uterine volume (cm3) | 0.83 | 0.72–0.95 | 3.5 | 73.8 | 66.7 | 88.6 | 42.1 |
| Bilateral ovarian volume (cm3) | 0.66 | 0.524–0.805 | 1.5 | 71.1 | 41.2 | 76.2 | 35.0 |
[i] AUC, area under the ROC curve; CI, confidence interval; FSH, follicle stimulating hormone; LH, luteinizing hormone; NPV, negative predictive value; PPV, positive predictive value; ROC, receiver operating characteristic.
Table 3
Sensitivity, specificity, PPV, and NPV when combining uterine ultrasonographic and basal hormonal parameters
| Uterine ultrasonographic parameter | Cut-off | Basal hormonal parameter | Cut-off | Sensitivity (%) | Specificity (%) | PPV (%) | NPV (%) |
|---|---|---|---|---|---|---|---|
| Width (cm) | 1.7 | Basal LH | 0.25 | 65.9 | 100 | 100 | 46.2 |
| Width (cm) | 1.7 | Basal FSH | 1.5 | 63.4 | 91.7 | 96.3 | 42.3 |
| Volume (cm3) | 3.0 | Basal LH | 0.25 | 65.0 | 91.7 | 96.3 | 44.0 |
| Length (cm) | 3.5 | Basal LH | 0.25 | 50.0 | 94.1 | 96.0 | 40.0 |
| Thickness (cm) | 0.9 | Basal FSH | 1 | 68.1 | 70.6 | 86.5 | 44.4 |
| Width (cm) | 1.7 | Basal FSH | 1 | 68.3 | 83.3 | 93.3 | 43.5 |
| Width (cm) | 1.7 | Basal E2 | 25 | 69.4 | 83.3 | 92.6 | 47.6 |
[i] E2, estradiol (pg/mL); FSH, follicle stimulating hormone (IU/L); LH, luteinizing hormone (IU/L); NPV, negative predictive value; PPV, positive predictive value.