
The provision of reliable and sustainable water services is a big challenge faced by rapidly urbanizing cities worldwide. The water provider should be able to conduct a self-assessment of its current condition, set targets, and make plans for future target implementation programs. There are tools for assessing current water management practices, such as the current situation analysis and management system (CSAS) (Kiliç et al., 2023), and the asset life-cycle management (ALCM) mode (Haffejee & Brent, 2008). Regarding tackling the sustainability issues, some approaches are being used, such as One Water (OW), which is an integrated planning and implementation approach to managing finite water resources for long-term resilience and reliability (Pokhrel et al., 2022; Dezfooli et al., 2023). In response to the complex and evolving water management outlook, the Utility of the Future (UoF) concept has emerged as a transformative approach, integrating innovative technologies, sustainable practices, and advanced management strategies to enhance water utilities’ performance (Cordoba et al., 2021). It employs participatory approaches in which utility teams are actively involved and empowered to drive the transformation of their utility (Gallandat et al., 2023).
The history of the UoF dates back to 2018 when the World Bank introduced the Framework for Performance Improvements, also known as the Turnaround Framework (Soppe et al., 2018) initiative aimed to support the enhancement of underperforming utilities. Building upon this foundation, the World Bank, in collaboration with Isle Utilities and Castalia, further strengthened the framework in 2019, leading to the development of the Utilities Framework Front, now known as the UoF. Building on the valuable insights gained from previous trials, the World Bank introduced the UoF Toolkit 2.0 in 2022 (Cordoba, 2022; World Bank, 2022). This updated toolkit incorporated lessons learned and best practices, offering more robust guidance for utilities seeking to adopt UoF principles. In 2020, UoF trials were conducted in ten utilities across eight countries, including Albania, Belarus, Brazil, Ethiopia, Ghana, the Philippines, Timor-Leste, and Turkey. These trials sought to evaluate the effectiveness of the UoF in diverse settings and utility contexts (Gallandat et al., 2023). Subsequently, in 2021, the Philippines embarked on a national pilot deployment of the UoF, marking a significant step toward a broader implementation.
The primary goal of the UoF is to deliver a service that is safe, reliable, transparent, inclusive, and responsive to customers. “Safe” implies adhering to quality standards, “reliable” denotes continuous 24/7 supply, and “transparency” means disclosing financial, operational, and performance information that is clear, and accurate (Schnackenberg & Tomlinson, 2016), “inclusive” means not excluding any party or group from the provision of service and/or within the utility, and finally, “responsive” signifies having sufficient capacity to provide customers with quality and timely responses, ensuring customer satisfaction. This objective relies on technical and commercial operations, organization and strategy, financial management, and human resource management. The operational environment of the utility is molded by the legal and governance framework. Other factors influencing the success of the UoF are resilience, innovation, market and customer-orientation, and inclusion. “Inclusion” means the process of increasing the opportunity for people with disadvantages based on their identity to take part in the utility’s operations for better living conditions in the neighborhoods (Puente et al., 2021).
Among the beneficiaries of the UoF program was the country of Indonesia, where the UoF Toolkit 2.0 was successfully implemented. One of the water utilities that had the opportunity to participate in the UoF program was the local government-owned enterprise [Perusahaan Umum Daerah (Perumda)] Tirta Musi in Palembang City, South Sumatra. After undergoing rigorous assessments by the UoF Team from the World Bank, Perumda Tirta Musi Palembang emerged as a promising candidate for UoF adoption, opening up new avenues for empowering citywide water service provision in the region. This study hypothesizes that performing a thorough gap analysis within the UoF framework improves the focus and prioritization of methods for enhancing short-term and long-term utility performance.
This research aims to demonstrate the performance of the UoF framework as a systematic approach for performance evaluations, formulating action plans, and attaining world-class benchmarks in water utilities.
This study focused on the case of the water utility Perumda Tirta Musi Palembang. In the year 2022, when the UoF was starting to be implemented, Palembang City had 1,362,256 people in its service area, with the average number of people in a single family being 4.36 people (Badan Pusat Statistik, 2023). The water utility had a total water production volume of 138,707,289 m3 per year and a total water sell volume of 108,943,367 m3 per year (Ministry of Public Works and Housing, 2022). It is projected that service coverage will be 100% in 2030 (Kurniawan et al., 2021). Data collection methodologies include both quantitative and qualitative approaches. Quantitative methods were employed to gather performance indicator data from utility records, such as service level, operational efficiency, and financial metrics. Qualitative methods involve focus group discussions with employees to collect insights on gaps and goals, as well as document reviews (e.g., policy reports, historical evaluations).
The UoF methodology operates concurrently along two dimensions to enhance performance and stimulate the transformation of water and sanitation utilities: management and operations (a “hard” dimension that primarily focuses on processes and practices) and change management (a “soft” dimension that emphasizes staff engagement, empowerment, and team building). The management and operational aspect of the process involves five phases such as: (1) decision and preparation, (2) rapid in-depth analysis, (3) ignition and short-term action plan, (4) strategic vision and long-term action plan, and (5) sustainable transformation.
The initial phase of the UoF program involves assessing the present condition of the utility and outlining the target advancement of five distinct domains: performance, service, UoF level, maturity, and enabling environment. These aspects are connected to various segments.
The service assessment evaluates the service quality based on the five elements of the diagnostic area (Table 1) using a scale ranging from 1 (elementary) to UoF. An example of the scoring is that, when assessing the performance of the utility service, with a drinking water coverage rate below 50%, it receives a score of 1, while a utility with a 100% coverage rate of drinking water is rated at the UoF service level. The assessment consists of five components, which are reliable, safe, inclusive, transparent, and responsive. Every element is evaluated using one or more indicators. For instance, reliability is appraised through metrics like continuity (hours of supply per day) and availability (averaged domestic water per person per day).
Service assessment criteria
| Diagnostic area | Analysis process |
|---|---|
| Service | Qualitative and quantitative data analysis |
| Performance | Qualitative and quantitative data analysis |
| Maturity | Selecting practices that match the utility’s current state using maturity matrices |
| UoF level | Selecting emerging practices that match the utility’s current state using UoF elements |
| Enabling environment | Selecting practices that match the utility’s current enabling environment using enabling environment assessment criteria |
Source: own work.
Cobweb plots visually compare the utility’s performance in commercial, technical, financial management, human resource management, and organization and strategy, rated from 1 (elementary) to 5 (world-class), as seen in Table 2. Every element is assessed within one or two indicators, for instance, commercial operations are evaluated by the metering rate and collection rate, while the technical performance is evaluated through non-revenue water (NRW). Predicting the NRW provides advantages for budget balances and sound water utility decision-making, planning, and investment (Şişman & Kızılöz, 2020).
Performance level assessment
| Domain | Level | ||||
|---|---|---|---|---|---|
| elementary (1) | basic (2) | good (3) | well performing (4) | world class (5) | |
| Commercial | |||||
| Collection rate [%] | < 60 | ≥ 60–70 | > 70–90 | > 90–95 | > 95 |
| Metering rate (customers metered) [%] | < 25 | ≥ 25–60 | > 60–85 | > 85–95 | > 95 |
| Technical | |||||
| Non-revenue water (NRW) per connection when the system is pressurized [L⋅h−1] | > 50 | > 25–50 | > 12–25 | > 6–12 | ≤ 3–6 |
| Financial management | |||||
| Earnings before interest, taxes (EBITDA) margin [%] | negative | < 5% | ≥ 5–19 | > 19–30 | > 30 |
| Human resource management | |||||
| Staff per 1 000 connections | > 10 | > 6–10 | > 5–6 | > 3–5 | ≤ 3 |
| Organization and strategy | |||||
| Fulfillment of the strategic plan [%] | no performance targets | < 40 | ≥ 40–80 | > 80–90 | > 90 |
Source: Cordoba (2022).
The result of service performance analysis using the criteria in Tables 1 and 2 shows that the Palembang water utility’s current status is at the world-class level in the categories “safe” and “responsive” (Fig. 1). Safe and responsive imply high quality standards, and sufficient capacity to deliver customers with quality and prompt responses, respectively. The water utility has put a lot of effort into ensuring that no party or group is excluded from the provision of service and/or within the utility, as shown in the inclusive category with a score of 80%, or the well-performing level. It underscores its dedication to guarantee that all communities and demographic groups have access to water services. This inclusion signifies a commitment to social equality and suggests that the utility actively endeavors to assist underrepresented and underserved communities. This may encompass customized outreach programs, community involvement activities, and cost-effective pricing strategies, enhancing the overall social sustainability of the utility’s services.
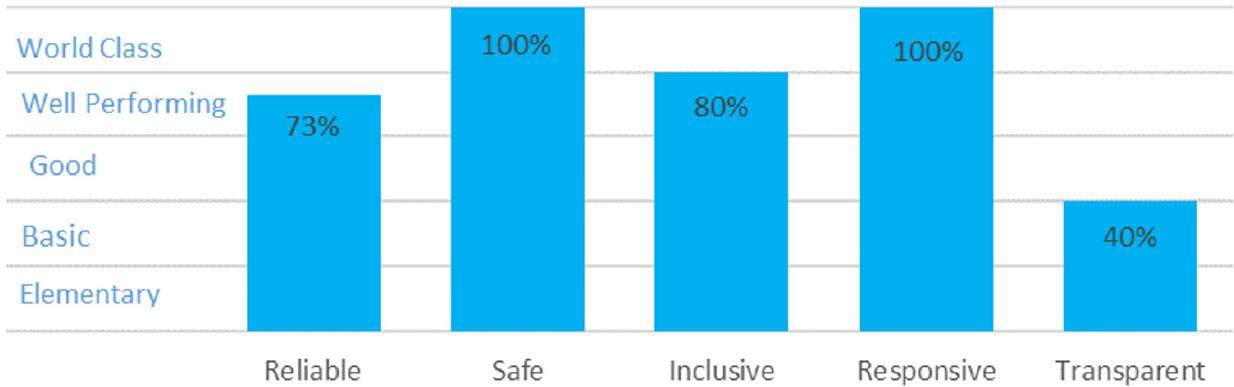
Service at the water utility in Palembang in 2022
Source: Perumda Tirta Musi Palembang (2023a).
Also, at this level, the reliable category represents the continuous 24/7 supply, which is another significant advantage for the utility. Reliability is crucial for addressing the needs of an expanding urban populace and guaranteeing regular service provision. The utility’s capacity to ensure continuous supply enhances its performance in the perception of customers, businesses, and other stakeholders reliant on dependable water access for everyday operations.
Nonetheless, the utility’s performance in the transparency category, achieving a basic level (40%), suggests significant potential for improvement. Transparency is an essential factor in establishing confidence among stakeholders, such as customers, regulatory agencies, and financial investors. The low score indicates that, although the utility may be functioning effectively in its operations, it likely falls short in transparent and precise financial reporting, disseminating operational data, and performance measures. The lack of transparency may stem from difficulties in data administration, an absence of established reporting standards, or inadequate communication regarding the utility’s financial status and operational performance to the public. Furthermore, openness in utility administration is vital for promoting accountability and guaranteeing the effective allocation of resources, particularly in publicly owned utilities.
Figure 2 shows that performance has a higher score than maturity for the commercial operations, financial management, and human resource management elements. This indicates that to maintain its current level of performance, the utility should increase its maturity. On the other hand, the technical operations element has a higher score for maturity than for performance, thus the utility should continue consolidating and optimizing its processes. The circle surrounding the maturity cobweb illustrates the advancement in adopting all UoF implementations over the various components, and the extent of the orange shading reflects the overall percentage of UoF implementations integrated by the utility. It also shows that the utility has implemented about 36% of all innovation practices, which is the lowest implementation among other practices. The highest implementation is resilience, which is as much as 63%. The utility has implemented about 57% and 54% of the inclusion, and market and customer orientation practices, respectively. Comprehensive indicators are needed to carry out the planning and programming in an integrated manner (Mendoza Gómez et al., 2022). Tools of UoF provide graphics showing the gap between the current condition and future goal, hence the CEO understands which elements need to be addressed. The use of the “gap” feature in water service companies has been found effective at improving water utilities’ performance (Han et al., 2017).
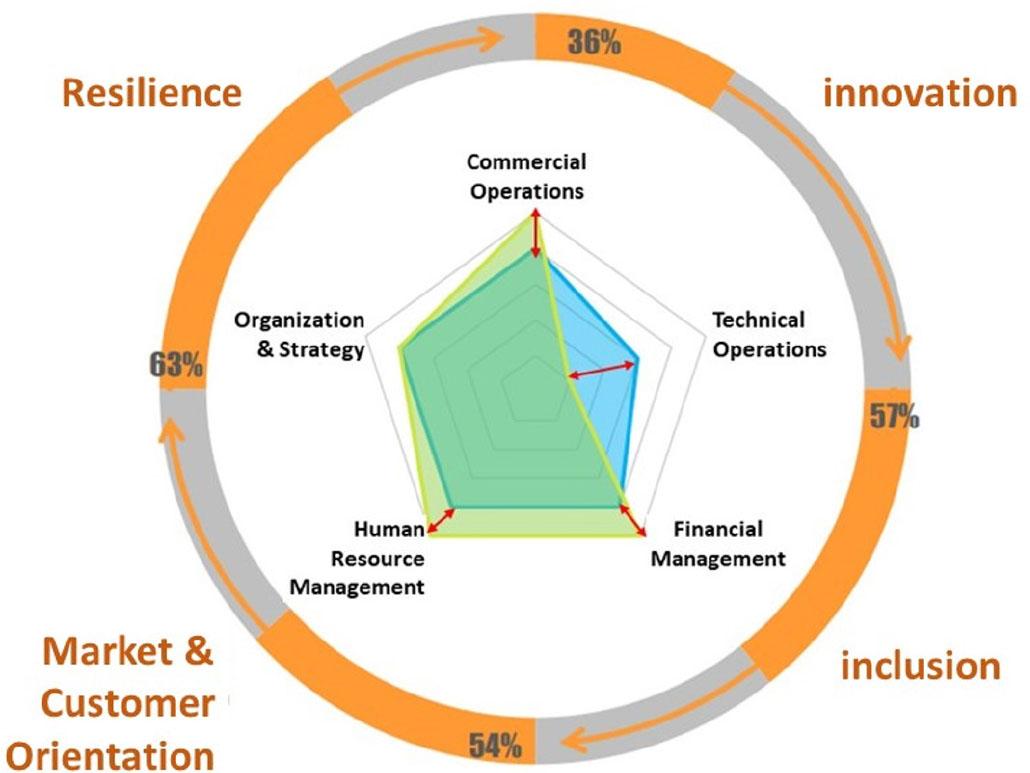
Cobwebs and Utility of the Future dimensions of performance and maturity of Perumda Tirta Musi Palembang
Source: Perumda Tirta Musi Palembang (2023a).
Figure 3a shows the results of identifying where gaps appear between the existing and future levels in the business strategy, monitoring and reporting, and strategy ability elements. Under the existing conditions, the business strategy element revealed that the mission, vision, and strategic objectives exist, but have not been updated and are not known to employees, the annual plans and budgets are not aligned with the strategic goals, mission, and vision, and the strategic objectives are documented at the executive management level, which includes an implementation plan and several performance indicators, but that this has not been fully implemented. A strategic framework, including vision, mission, values, and strategic objectives, is available in the future but has not been updated, while some annual plans are already aligned with the strategic framework. Furthermore, strategic objectives for key performance aspects (e.g. customer service, operations, maintenance, asset management, policies, procedures, and financial reporting) have been defined for at least five years. Future scenarios for asset management should be developed strategically (de-Almeida-e-Pais et al., 2023), for example, the repairs planning of the pipe network (Scholten et al., 2014).
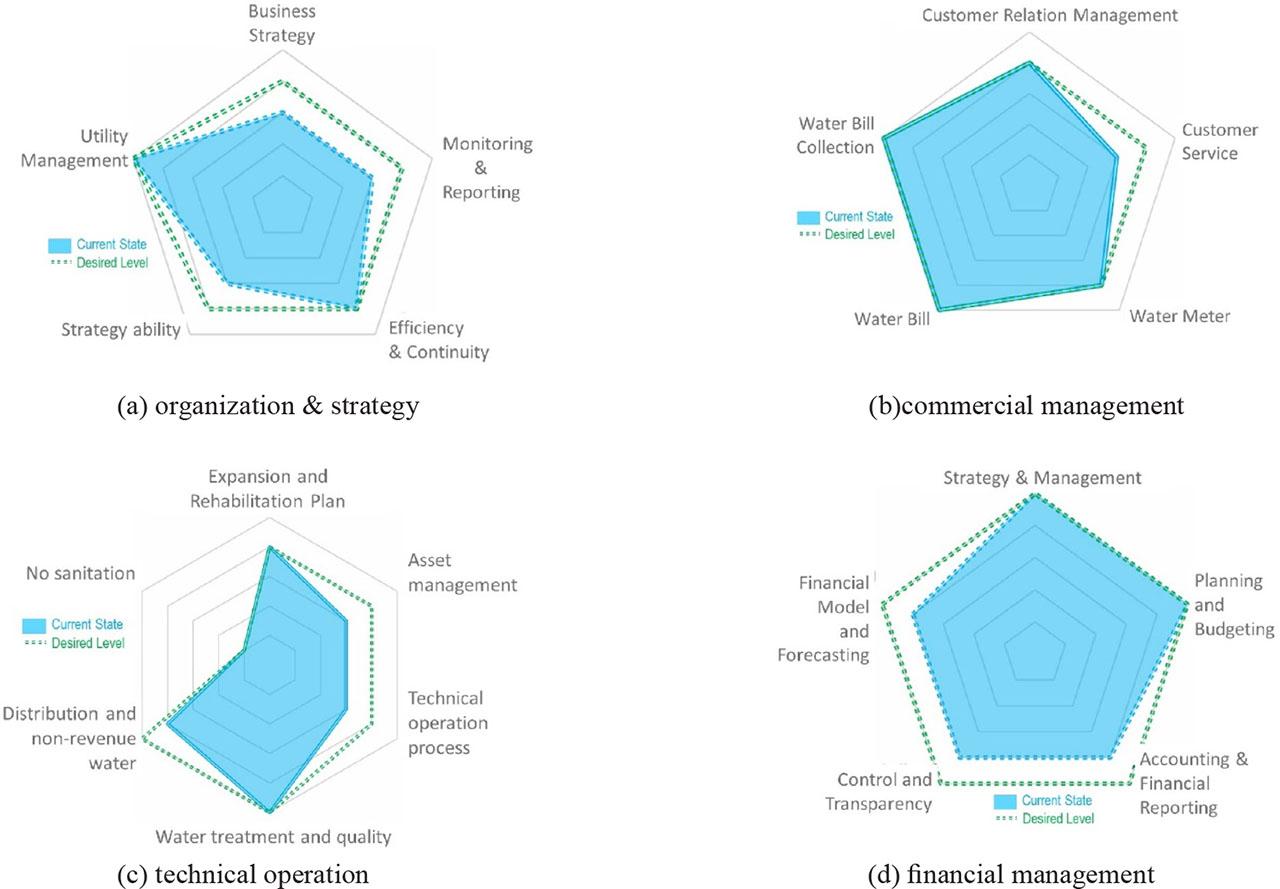
Cobweb of current states and desired levels of the elements: organization and strategy (a), commercial management (b), technical operation (c), and financial management (d)
Source: Perumda Tirta Musi Palembang (2023a).
Figure 3b shows the results of the identifying where gaps appear between the existing and future levels in the commercial management areas, where a gap appears in the customer service area. Under the topic of “method for customers to submit complaints and questions,” the current state includes at least two media for delivery, including one that is electronic (e.g. call center and service provider website) during business hours (Monday to Friday). The desired level will be achieved when various methods, including kiosks and social media, and convenience levels are implemented. This also includes a 24/7 call center and web service, and public service standards and customer rights to escalate complaints being accessible to the public. The existing conditions align with another study that shows that the water utility sector uses social media less effectively to engage with customers compared to the electric utility sector (Mix et al., 2020).
Figure 3c shows the results of identifying where gaps appear between the existing and future levels in the technical operation elements, where gap appear in three areas. The first of these is asset management, as in its current state, it has a documented baseline plan but not a financial or asset life cycle plan, so the desired level consists of these documented plans, including implementation plans and performance monitoring measures, but excludes long-term financial planning. The second area is the technical operation process, which in its current state has an inventory of all processes/handbooks/guidance manuals and their respective update statuses, but not all processes are up to date. Efficient information management is essential for infrastructure asset management; however, numerous utilities struggle with missing or expired data (Carriço et al., 2020). These inventory documents are not always used for operations. The desired level consists of conducting an annual review of the process status and delivering plans to update key processes subject to staff consultation. The third area of the technical operation element consists of distribution and non-revenue water (NRW), which in its current state is undergoing comprehensive strategies to address actual water losses, apparent water losses, and unbilled consumption in priority areas, including time-bound targets for multi-year periods, and establishing policies to assess, monitor and control NRW elements. The desired condition is a practical implementation (including the required capital investments and operating activities) of the NRW strategy. Strategies for lowering the amount of NRW must be consistent with the overall corporate goals, including achieving financial sustainability, minimizing environmental consequences, and enhancing service reliability (Farouk et al., 2023). Also, cross-functional collaboration is crucial, combining technical, financial, and customer service departments to formulate a comprehensive NRW management strategy (Lai et al., 2020).
Figure 3d shows the financial management element, where gaps appear in three areas. The first area is financial model and forecasting, which in its current state reveals a full-cost recovery tariff analysis (OPEX, depreciation, and return) with disaggregation by customer category, irregularly done per year. Tariff design is profoundly affected by social and environmental issues, requiring a theoretical framework that can incorporate these complexities (Granda-Aguilar et al., 2024). The desired level is a multi-year cost recovery tariff analysis, which is updated annually. The second area is accounting and financial reporting, with the current state of the detailed fixed asset register (including cost, location), and defined assets. The desired level is an asset management system that incorporates the condition, maintenance planning, and management of the assets. The third area is control and transparency, where the accounts are not published in their current state. The desired level is in the world-class category, where the accounts are published regularly. The domains of accounting and financial reporting, along with control and transparency, are essential to the utility’s evolution into an excellent company. The former emphasizes operational efficiency and asset optimization, whereas the latter fosters trust and accountability. Overall, they constitute interconnected pillars of financial resilience and governance, ensuring that the utility is both efficient in service delivery and transparent and responsible in its operations. These adjustments, though challenging, are essential for the utility’s aim of sustainability and excellence.
Figure 4a shows the results of the identification of the current state and desired level in the human resource element, where a gap appears in the performance management area. The current state of this area is an annual performance evaluation with semi-annual follow-up based on progress toward employee goals. Evaluation includes supervisory feedback, improvement plans, mentoring, and supervisory commitment to implementing improvement plans. The desired level is an annual performance evaluation with quarterly or semi-annual follow-up.

Cobweb of current state and desired level of elements
Source: Perumda Tirta Musi Palembang (2023a).
The green management element has a gap in the greenhouse gas (GHG) emissions area (Fig. 4b). In the current state, GHG emissions have not been considered, so at the desired level, GHG measurements have been included in the water utility’s objectives but have not been completed.
There are four areas with gaps in the energy efficiency element, as shown in Figure 4c. The first area is strategy and management. Another area is energy monitoring and reporting, where its current state is energy tariffs, and contracts are known and managed by the administrative team. The desired level is that key consumption points that have driven contract/tariff optimization and optimization opportunities are considered by operations. The third area is vendor and procurement, where energy efficiency is the main criterion for vendor selection at the current level of “good”. The “well-performing” level is where every appliance purchase has an energy efficiency component, updated regularly to follow the latest technology and tools. The fourth area is power system and assets, where in its current state, dedicated teams use modern tools to optimize maintenance plans and schedule proactive steps. To meet the world-class level, maintenance plans are digital and based on data-driven interactions to trigger proactive steps.
Figure 4d highlights a significant deficiency in the culture and value domain, particularly on the gender equality component. The utility currently operates at a “basic” level, indicating limited advancement in the integration of gender-sensitive practices. Although fundamental guidelines for minimizing sexual harassment are available, they are predominantly compliance-oriented rather than focused on fostering proactive cultural transformations. This suggests that the utility’s strategy for gender equality is reactive instead of proactive, lacking the necessary depth to cultivate an inclusive organizational atmosphere. The desired state, referred to as the “good” level, emphasizes advancements in formalizing gender equality initiatives, including the documenting of policies. The lack of implementation methods and training programs signifies a substantial deficiency in the operationalization of these policies. In the absence of explicit procedures, both personnel and management may lack the requisite guidance to implement the policy effectively, thereby diminishing its efficacy (Imonikhe & Moodley, 2018). The lack of training on sexual harassment prevention results in a knowledge deficit, hindering the organization’s capacity to enhance awareness, modify behavior, and cultivate a workplace culture that actively supports equality and safety.
Based on the gap analysis from the cobwebs, an action plan to close these gaps is then developed. The action plan is tailor-made, incorporating careful near-future actions and an expansive perspective on enduring strategies. Table 3 shows the final 100-day action list that has been validated by the water utility’s team. Such a tailored plan is a crucial component of strategic management planning for water utilities, to enable effective management (Almeida et al., 2021). The 100-day action plan was successfully implemented from October 2022 until 27 January 2023.
Matrices of 100-day action plan
| Area | Topic | Action | Time [week] |
|---|---|---|---|
| Element: Organization & strategy | |||
| Business strategy | strategic architecture | Strategic framework available but not yet updated, including vision, mission, values, and strategic goals. Some of the annual plans are aligned with the strategic framework. | 8 |
| Efficiency & continuity | process optimization | Accommodate ideas to improve company performance, create a team that will accommodate, evaluate, and select the best ideas (rewarded), and then report to management. | 10 |
| Strategic capability | procurement management | Analyze historical data of the procurement process (1‒2 years) by categorizing purchases and contracts (services) based on value, supplier, etc. | 6 |
| Element: Commercial management | |||
| Customer relation management | communication strategy | Website updates and social media (Instagram, Facebook etc.) direct information about zones to be repaired, flow disturbances, tariff structures, publication of water quality test results, bills from large customers, etc. | 15 |
| Element: technical operation | |||
| Asset management | asset recording | Adding criteria to asset applications regarding good, normal, and bad conditions, must be replaced, maintenance. | 10 |
| maintenance notes | Develop an asset management application for water meters regarding the condition of the water meters, the amount, replacement, and removal of water meters that were previously only connected to PKA and service units to the budget and asset sections. | 12 | |
| Water treatment & quality | water quality test method | Obtain laboratory certification according to ISO 17025:2017 (International Organization for Standardization [ISO], 2017). | 15 |
| Distribution & non-revenue water | average true range (ATR) of management strategy | Reports to management on the state of non-revenue water in the district metered area (level of non-revenue water, critical areas, key issues, etc.), as well as possible solutions in the short- and long-term (estimated cost of possible solutions). | 12 |
| Element: Financial management | |||
| Planning & budgeting | budget system | Install financial software for work units to monitor budget realization online by budget users (programs can also be monitored by management), and carry out application usage training. | 5 |
| Accounting & financial reporting | asset register | Uploading audited financial reports (annual reports) to the website, for example, profit and loss balance. | 4 |
| Element: Human resource | |||
| Compensation, benefits & retention | reward & acknowledgement | Create a set of rules including indicators for employees who innovate and their rewards. | 12 |
| Culture & value | organizational culture | Change the habits of employees to carry out energy efficiency (there is already an official memorandum followed by a socialization program for each work unit). | 10 |
| Element: Energy efficiency | |||
| Energy monitoring & reporting | study & audit regarding energy | Analyze the main sources of energy consumption and the average annual cost of each building/pump. Energy efficiency: pumping, offices. | 10 |
Source: Perumda Tirta Musi Palembang (2023b).
The 100-day action plan implementation evaluation demonstrated that the UoF framework effectively supports the water utility in assessing its current state, identifying gaps toward future goals, and formulating a five-year plan to achieve those objectives. Another finding indicates that leaders who are dedicated and devoted are crucial for the successful execution of the UoF. Leadership and purposeful knowledge management are critical to the implementation of the plan’s success in any water utility (Omar et al., 2017; Ruiz-Palomino et al., 2021). Tianingrum (2021) performed a case study in a city in Indonesia, revealing that leadership has a positive and significant influence on organizational culture, and following this, organizational culture then has a positive and significant influence on employee performance. This study found that the framework can be adapted to the unique challenges and conditions of local contexts. Also, through the performance gap analysis, a comprehensive performance and maturity assessment can be drafted to pinpoint specific focus areas, such as technical operations, and integrate these insights into the planning process.
The UoF approach to the planning and sequencing methodology begins with an assessment of the present condition of the utility in terms of services, maturity, performance, and assessment of ecological responsibility. After that, the framework pinpoints its focused elements by recognizing the gaps during its assessments. In the case study, technical operation was identified as an area of focus that scored lower in the performance assessment compared to the other areas. The UoF framework’s objective is to steer utility companies and professionals in formulating action plans while considering their specific areas of emphasis and enduring aspirations. The outcome is a tailor-made 100-day action plan encompassing meticulous short-term steps, provisional medium-term measures, and a broad overview of long-term actions. The UoF methodology is suitable to be used to support the water utility in understanding its current condition effectively and thoroughly, and its gaps between the present benchmark to future goals. Later, this gap can be incorporated into the formulation of an inclusive action plan to finally achieve a world-class water utility. Future studies will explore implementations of the UoF in more water utilities across Indonesia, offering insights into sustainable performance improvement.