
Decision-makers need a reliable basis for making appropriate decisions for business development. A company’s investment decisions, specifically in technical facilities and equipment that have a primary impact on its success and market assertion, are critical. Such investments are strategic decisions because technical equipment, such as production facilities and machinery, represent a significant long-term financial investment.
Discounted cash flow (DCF) methods are used to estimate the value of investments made in projects. The NPV (net present value) method is the most commonly applied. Life cycle cost (LCC) analysis together with NPV is the preferred method of analysis in the energy sector. The LCC analysis helps decision-makers select the best option. To create a reliable basis, transmission system operator (TSO) owners and operators of natural gas infrastructure in Germany rely on case studies. These studies aim to select the best option for a defined operation task, such as the decision-making done in compressor stations. Most case studies follow the LCC method of analysis. Although the procedure is straightforward, authors of such case studies encounter challenges that have a considerable impact on the study results and the selection of the best option.
Operational expenditure (OPEX) uncertainties, input data for the NPV calculation, and prediction of future development of input data create the risk of the best investment option not being selected, resulting in the misallocation of limited funds. To address these uncertainties and risks in the evaluation, probabilistic and deterministic methods are proposed. Seven TSO case studies and a single publication (Cierniak, 2001) are examined in this study.
In this study, the impact of input data and the prediction of the future development of input data in case studies on the calculation results of LCC analyses are examined. In retrospect, the case study analysis shows that the prediction of energy costs (among other cost drivers) involves high uncertainty that could result in incorrect decisions. Furthermore, the effectiveness of the Monte Carlo simulation (MCS) probabilistic method for improving the prediction of input data is analyzed. However, the value of the MCS is in quantifying the reliability and validity of results using descriptive statistics. This study focuses on investments in compressor stations in Germany’s natural gas infrastructure. The results can be applied to other business areas, such as construction, with machinery involving energy costs as a cost driver.
Transmission system operators (TSOs) and companies involved in transporting natural gas across Germany operate the high-pressure natural gas pipeline network. These compressor stations maintain pressure in the pipeline system. Before investing in compressor stations, TSOs contract consulting firms to conduct case studies on the intended investment. The most technically and economically advantageous option is developed using the NPV method (Homann et al., 2017). The case studies are prepared by experts. Consequently, the German natural gas industry makes decisions on structured models comprising economic and technical criteria and following LCC and NPV as the commonly used DCF methods. The case studies include capital expenditure (CAPEX) and operational costs for energy and maintenance in the OPEX. Two publications by Heyer and Wieke (1998) and Cierniak (2001) describe this approach in case studies. Essentially, both follow LCC analysis.
This study examines seven case studies on investments in compressor stations. Six case studies include NPV calculations (following LCC analysis) to determine the best option. Cierniak’ paper (2001) in a scientific journal is included in this study. Decision-making in the German natural gas infrastructure is a defined and structured approach based on LCC analysis.
Shafiee et al. (2019) explain that LCC calculates all direct costs associated with a project or policy without considering indirect costs (or benefits). The valuation process involves summing the DCF incurred during the project life cycle, assets, and policies using an appropriate discount rate. The main operational cost drivers are the energy and maintenance costs. Project costs comprise CAPEX and OPEX, where CAPEX represents the initial investment, and OPEX includes both the energy and maintenance costs over the lifetime. Other cost factors, such as consumables (e.g. grease or compressed air), can also be considered; however, they are of minor significance.
The LCC method of analysis is widely used in the hydrocarbon industry. Kawauchi and Rausand (1999) conducted a detailed literature survey, online review, and interviews with experts, focusing on examining the basic process of LCC analysis, which contributed to the literature. Furthermore, Kawauchi and Rausand (1999) provide an overview of the codes and standards that establish the details and procedures of LCC analysis. The rules established in the codes and standards are applied in the German gas sector.
A systematic review of the current state-of-the-art and future perspectives on the application of various DMS (decision-making support) methods in the upstream oil and gas industry includes studies published by scholars and practitioners worldwide in relevant English-language journals and conference proceedings between 1977 and 2016 (Shafiee et al., 2019). The literature is identified using databases, such as Scopus, Web of Science, OnePetro, Knovel, IEEE Xplore, the American Society of Mechanical Engineers (ASME) digital collection, and Google Scholar. Related articles are selected based on a set of inclusion criteria, and 110 publications are identified. The LCC has been the most relevant method for decision-making over the past four decades.
Korpi and Ala-Risku (2008) reviewed LCC cases reported in academic and practitioner literature, which is not limited to the energy sector. They found that most of the reported LCC cases were far from ideal. The review highlights the difficulty of conducting a reliable LCC analysis. Further research is encouraged.
The LCC analysis is established in codes and standards such as ISO 15663 Parts 1–3 as an international standard (International Organization for Standardization [ISO], 2000, 2001a, 2001b). The LCC is relevant for decision-making in strategic management and is used to answer a broad range of questions in production processes. It is used to find the best option for an investment project and is established in the German natural gas infrastructure. In fact, not the NPV is calculated, but the discounted cumulated expenditure (DCE). The DCE follows the same rules as the NPV, but does not include revenues. The DCE presents the NPV, but revenues are not included because it is identical for all candidate options for the defined operating cases. In other words, DCE can be considered as the total cost of ownership (TCO) comprising the CAPEX and OPEX.
If all other things are equal, the alternative that is the least expensive over time should be selected (Lee Jr, 2002). For this reason, the option with the lowest DCE is considered the most advantageous.
The LCC analysis is a state-of-the-art method for evaluating infrastructure projects, as they have a long-term horizon in terms of preparation (engineering), execution (construction), and operational lifetime. A lifetime of beyond 20 years is common. Input data and predicting future development involve large uncertainties. Therefore, uncertainties in the input data must be addressed to avoid making incorrect decisions about an investment project. These uncertainties can be addressed in different ways. Ilg et al. (2017) and Scope et al. (2016) conducted systematic literature reviews and identified 115 relevant publications, mostly case studies, in which these uncertainties are addressed. Ilg et al. (2017) and Scope et al. (2016) discuss the different techniques for coping with uncertainty and categorize them as probabilistic, deterministic, possibilistic, and other approaches. Ilg et al. (2017) report that 91 articles mentioned or applied deterministic methods, 90 articles used probabilistic methods, a small number (42 articles) addressed uncertainties using possibilistic methods, and 61 articles applied other methods.
Ilg et al. (2017, p. 280), describe probabilistic methods as “encompassing stochastic techniques that include randomly selected parameters in a variety of sampling methods, e.g. Monte Carlo simulation.” Ally and Pryor (2016) describe MCS as suitable to quantify the uncertainty of input data in LCC because the key inputs of the model can be randomly and independently varied by their nominal value, which is consistent with a probability distribution function (PDF) to generate a new set of LCC results. The MCS evaluates the impact of simultaneous changes of several input variables on the result – in this case, the NPV. The output of an MCS is an aggregate distribution of these target variables (Ilg et al., 2017). The MCS iterates this process many times, generating new random inputs each time and producing a distribution of LCC outputs that provide a quantified understanding of the uncertainty associated with the LCC model (Ally & Pryor, 2016).
Deterministic methods are used if the input data can be determined, for example, if historical data are available. However, there are several uncertainties associated with the extrapolation of historical data to the future and these uncertainties must be quantified and evaluated. Using deterministic methods, the future development of input data can be evaluated. Scope et al. (2016), besides others, identify sensitivity analysis as a recognized method. Sensitivity analysis is a suitable method for estimating uncertainties. It is straightforward, easily applicable, and provides a comprehensive assessment of the validity of the input data. Also, EN ISO 15663 refers to sensitivity analysis for evaluating uncertainties. Nábrádi and Szöllösi (2007) state that given the uncertainty that may exist about the future, it is often useful to perform sensitivity analyses, which ask a number of “what if” questions.
There are several procedures to reduce uncertainties in the application of LCC. The primary methods for evaluating uncertainties in the long-term development of input data in LCC are probabilistic and deterministic. However, there are no established guidelines regarding the use of these procedures. Experts performing LCCs are responsible for determining the method that must be used to minimize uncertainty. In this respect, a key point is to provide decision-makers with a comprehensive indication of the reliability of the results. Thus, decision-makers’ requirements have a significant influence on the selected procedures. The model’s creator best understands the influencing factors and their reliability and can suggest a method to minimize uncertainties. Recognized recommendations should serve as a guideline for selecting an appropriate method.
With a view to the relevant codes and standards (these are recognized recommendations and represent the state-of-the-art), especially to EN ISO 15663-2 (ISO 2001a), a sensitivity analysis is recommended. The VDI 6025 (Deutsches Institut für Normung [DIN], 2012) guideline also recommends sensitivity analysis.
Besides sensitivity analysis as a deterministic method, a risk assessment, representing probabilistic methods, is also conducted. The probability of the calculated DCE should be ranked and risk mitigated using MCS. To evaluate the executed studies, MCS and sensitivity analysis are used to improve the decision-making model, which makes it possible to assess the reliability of the results of the model calculation and to provide a strong basis for decision-makers. This work focuses on MCS.
It is shown that the results of the case studies, which are based on assumptions, deviate significantly from the verification with real historical data for energy costs. The prediction of future energy costs is subject to a huge number of publications where related economic theories are discussed. These involve modeling approaches in order to improve prediction. Besides other modeling approaches, MCS is utilized by authors. The broad range of MCS’s application is demonstrated by Heck et al. (2016), Tat (2018), Elfarra and Kaya (2021), and Wealer et al. (2021). MCS has been adopted to evaluate the executed case studies for risk assessment. The modeling for the LCC and NPV calculation is Excel-based. For MCS, the open source add-in “XLRisk” has been implemented. The developers point out that “XLRisk” works in a similar fashion to commercial add-ins such as @RISK by Palisade.
Compressors and compressor stations are the central components of a natural gas network. Compressors maintain pressure in the system and facilitate natural gas transportation. Investments for compressor stations are above 100 million EUR for a single compressor station. Investment in compressors is long term and associated with considerable monetary resources. During the decision-making process, TSOs rely on case studies.
Seven case studies form the basis for decision-making on investments in the natural gas infrastructure. The analyzed case studies follow LCC, as outlined in EN ISO 15663-1 (ISO 2000), EN ISO 15663-2 (ISO 2001a) and EN ISO 15663-3 (ISO 2001a). These case studies identify the best investment option for compressors in Germany’s natural gas infrastructure. The assessed case studies are performed by experts from consulting firms and are reviewed by TSO experts representing the opinions of experts from consulting firms and TSOs. However, these case studies are not accessible publicly, as they are private sector case studies. Therefore, such case studies are typically not available for scientific research. The seven evaluated studies were performed during the period from 2005 to 2015. Additionally, one publication issued in 2001 is examined, meaning a total of eight studies are assessed.
The input data in the analyzed case studies used for calculating the NPV (or DCE) are CAPEX, OPEX (energy costs, maintenance costs, costs for carbon dioxide certificates), operating hours, and macroeconomic data such as discount factor and inflation rate. In this context, CAPEX is the given input data, as expected investments are determined individually for an option based on budget price inquiries or characteristic values.
The set-up of the input data, especially the prediction of future trends in the development of the input data, must be carefully considered. Investment projects have a long-term horizon in terms of preparation (engineering), execution (construction), and operational lifetimes. A lifetime beyond 30 years is not uncommon. The set-up of the input data and future development is associated with high uncertainties. Uncertainties in the input data must be addressed to avoid incorrect investment decisions in projects. Energy costs include costs for electricity and natural gas. Both types of energy are used to drive the compressor motors, which are either gas turbines/gas engines or electric motors. The authors of the case studies applied escalation factors (i.e., 3% per annum) to predict the trends in future energy and maintenance costs.
In the executed expert studies, the NPV (DCE) is calculated to investigate the various options available for an investment project. These study models are replicated using the author’s input data, and DCEs are recalculated using real historical data. The results of the NPV (DCE) calculations, based on historical data, are compared to those with data applied in the expert studies. The predicted input data (generated with an escalation factor per annum by the authors of the case studies) deviate from the real historical data. Real historical data for energy and maintenance for each year are established during this research. Real costs are historical data from the current perspective and can be generated using data from official sources, such as Statistisches Bundesamt – Destatis (German Federal Statistical Office).
The first step in analyzing the case studies involves replicating the calculation models of the authors’ LCC analysis; that is, the algorithm is replicated. Only when the replication results match with those of the authors’ calculation models can it be assumed that the repeated algorithm is fully understood, and the second step is prepared. The input values of the case studies are not used in the second step. Instead, real historical (from the current perspective) costs of electrical energy and natural gas are used. The same applies to the cost of carbon dioxide certificates. Maintenance costs provided by manufacturers are used instead of the authors’ data. The result of the second step is a DCE based on real input data. This examination of models shows whether the ranking of options calculated in the expert studies remains unchanged or not when real historical data are used. A comparison of the results demonstrates the robustness of the LCC analysis in the case studies.
The MCS is suitable for quantifying the uncertainty of the LCC because the model’s key inputs can be varied randomly and independently with respect to their normal value, which is consistent with the PDF to generate a new set of LCC results (Ally & Pryor, 2016). The MCS is a method to evaluate the impact of simultaneous changes of several input variables on the result; in this case, the NPV. The output of an MCS is an aggregate distribution of these target variables (Choudhry, 2006; Gleißner & Wolfrum, 2019). Jorion (2002) explains that MCS is the most powerful, comprehensive, and potentially accurate method of quantifying risk. However, they state that the price of accurate risk quantification is high. For example, the preliminary work, computational capacity, long computational time, and the know-how of experts are required, making it very expensive to implement (Jorion, 2002; Choudhry, 2006). The LCC is now more accessible due to the significant increases in computer processing capabilities and their availability (Rahman & Vanier, 2004).
Using the MCS macro, 10,000 iterations can be run within a reasonable time, and the number of iterations is inconsequential in terms of generating stable results. The PDF for the following input values must be defined: cost of electricity to run the compressors, cost of natural gas (fuel gas) to run the compressors, and carbon dioxide certificate costs, if included in the respective case study. There are different approaches to determining the PDF. The authors’ level of knowledge regarding the historical data of costs should also be considered.
In this study, the following setup is chosen to predict future energy costs. The author’s possible knowledge of the historical data of energy costs forms its basis. Here, a graph was created of the annual costs from 2000 to the year the study was prepared. A trend line and extrapolation are generated for this graph. Figure 1 illustrates the trend line and the forecast for natural gas costs in Study 2: The study year is 2011, and historical data are available from 2000 to 2011. The forecast is assessed from 2012 to 2020.
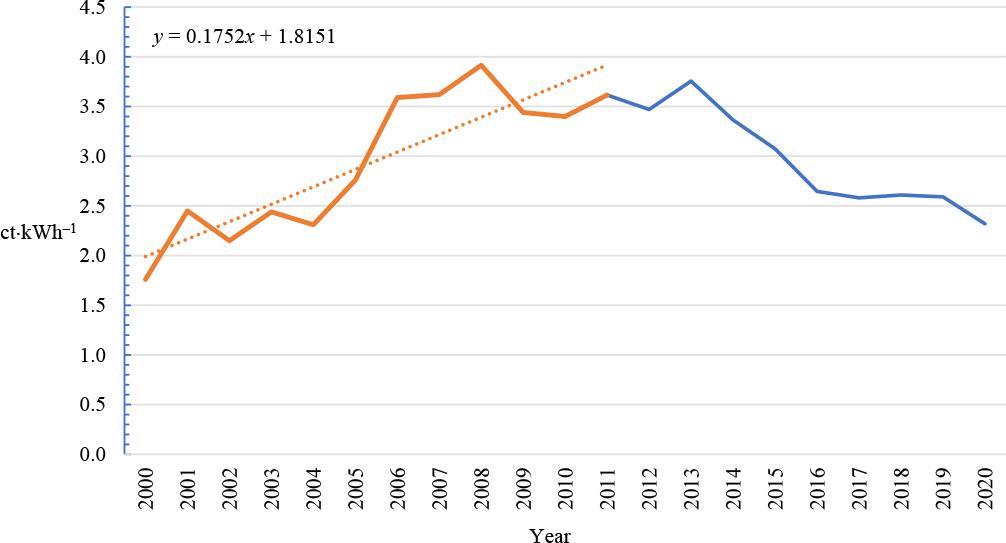
Study 2: trend line and forecast of natural gas costs (orange: author’s knowledge of historical data, blue: knowledge of historical data from the current perspective; dotted line: author’s knowledge of trend line for forecast)
Source: own work.
The beta-PERT function is selected as the PDF in the MCS software solution. For the beta-PERT function, the minimum and maximum values, and a most likely value, must be specified as the input data for the above costs. The MCS is applied to each option in each case study for assessment. This implies that all the models for calculating the DCE are re-run with probability distributions for the costs of natural gas, electricity, and carbon dioxide certificates (if included in the case study). Consequently, the following results are available for further evaluation of the DCE calculations for the options examined in the case study: DCE calculation with input data from studies, DCE calculations with real historical input data, and DCE calculations with input data generated from the probability distributions of the MCS. The DCE or the statistical distribution of the DCE is calculated. The results allow the application of descriptive statistics to quantify the associated risks.
The results of the cost models for the input data applied by the authors of the case studies (with predicted input data for energy and maintenance costs) are compared with the results calculated using real historical data. Due to space constraints, the results of the model calculations from one out of eight studies are presented in this study as an example. These results are representative of the results from the analysis of all studies. The graphs show not only a comparison between the calculations with predicted input data and real historical data, but also a sensitivity analysis for the interest rate. The results are based on the analysis of Study 2.
Study 2 (Figs 2 and 3) shows that the use of real historical data leads to a clear ranking of the options. Using the input data for the study, the two variants are indistinguishable in terms of DCE; with real historical data, there is a clear preference for one option. In the other studies, the ranking of the options remained unchanged, but the distances between the options change. The DCEs are higher with real historical data in some studies, which can influence the decision of whether to invest at all. Some studies show that the ranking changes with the calculation of real historical data. The DCE of an option decreases and receives a higher preference. This recalculation can influence decisions in favor of one or the other option.
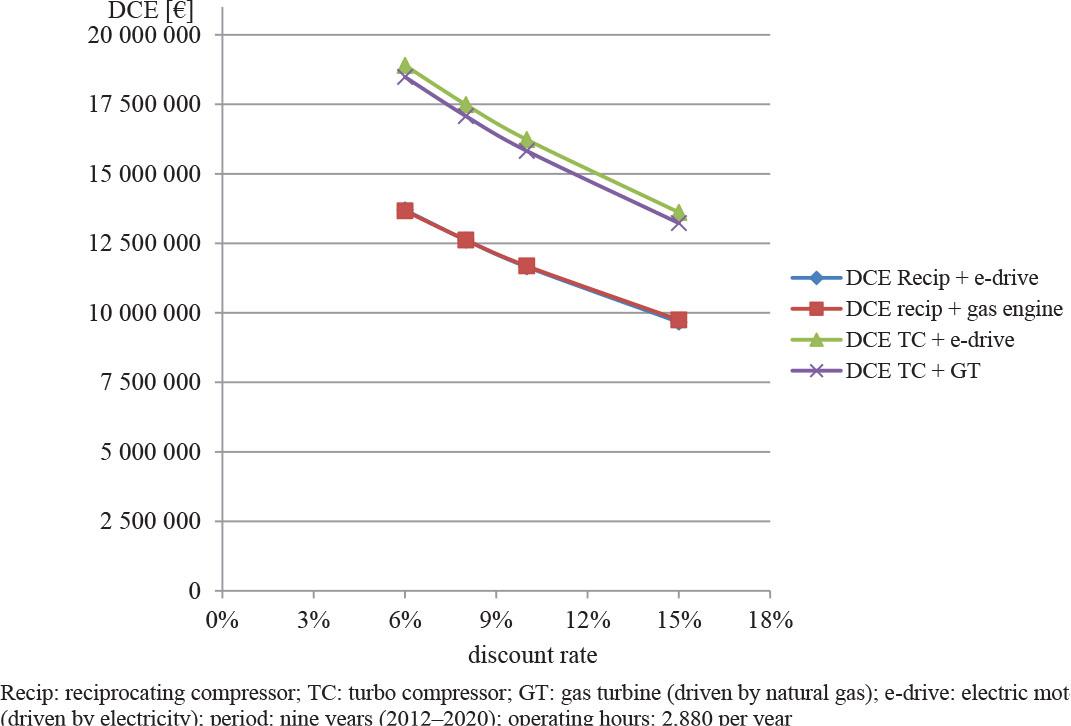
Study 2: discounted cumulated expenditure versus discount rate, calculation with authors’ input data
Source: own work.
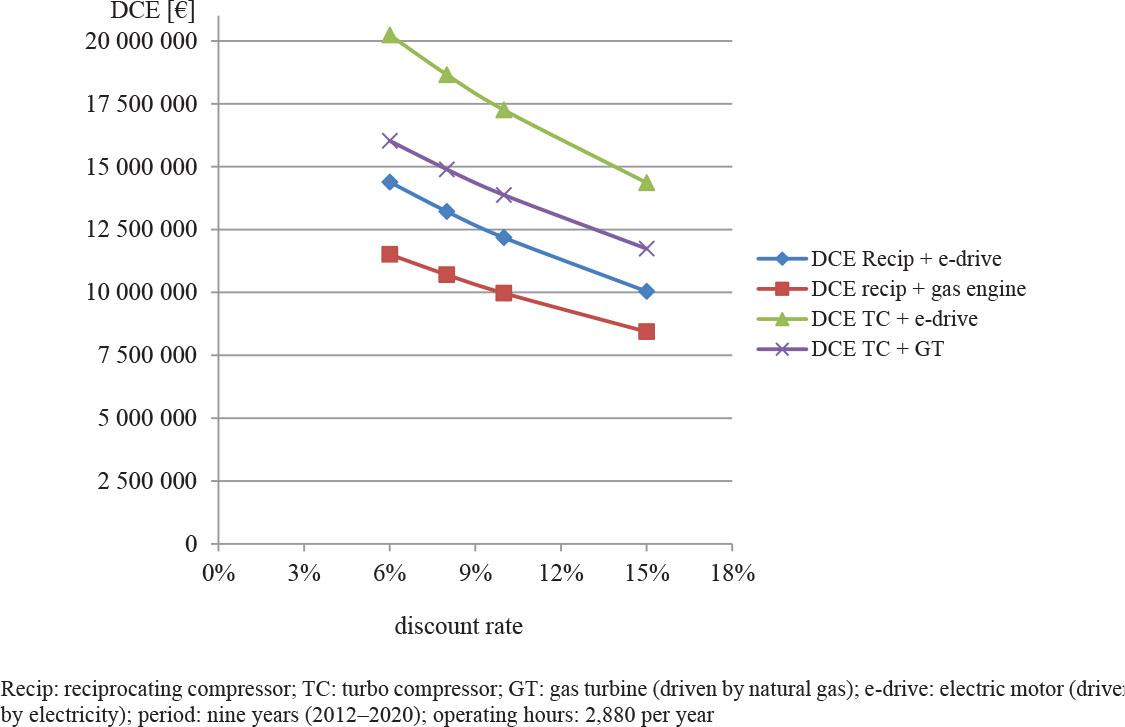
Study 2: discounted cumulated expenditure versus discount rate, calculation with real (historical) input data
Source: own work.
The following figures show the results of using MCS for Study 2. The DCEs are recalculated using MCS. The relevant figures for Study 2 are:
- –
calculation of DCE with input data and real historical data (Figs 2 and 3),
- –
calculations of DCE with input data generated from probability distributions of the MCS based on real historical data (Fig. 4).
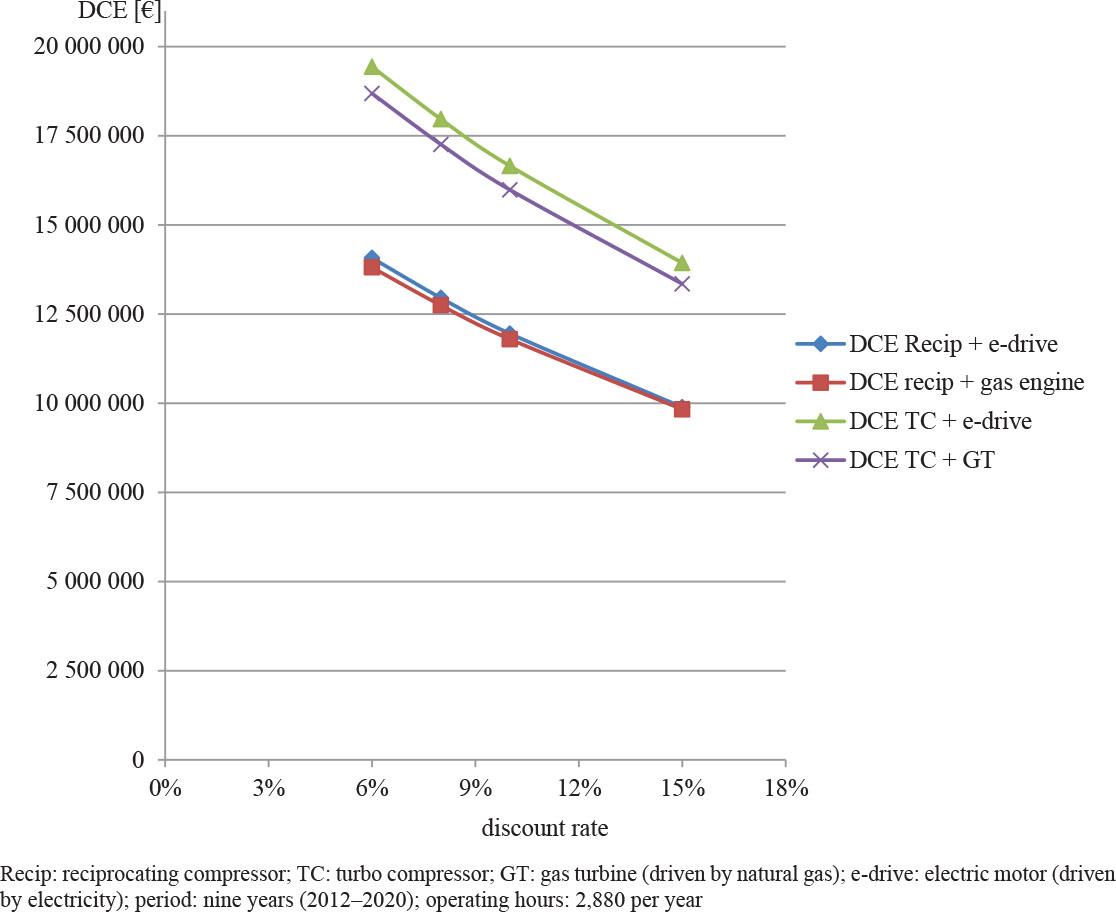
Study 2: Results of Monte Carlo simulation calculation with real historical data
Source: own work.
A comparison of the figures for Study 2 shows that using the MCS does not necessarily improve the results of the DCE calculation. Calculations with real historical input data would be expected to match the calculations using data generated from the MCS. However, this is not the case, as the future development of input data cannot be predicted with certainty using MCS. In any case, MCS has an advantage in that the calculated results can be evaluated using descriptive statistics. Descriptive statistics are applied to the probability distributions of the results to generate statistical statements regarding the reliability of the results. The MCS makes it possible to calculate the mean and median values, standard deviations, and confidence levels. Figures 5 and 6 are a sample for Study 2.
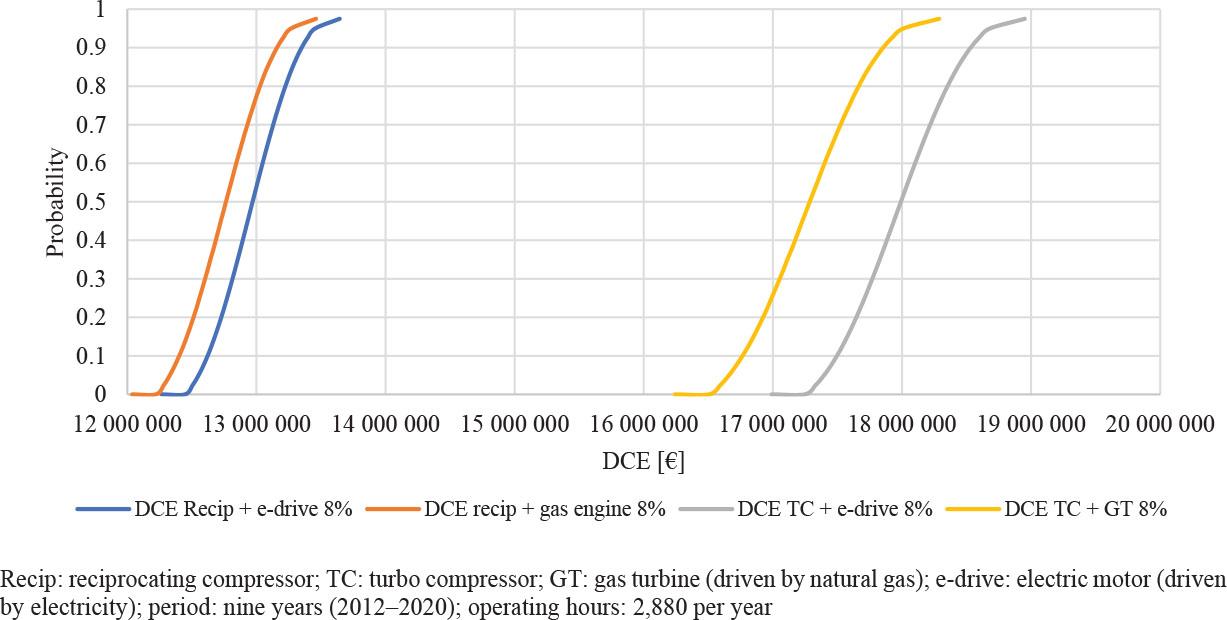
Study 2: cumulative probability for discount rate of 8%
Source: own work.
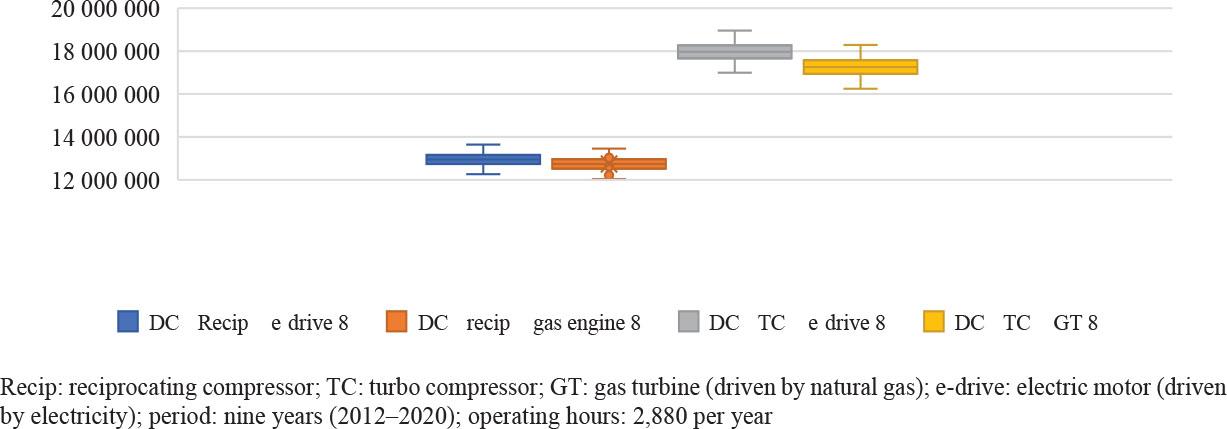
Study 2: box plot for discount rate of 8%
Source: own work.
Decisions regarding investments in compressor stations in Germany’s natural gas infrastructure are based on LCC analysis, as described in EN ISO 15663, and this involves a comparison of different options, which must all meet investment requirements. Experts from consulting firms perform seven case studies, and TSO experts review them. These seven studies formed the basis for decision-making on investments in natural gas infrastructure. Moreover, these case studies represent expert opinions, from both the consulting firms and TSOs. The analysis of these seven executed case studies shows that the results of an LCC analysis depend on the input data and the estimate of future development.
As part of the assessment, the models were replicated, and the calculations were repeated using real historical values. A comparison of the results calculated using the authors’ data and real historical data shows that changes in the NPV (or DCE) lead, in part, to a change in the ranking of the options. These results clarify that decision-makers require additional measures to validate the results of the case studies and mitigate risks.
The comparison of the results of the DCE-calculations with data from the authors and real historical data shows the discrepancies clearly. The calculation with real, from today’s perspective, historical values for energy costs leads to divergent results in the determination of the preferred option. The prediction of energy costs is associated with uncertainties and risks. The MCS is a probabilistic method to address uncertainties and risks. To secure the results of the case studies, MCS is used to recalculate the input data and its future development in the executed case studies. A comparison of the results from calculations with real historical data and calculations with MCS data also shows deviations in the results. This makes it clear that using MCS to establish more reliable input data is limited.
The MCS improves risk mitigation not through more reliable input data but by providing statistical data of the output. The MCS results are the PDF of the DCE, thus making it accessible to descriptive statistics. The probabilities can be analyzed graphically and in box plots. Standard deviations, confidence levels (95%), mean/median values, and other relevant numbers are provided with the MCS. This makes the results of the LCC analysis quantifiable and reduces the risk in the decision-making process.
The MCS is not used in the seven studies examined. Although MCS is a recognized method and limitations in computing are no longer a problem, it is rarely used in the German natural gas infrastructure. Furthermore, the results can be transferred from natural gas infrastructure to other areas where LCC analysis with OPEX comprising energy, maintenance, or other costs can be applied.
To improve the validation of the case study results, other measures, such as deterministic methods using sensitivity analysis, are suggested. Sensitivity analysis makes it possible to identify the impact of major cost drivers on the results. In addition, a company’s success increasingly depends on social acceptance. Therefore, aside from economic requirements, decision-makers at sustainable companies can also consider social and ecological requirements to determine an investment. With the help of a weighted scoring method, these aspects can be incorporated into the decision-making process of a sustainability assessment. Thus, the LCC should be supplemented by a sustainability assessment.