

Airborne particles smaller than 2.5 μm in diameter (PM2.5), known as fine particles, are among the most harmful air pollutants globally with substantial effects on human health. These small particles can penetrate extremely deep into pulmonary alveoli and result in extensive respiratory disease and premature death. Traffic is heavy in industrial zones, such as the pollution control zone of Rayong Province in Thailand and biomass burning is common; therefore, PM2.5 pollution is an important and long-term public health issue. Exposure to PM2.5 causes millions of deaths annually and disproportionately affects the populations of low- and middle-income countries (World Health Organization [WHO], 2021). Thailand’s industrial provinces also contain high concentrations of PM2.5 that exceed surpass the WHO guideline annual average of 15 µg·m−3, highlighting the need for further research to better understand associated health effec ts and provide a basis for policy action (Kanchanasuta et al., 2020). This research focuses on the pollution control zone of Rayong Province, a major industrial cluster, to study how exposure to PM2.5 relates to respiratory outcomes of health.
There has been considerable epidemiological research on the impact of PM2.5 and lung health in recent years. Various studies have repeatedly shown that exposure to PM2.5 is associated with an elevated risk of asthma, bronchitis, and other respiratory complications, especially in urban-industrial settings (Choo et al., 2023; Zhu et al., 2023). In Southeast Asia, industrial pollution and seasonal biomass burning have been identified as the predominant sources of elevated levels of PM2.5, and short-term exposure has been linked with higher rates of hospital admissions due to respiratory illnesses (Phosri et al., 2019; Amnuaylojaroen et al., 2020). Time-lag analyses have revealed that PM2.5 exposure can have immediate or delayed adverse health effects, with vulnerable subgroups such as the elderly and children being especially affected (Kim et al., 2012; Chantaraprachoom et al., 2024). These findings underscore the importance of regional analysis in order to better characterize local patterns of pollution and their associated health effects.
The literature suggests that the health impacts of PM2.5 differ based on exposure duration, concentration levels, and population vulnerability. Research in Thailand suggests that industrial estates, such as Rayong, have higher levels of PM2.5 than areas such as Bangkok, but data on the short-term adverse effects of PM2.5 exposure in industrial environment remain limited (Vichit-Vadakan et al., 2008; Cheanklin et al., 2012). The “harvesting effect,” whereby PM2.5 exposure can cause morbidity in susceptible persons, has been observed in many studies illustrating the complex temporal patterns of exposure–response relationships (Anggraeni & Lestari, 2023; Suwanprapha et al., 2024). These gaps highlight the importance of local research that combines air quality and health information to assess the short-term impact of PM2.5 exposure on respiratory morbidity in industrial environments (Pothirat et al., 2016; Muenmee & Bootdee, 2021). Despite the growing body of international and national evidence regarding the health effects of PM2.5 exposure, limited empirical research has specifically examined short-term temporal associations in designated industrial pollution control zones in Thailand. In particular, there remains insufficient integration of multi-station air quality monitoring data with hospital-based morbidity records at the provincial level. Therefore, this study aims to address this gap by systematically analyzing daily PM2.5 concentrations and respiratory disease outcomes within the pollution control zone of Rayong Province using time-lag correlation analysis.
The objective of this research is to evaluate trends in PM2.5 levels and respiratory disease morbidity in the pollution control zone of Rayong Province between 2020 and 2023. The study will investigate short-term associations between daily concentrations of PM2.5 and respiratory diseases using time-lag analysis to explore immediate and delayed health outcomes. By integrating air pollution data from monitoring stations with hospital admission data, this article provides empirical evidence to support strategic air quality management and public health interventions in industrial areas.
This study employed a retrospective analytical design based on secondary data obtained from air quality monitoring stations and hospital patient record systems.
A geographical map illustrating the spatial distribution of air quality monitoring stations within the pollution control zone of Rayong Province is presented in Figure 1. The map provides context for understanding station locations in relation to industrial estates, residential zones, and transportation corridors.
A descriptive summary of each monitoring station, including land-use classification and proximity to major emission sources, is provided in Table 1. These additional details facilitate the interpretation of inter-station variability in PM2.5 concentrations and allow for the assessment of potential location-specific influences.
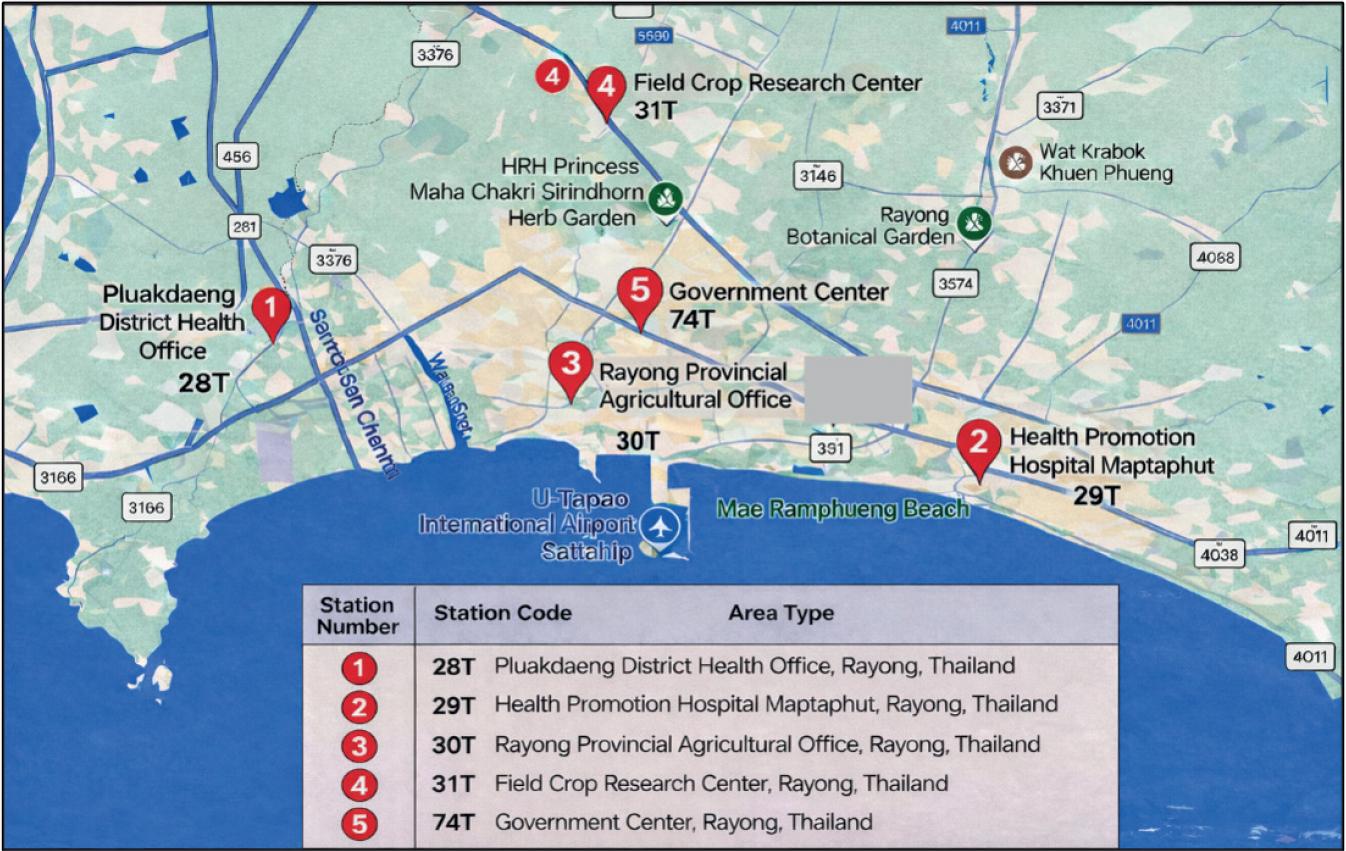
Geographic distribution of PM2.5 monitoring stations and the hospital catchment area within the pollution control zone of Rayong Province
Source: own work.
Characteristics of PM2.5 monitoring stations included in the study
| Station code | Monitoring site | Nearby sources |
|---|---|---|
| 28T | Pluakdaeng District Health Office, Rayong, Thailand | industrial estate, port activities |
| 29T | Health Promotion Hospital Maptaphut, Rayong, Thailand | petrochemical complex, traffic |
| 30T | Rayong Provincial Agricultural Office, Rayong, Thailand | traffic, mixed land use |
| 31T | Field Crop Research Center, Rayong, Thailand | agricultural activities, open areas |
| 74T | Government Center, Rayong, Thailand | residential traffic, commercial area |
Source: own work.
PM2.5 concentrations from fixed-site monitoring stations were used as proxies for ambient population-level exposure within the pollution control zone. These stations were assumed to reflect general air quality conditions across the hospital catchment area; however, spatial variability in pollutant distribution may result in exposure misclassification at the individual level.
The study did not include geocoded residential data; therefore, precise distances between individual patient residences and monitoring stations could not be calculated. Exposure was assigned at the ecological level rather than the individual level. Daily PM2.5 concentrations were analyzed separately for each monitoring station to explore spatial heterogeneity. In addition, an area-level average concentration across all five stations was calculated to represent general ambient exposure within the pollution control zone of Rayong Province. The monitoring stations are located approximately 3–18 km from the hospital catchment area.
Health data were obtained from Her Royal Highness Princess Maha Chakri Sirindhorn Memorial Hospital, which functions as a major tertiary care facility serving the Pollution Control Zone of Rayong Province. The hospital receives referrals for moderate to severe respiratory conditions from surrounding districts within the study area.
Although additional primary healthcare units operate in the region, inpatient respiratory admissions are predominantly managed at this center. Therefore, the hospitalization data are considered broadly representative of respiratory morbidity patterns within the study population.
The study utilized both daily-level and monthly aggregated datasets. Daily PM2.5 concentrations and daily respiratory case counts were used for the short-term time-lag assessment. In parallel, monthly averages and monthly aggregated case counts were constructed for ecological correlation analysis across the study period.
The study utilized both daily-level and monthly aggregated datasets. Daily PM2.5 concentrations and daily respiratory case counts were used to evaluate shortterm exposure–response relationships and time-lag associations. Monthly averages and aggregated case counts were additionally constructed to examine broader ecological temporal patterns across the study period.
Lag analysis was performed to explore temporal displacement patterns between PM2.5 concentrations and respiratory morbidity within the aggregated monthly framework. These lag estimates do not represent true daily distributed lag effects but rather relative shifts in temporal association.
Daily 24-hour PM2.5 concentrations were collected from five air pollution monitoring stations within the Rayong pollution control area, including Stations 28T, 29T, 30T, 31T, and 74T. The data were collected from January 1, 2017, to December 31, 2023, and were expressed as concentrations in micrograms per cubic meter [µg·m−3].
Health information on outpatients and inpatients was collected from Her Royal Highness Princess Maha Chakri Sirindhorn Memorial Hospital Siam Grand Palace, Rayong. It covered only patients with respiratory and air pollution diseases, as classified by the International Statistical Classification of Diseases and Related Health Problems 10th revision (ICD-10) codes J00-J99. Seven respiratory disease categories were selected based on their clinical relevance and prior epidemiological evidence indicating sensitivity to air pollution exposure. These conditions represent a combination of acute inflammatory diseases (e.g., pneumonia, bronchitis) and chronic respiratory disorders (e.g., asthma, COPD) that are commonly reported in regional health surveillance data. Other ICD-10 codes within J00-J99 were not included due to low case frequency or limited evidence of short-term air pollution sensitivity. The examination focused on seven general categories of diseases: (1) COPD, (2) asthma, (3) pneumonia, (4) influenza, (5) acute pharyngitis, (6) chronic rhinitis, and (7) bronchitis.
Monthly average PM2.5 concentrations and monthly aggregated counts of respiratory disease cases were used in the analysis. This ecological design, based on monthly temporal resolution, limits the ability to evaluate short-term daily lag effects and should be interpreted accordingly.
Although air quality monitoring data were available from 2017 onward, complete and standardized hospital admission records were consistently accessible only from 2020. To ensure data completeness and comparability, the analytical period was therefore restricted to 2020–2023.
Descriptive statistics were calculated to summarize air pollution levels and respiratory morbidity.
Daily-level time-series assessment. Daily 24-hour PM2.5 concentrations and daily counts of respiratory disease cases were analyzed to examine short-term exposure–response relationships. The Spearman rank correlation coefficient was applied due to the non-normal distribution of the data.
Time-lag analyses were conducted for lag days 0–7 to explore delayed associations following exposure. These analyses represent unadjusted exploratory correlations and do not constitute causal time-series modeling. The daily-level dataset included approximately 1,461 observations (January 2020–December 2023). Days with incomplete PM2.5 or hospital records were excluded from the daily-level correlation analyses. No imputation was performed. All statistical tests were two-tailed, and statistical significance was defined as p < 0.05.
Daily PM2.5 concentrations were calculated as the average of the five fixed monitoring stations to represent population-level exposure within the study area. Both daily-level and monthly-level analyses were conducted to examine short-term exposure–response relationships as well as broader ecological temporal patterns.
Monthly-level ecological correlation. Monthly average PM2.5 concentrations and monthly aggregated respiratory case counts were analyzed to assess broader ecological co-variation patterns. Spearman rank correlation coefficient was used to evaluate associations between each monitoring station and each respiratory disease category at the monthly level (N ≈ 48 months). All analyses were performed using IBM SPSS Statistics, version 26.0.
This research received ethical approval from the Research Ethics Review Committee, Rajamangala University of Technology Tawan-ok (RMUTTO REC Reference No. 033/2024) on July 15, 2024, based on the ethical guidelines described in the Declaration of Helsinki and Guidelines on Good Clinical Practice (ICH-GCP). No individual data was collected, and patient identifiers were anonymized to the extent possible. The analysis used aggregated data.
The trend analysis revealed an overall increase in PM2.5 levels across Rayong’s pollution control areas during the study period, as shown in Table 2, Figures 2 and 3. The mean overall concentration from all monitoring points rose from 18.19 µg·m−3 in 2020 to 20.55 µg·m−3 in 2023, representing a 13% increase. Station 29T recorded the highest mean PM2.5 concentration at 19.42 µg·m−3 while Station 74T recorded the lowest concentration at 18.33 µg·m−3. The highest value was 21.93 μg·m−3, recorded at Station 29T in 2023. Although these values were still within Thailand’s national air quality standard of 50 µg·m−3, they were above WHO guideline value of 15 µg·m−3 by about 37%. The ongoing rise in PM2.5 concentrations, especially at Station 29T and Station 31T, emphasizes the necessity of ongoing monitoring and action towards safeguarding public health in Rayong’s industrial estates.
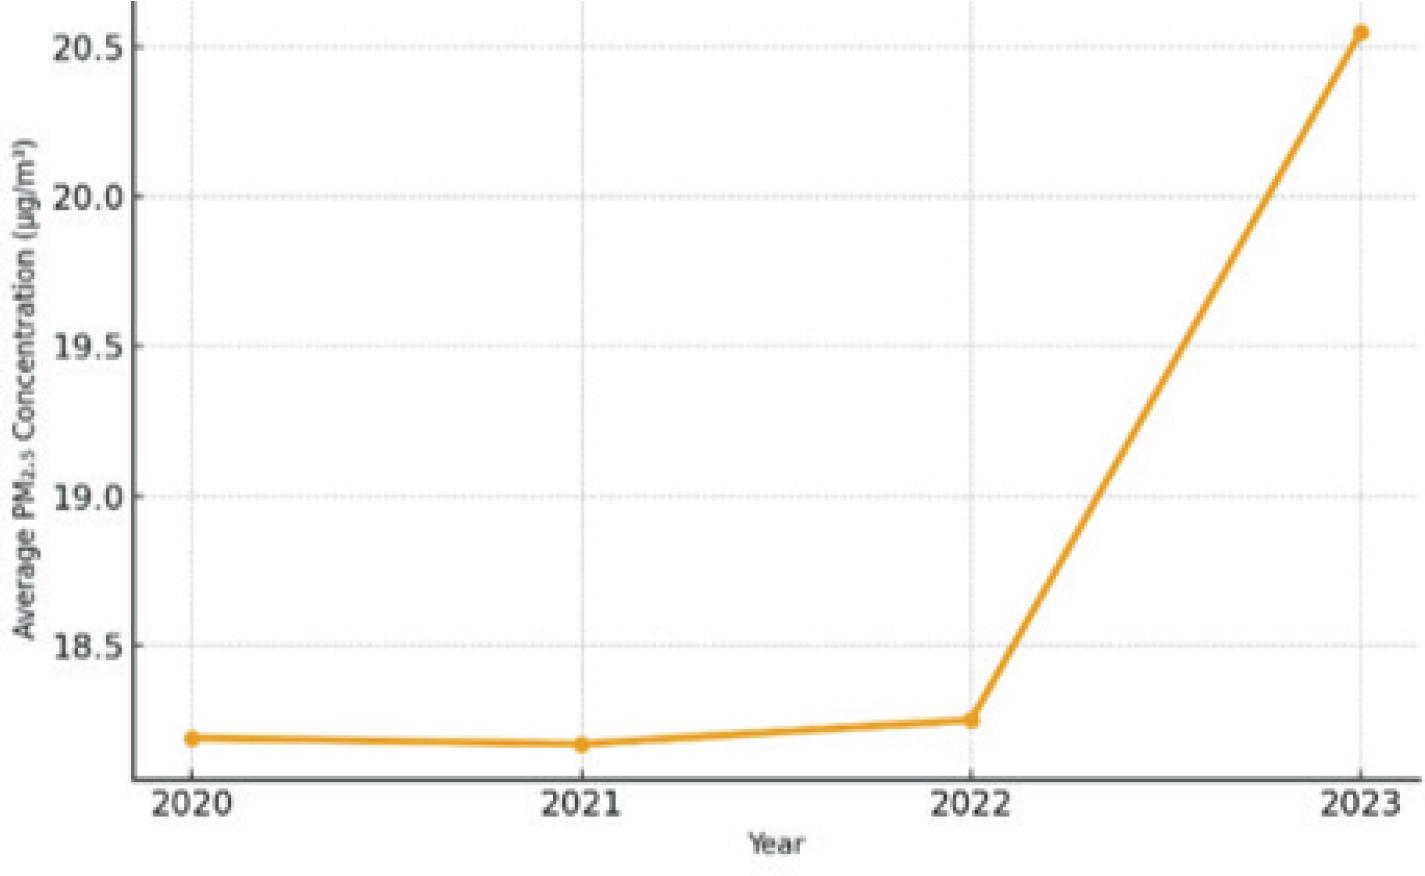
Annual trend of average PM2.5 concentrations from all monitoring stations at the pollution control zone of Rayong Province in Thailand during 2020–2023
Source: own work.
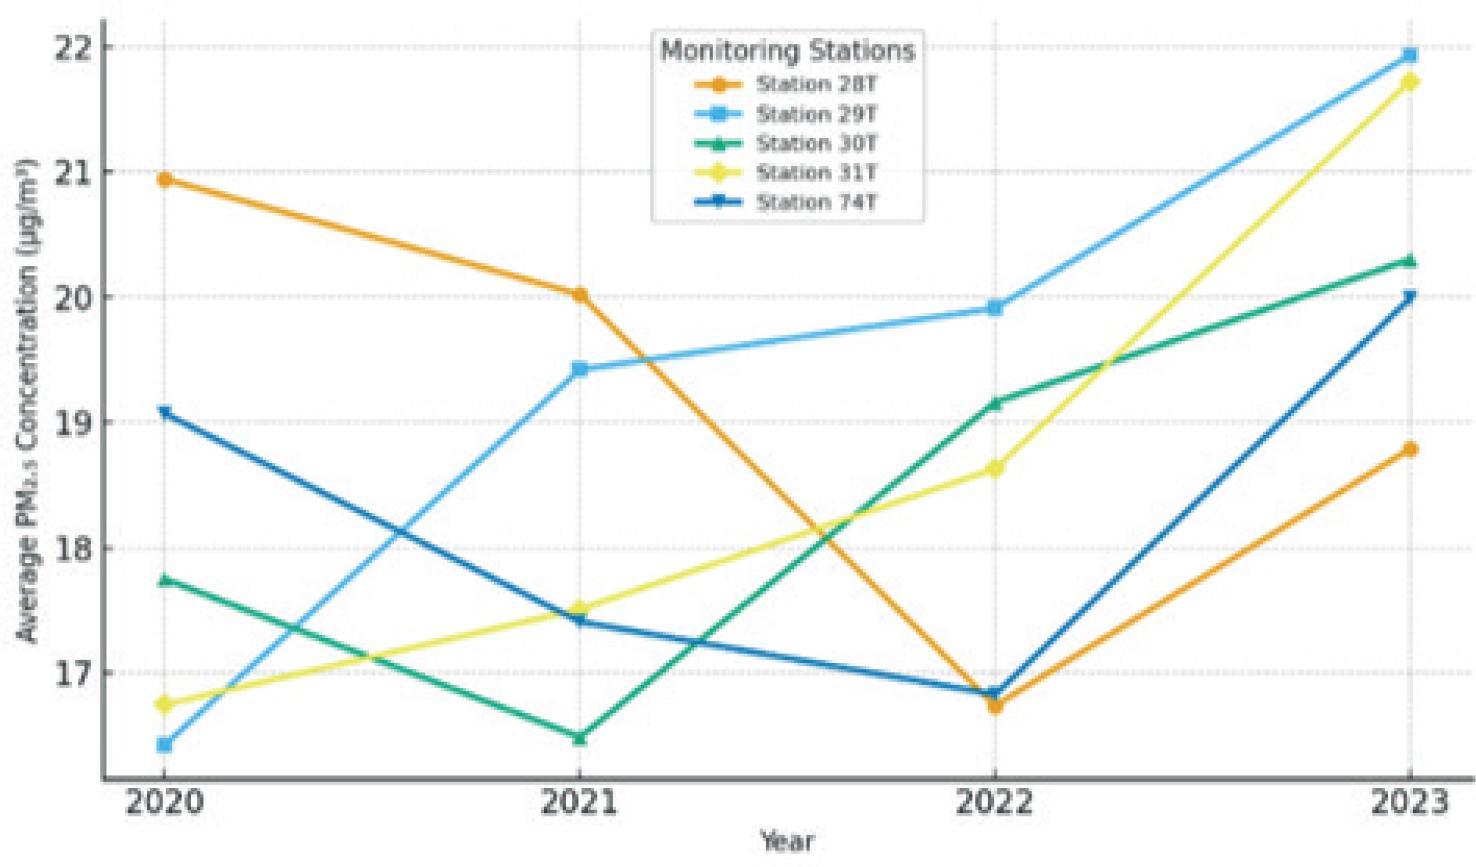
Temporal variation in PM2.5 concentrations by station during 2020-2023
Source: own work.
Average concentrations of PM2.5 by monitoring station and year at the pollution control zone of Rayong Province in Thailand during 2020–2023 [μg·m−3]
| Year | Station | Mean (all stations) | Max | Min | ||||
|---|---|---|---|---|---|---|---|---|
| 28T | 29T | 30T | 31T | 74T | ||||
| 2020 | 20.94 | 16.43 | 17.75 | 16.75 | 19.07 | 18.19 | 20.94 | 16.43 |
| 2021 | 20.02 | 19.42 | 16.49 | 17.51 | 17.41 | 18.17 | 20.02 | 16.49 |
| 2022 | 16.74 | 19.91 | 19.16 | 18.63 | 16.83 | 18.25 | 19.91 | 16.74 |
| 2023 | 18.79 | 21.93 | 20.30 | 21.72 | 19.99 | 20.55 | 21.93 | 18.79 |
| Average | 19.12 | 19.92 | 18.43 | 18.65 | 18.33 | 18.89 | 21.93 | 16.43 |
Source: own work.
As shown in Table 3, respiratory disease trends are summarized numerically through annual case counts across disease categories.
Number of patients with respiratory diseases by category and year at the pollution control zone of Rayong Province in Thailand during 2020–2023
| Disease | 2020 | 2021 | 2022 | 2023 | Total (4 years) | Mean (1 year) | Max | Min |
|---|---|---|---|---|---|---|---|---|
| Chronic obstructive pulmonary disease (COPD) | 722 | 566 | 704 | 688 | 2,680 | 670.0 | 722 | 566 |
| Asthma | 1,384 | 1,222 | 1,360 | 1,784 | 5,750 | 1,437.5 | 1,784 | 1,222 |
| Pneumonia | 707 | 413 | 571 | 1,127 | 2,818 | 704.5 | 1,127 | 413 |
| Influenza | 274 | 6 | 194 | 2,530 | 3,004 | 751.0 | 2,530 | 6 |
| Acute pharyngitis | 1,255 | 578 | 1,554 | 2,235 | 5,622 | 1,405.5 | 2,235 | 578 |
| Chronic rhinitis | 31 | 27 | 21 | 22 | 101 | 25.3 | 31 | 21 |
| Bronchitis | 1,141 | 367 | 706 | 1,090 | 3,304 | 826.0 | 1,141 | 367 |
| All diseases combined | 5,514 | 3,179 | 5,110 | 9,476 | 23,279 | 5,819.8 | – | – |
Source: own work.
As presented in Table 4 and Figure 4, the correlation analysis revealed significant positive correlations between PM2.5 concentrations and three respiratory diseases. Pneumonia incidence showed a strong positive correlation with PM2.5 at Station 31T (r = 0.276, p < 0.05). (2) Bronchitis was also highly correlated with same-day PM2.5 levels at Station 74T (r = 0.276, p < 0.05), whereas significant positive correlations were observed at Station 28T (lag 4: r = –0.419, p < 0.01) and Station 29T (lag 4: r = –0.331, p < 0.05). (3) Asthma also showed a positive correlation with PM2.5 concentration at Station 31T at a lag of 1 day (lag 1: r = 0.283, p < 0.05).
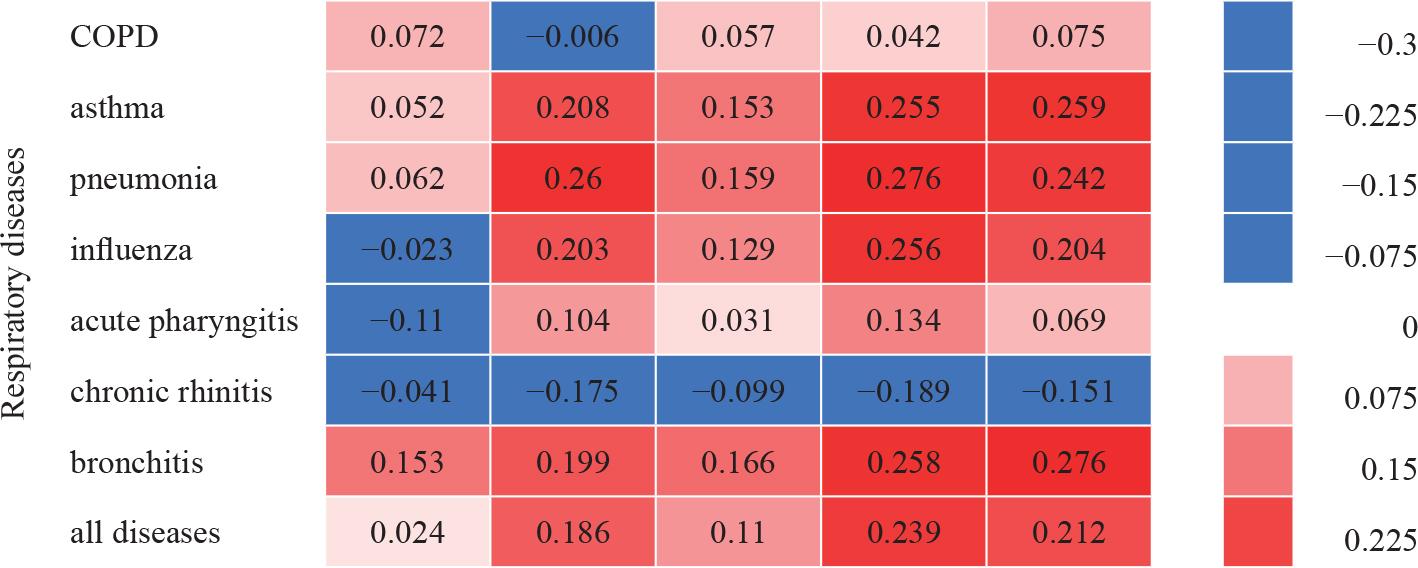
Correlation matrix illustrating relationships between PM2.5 concentrations and respiratory disease categories across monitoring stations. All correlation coefficients are numerically presented in Table 4
Source: own work.
Spearman correlation coefficients (r) between PM2.5 concentrations and respiratory diseases by monitoring station at the pollution control zone of Rayong Province in Thailand during 2020–2023
| Disease | Station | Mean (r) | ||||
|---|---|---|---|---|---|---|
| 28T | 29T | 30T | 31T | 74T | ||
| Chronic obstructive pulmonary disease (COPD) | 0.072 | –0.006 | 0.057 | 0.042 | 0.075 | 0.062 |
| Asthma | 0.052 | 0.208 | 0.153 | 0.255 | 0.259 | 0.206 |
| Pneumonia | 0.062 | 0.260 | 0.159 | 0.276* | 0.242 | 0.223 |
| Influenza | –0.023 | 0.203 | 0.129 | 0.256 | 0.204 | 0.170 |
| Acute pharyngitis | –0.110 | 0.104 | 0.031 | 0.134 | 0.069 | 0.051 |
| Chronic rhinitis | –0.041 | –0.175 | –0.099 | –0.189 | –0.151 | –0.153 |
| Bronchitis | 0.153 | 0.199 | 0.166 | 0.258 | 0.276* | 0.232 |
| All diseases combined | 0.024 | 0.186 | 0.110 | 0.239 | 0.212 | 0.169 |
Spearman rank correlation coefficients were calculated based on monthly aggregated data (N = 45–52 months depending on data completeness;
p < 0.05). Values represent contemporaneous monthly associations. No lag structure was applied at the monthly level.
Source: own work.
Negative correlations were observed at lags 3–5 at certain stations, suggesting that acute exposure to elevated levels of PM2.5 may result in increased respiratory morbidity among susceptible populations initially, followed by a subsequent reduction in morbidity as the susceptible population is diminished. There were no statistically significant correlations for the remaining categories of respiratory illness investigated in this research.
Correlation analysis revealed varying degrees of association between PM2.5 concentrations and respiratory disease incidence across monitoring stations. Significant positive correlations were identified at Stations 31T and 74T (r = 0.276, p = 0.012), while weaker or non-significant associations were observed at other stations. However, the magnitude of the correlation was modest (r < 0.30), explaining less than 10% of the variance.
As shown in Table 5 and Figure 5, a weak but statistically significant positive correlation was observed between PM2.5 concentration and bronchitis cases at Station 74T on the same day (r = 0.276, p = 0.048).
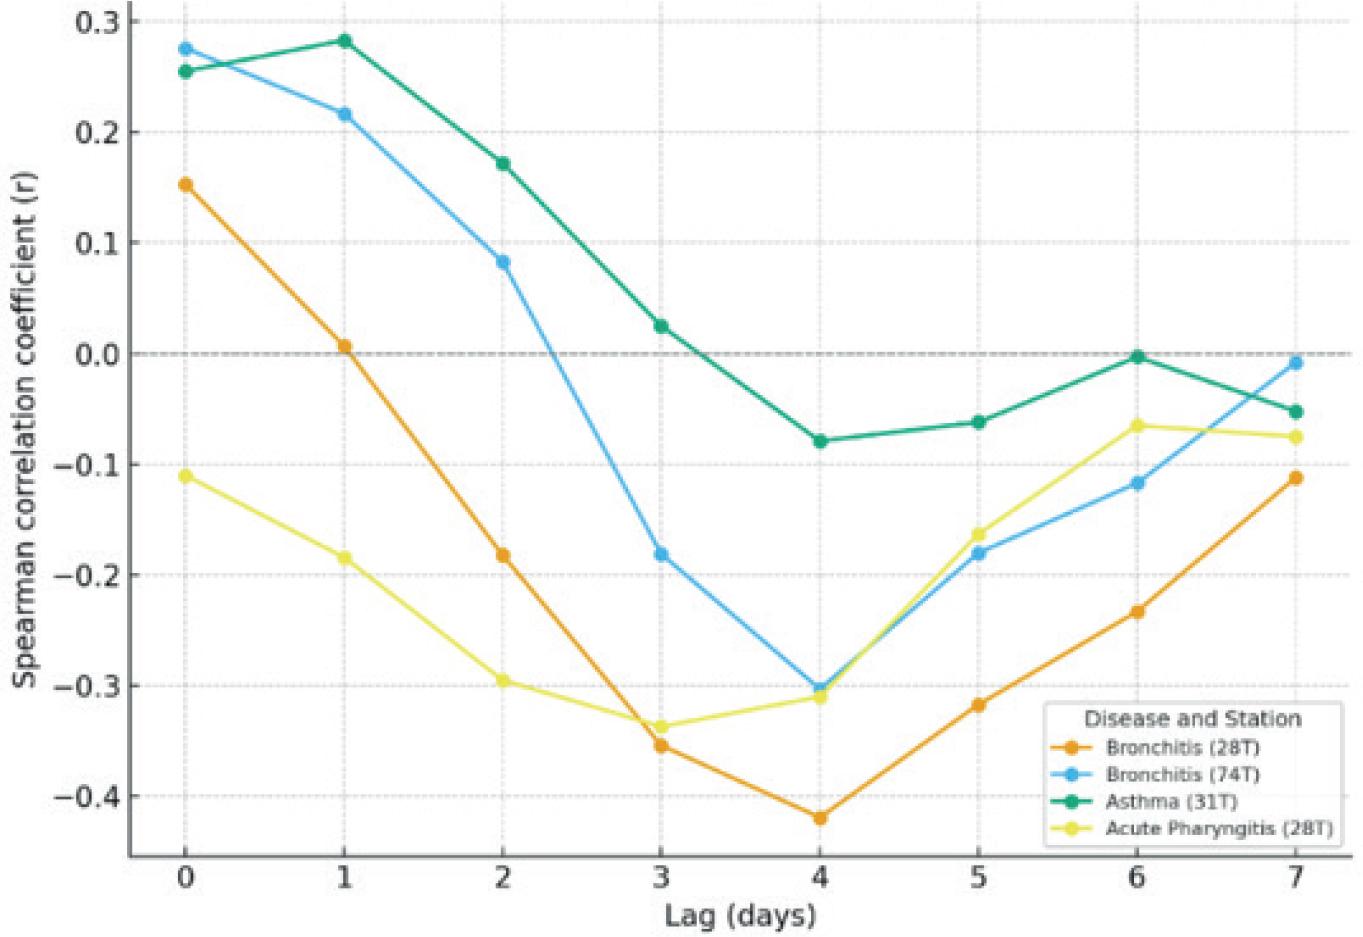
The Spearman correlation analysis between PM2.5 exposure and selected respiratory diseases
Source: own work.
Statistically significant Spearman correlations (r) between daily PM2.5 concentrations and respiratory diseases across lag periods (0–7 days) at pollution control zone of Rayong Province in Thailand during 2020–2023 (approximately 1,461 daily observations)
| Disease | Station | lag | r | Significance |
|---|---|---|---|---|
| Chronic obstructive pulmonary disease (COPD) | 28T | lag 7 | –0.296 | * |
| Asthma | 28T | lag 4 | –0.304 | * |
| Asthma | 31T | lag 1 | 0.283 | * |
| Acute pharyngitis | 28T | lag 2 | –0.295 | * |
| Acute pharyngitis | 28T | lag 3 | –0.337 | * |
| Acute pharyngitis | 28T | lag 4 | –0.310 | * |
| Bronchitis | 28T | lag 3 | –0.354 | * |
| Bronchitis | 28T | lag 5 | –0.317 | * |
| Bronchitis | 28T | lag 4 | –0.419 | ** |
| Bronchitis | 29T | lag 4 | –0.331 | * |
| Bronchitis | 29T | lag 5 | –0.296 | * |
| Bronchitis | 74T | lag 0 | 0.276 | * |
| Bronchitis | 74T | lag 4 | –0.303 | * |
| All diseases combined | 28T | lag 3 | –0.333 | * |
| All diseases combined | 28T | lag 4 | –0.349 | * |
p < 0.05;
p < 0.01.
Source: own work.
This finding suggests a modest temporal association between elevated ambient PM2.5 levels and increased bronchitis visits. In contrast, negative correlations were observed at lag days 3–5 at Stations 28T and 29T, indicating possible short-term displacement patterns. Although the magnitude of the association was small, the same-day pattern is consistent with the hypothesis that short-term increases in PM2.5 may contribute to acute bronchial irritation, particularly among susceptible populations such as children, older adults, and individuals with pre-existing respiratory conditions.
As Table 5 and Figure 5 illustrate, various respiratory illnesses were negatively correlated with PM2.5 concentrations at lag times ranging from 3 to 5 days, which may suggest a possible harvesting effect. Of particular note, bronchitis at Station 28T (lag 4: r = –0.419, p < 0.01) and pharyngitis at Station 28T (lag 3: r = –0.337, p < 0.05) exhibited strong negative correlations. In contrast, pollution may trigger acute illness among susceptible individuals shortly after safe pollution levels peak. This may subsequently reduce the number of susceptible individuals in the short term, contributing to the decline in case numbers after the initial increase. This temporal pattern is consistent with the air pollution-morbidity research using time series analyses. Past investigations have confirmed that such patterns of pollution-related health effects are plausible.
As shown in Table 5 and Figure 5, the correlations varied significantly across monitoring stations. Station 74T showed the strongest immediate effect (r = 0.276, p < 0.05) while Stations 28T and 29T displayed distinct negative lagged correlations, suggesting a possible harvesting effect. However, no statistically significant correlations were observed for data collected at Station 30T and Station 31T. These spatial variations may reflect differences in the structure and origin of PM2.5. Some of these differences may be attributable to combustion sources, motor vehicle exhaust, and local site characteristics.
As shown in Table 5, no significant correlations were identified for chronic rhinitis or influenza across all stations. This finding is consistent with the understanding that these diseases are primarily caused by viral or bacterial infections rather than direct particulate exposure. Nonetheless, PM2.5 may act as a co-factor that exacerbates symptoms or increases susceptibility in individuals with underlying conditions, warranting further investigation in future epidemiological studies.
Short-term elevations in PM2.5 in the pollution control zone of Rayong Province in Thailand were associated with increased respiratory morbidity, with the strongest signals observed for bronchitis (lag 0) and asthma (lag 1), and indications of harvesting at lags of 3–5 days. Significant positive correlations were observed for bronchitis (r = 0.276, p < 0.05) and asthma (r = 0.283, p < 0.05), with lag effects detected up to three days following exposure. Even where concentrations remained below the Thai standard, exceedance of the WHO guideline suggests that “moderate” pollution can still trigger clinically relevant events. Public health actions should include continuous monitoring, rapid risk communication, and targeted protection of susceptible groups, alongside emission controls tailored to industrial source profiles. Methodologically, future studies should adopt distributed lag (non-linear) and small-area designs and incorporate co-pollutants, meteorology, and chemical speciation to refine exposure–response estimates and causal interpretation.
This study provides exploratory evidence of a short-term temporal association between fine particulate matter (PM2.5) and respiratory diseases in Rayong Province, an industrialized area of Thailand designated as a pollution control zone. The results indicated that elevated PM2.5 concentrations were weak but significantly correlated with increased bronchitis and asthma cases on the same day and the following day. Negative correlations observed at lags of three to five days may reflect short-term temporal displacement, sometimes described as a harvesting effect. However, given the aggregated monthly design and the absence of distributed lag time-series modeling, this interpretation remains speculative. These findings are broadly consistent with previous time-series and multi-city studies reporting associations between short-term PM2.5 exposure and respiratory hospital admissions, although differences in methodology limit direct comparability (Han et al., 2022; Wang et al., 2025).
The observed acute effects correspond to biological mechanisms reported in experimental and epidemiological literature, where PM2.5 has been associated with oxidative stress and airway inflammation in experimental and epidemiological studies, airway inflammation, and reduced lung function (Atkinson et al., 2014; Mueller et al., 2021). Moreover, the pattern of negative correlations at lags of 3–5-day, also known as the “harvesting effect,” has been widely documented in short-term mortality and morbidity studies across Asia and Europe (Gasparrini, 2022; Quijal-Zamorano et al., 2024). This phenomenon occurs when pollution events precipitate illness in vulnerable individuals, temporarily reducing the population at risk in subsequent days (Burnett et al., 2018). Spatial heterogeneity among monitoring stations in Rayong suggests differences in emission sources and pollutant composition. Stations near petrochemical complexes (e.g., Station 74T) showed stronger acute effects, whereas those near mixed residential areas exhibited delayed responses consistent with findings from industrial regions where particle composition influences toxicity (Bootdee et al., 2023). A previous Thai study also reported significant associations between PM2.5 and respiratory admissions in industrial areas of Eastern Thailand (Chatphuti & Jayathavaj, 2025), reinforcing the localized relevance of these findings. While the average PM2.5 concentrations (18–21 µg·m−3) in this study remained below the Thai 24-hour standard (50 µg·m−3), they consistently exceeded the WHO, 2021 guideline of 15 µg·m−3. Global evidence indicates that adverse health effects can occur even at low-to-moderate concentrations of PM2.5, suggesting that there is effectively no safe threshold for exposure (Health Effects Institute & Institute for Health Metrics and Evaluation [HEI & IHME], 2024; Parasin & Amnuaylojaroen, 2024). The stronger associations observed for pneumonia and bronchitis compared to COPD may reflect the acute inflammatory response triggered by short-term PM2.5 exposure, which has been shown to increase airway inflammation and susceptibility to respiratory infections (Kyung & Jeong, 2020; Han et al., 2022; Teeranoraseth et al., 2024). Acute respiratory conditions are generally more sensitive to short-term environmental fluctuations, whereas chronic diseases such as COPD may demonstrate more heterogeneous or delayed responses across monitoring stations (Atkinson et al., 2014; Zhu et al., 2023). The magnitude of the associations observed in this study was relatively small. Such modest correlations are consistent with the multifactorial nature of respiratory diseases, in which air pollution represents one of several contributing environmental factors rather than a sole determinant.
This observation is consistent with international evidence demonstrating that both chronic and acute exposure to PM2.5 are associated with increased mortality and morbidity, particularly from respiratory and cardiovascular diseases (Burnett et al., 2018). From a methodological perspective, this study employed a retrospective design utilizing Spearman correlation and lag analyses to identify short-term temporal associations. This approach is consistent with recent Thai studies that have successfully applied time-series and correlation methods to forecast pollution-related health outcomes (Li et al., 2023; Choocheep et al., 2024; Chumnicherngka et al., 2024). While this approach offers an accessible means of interpreting lagged effects, future investigations should incorporate distributed lag non-linear models (DLNMs) and Bayesian spatial frameworks to more comprehensively capture complex exposure–response relationships and spatial dependencies (Gasparrini, 2022; Quijal-Zamorano et al., 2024).
Integrating meteorological variables, co-pollutants, and source-specific emission data will further enhance the precision of exposure assessments and strengthen causal inference in future research. In the context of Thailand’s environmental health management, the results indicate a need to strengthen local air quality surveillance, integrate environmental monitoring data with hospital admission and health surveillance systems, and enforce industrial emission regulations within designated pollution control zones (Chumnicherngka et al., 2024; Tanasirirak et al., 2024). These measures align with national strategies outlined in the Ministry of Natural Resources and Environment’s Air Quality Action Plan and are reinforced by recent evidence linking PM2.5 exposure to increased mortality from non-communicable diseases across Thailand (Yan, 2023; Parasin & Amnuaylojaroen, 2024).
This study provides additional evidence supporting a short-term association between PM2.5 exposure and respiratory morbidity in an industrialized region of Thailand.
Finally, this study reinforces that short-term elevations in PM2.5 concentrations, even at moderate levels, may contribute to increased respiratory health risk, particularly among vulnerable populations. These findings emphasize the necessity of continuous air quality monitoring, stricter emission control measures, and targeted preventive health policies to mitigate the growing burden of air pollution-related diseases in industrialized regions.
Continuous air quality monitoring, early warning systems, and the integration of environmental data into public health planning are recommended to reduce respiratory health risks in industrial regions.
Future studies incorporating meteorological variables and multivariate statistical models are warranted to better clarify potential causal pathways.
In conclusion, the present study demonstrated statistically significant but modest short-term associations between ambient PM2.5 concentrations and respiratory morbidity in the pollution control zone of Rayong Province during 2020–2023. The strongest associations were observed for bronchitis on the same day of exposure and for asthma with a one-day lag, with evidence suggestive of short-term temporal displacement at lags of three to five days. Although effect sizes were small, PM2.5 concentrations consistently exceeded WHO guideline levels, indicating that even moderate pollution may contribute to measurable respiratory health impacts in industrialized settings. These findings represent exploratory ecological evidence derived directly from the study analysis and underscore the public health relevance of continued air quality monitoring and targeted prevention strategies in pollution-affected regions.
This study utilized hospitalization data from a single tertiary care hospital. While this institution serves as a major referral center in the region, the absence of data from smaller healthcare facilities may limit the complete capture of mild respiratory cases.
The absence of pre-pandemic morbidity data limits long-term comparisons of respiratory disease trends and constrains the interpretation of COVID-19-related behavioral effects within a broader historical context.
The absence of adjustment for potential confounders, including meteorological factors and co-pollutants, represents an important limitation. Seasonal patterns shared by air pollution and respiratory diseases may partially explain the observed correlations. Future research should apply time-series regression models or DLNMs to better isolate the independent short-term effects of PM2.5 exposure.
The use of monthly aggregated data substantially reduces temporal resolution and limits the ability to evaluate true short-term daily exposure–response relationships. Daily-level time-series analyses would provide greater statistical power and conceptual consistency for distributed lag assessment. Therefore, the current findings should be interpreted as exploratory ecological associations rather than definitive short-term causal effects.
The use of fixed monitoring stations as exposure proxies and the absence of residential-level linkage may introduce exposure misclassification, potentially attenuating observed associations.
The analysis combined outpatient and inpatient visits within each diagnostic category. Differences in disease severity and healthcare utilization patterns may influence sensitivity to air pollution exposure. This aggregation could potentially dilute effect estimates, and future studies should consider stratified analyses by care setting.