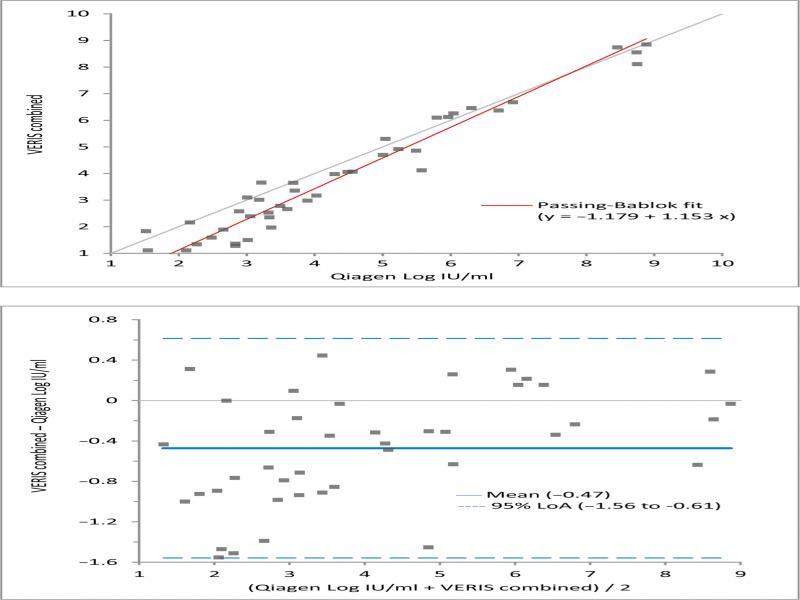
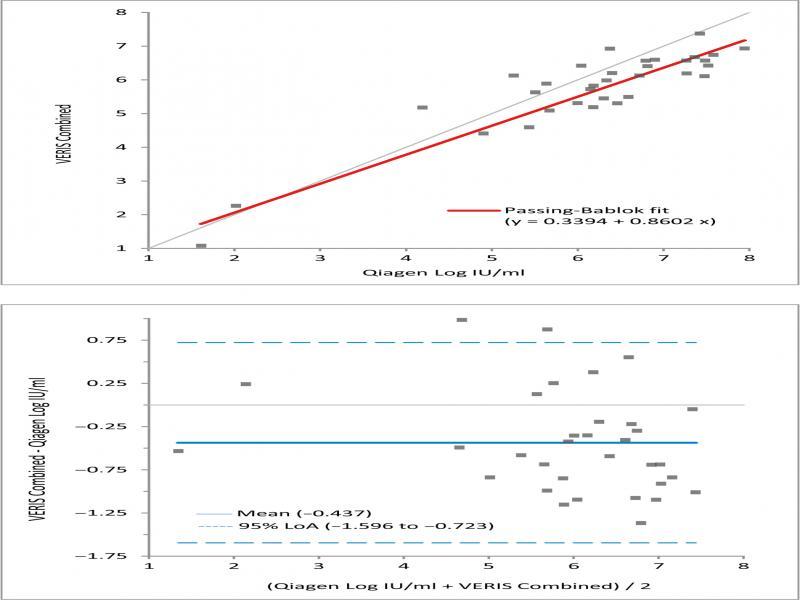
Have a personal or library account? Click to login
Comparison of Performance Characteristics of DxN VERIS System versus Qiagen PCR for HBV Genotype D and HCV Genotype 1b Quantification Cover

Comparison of Performance Characteristics of DxN VERIS System versus Qiagen PCR for HBV Genotype D and HCV Genotype 1b Quantification

Open Access
|Mar 2019

Figures & Tables

Fig. 1.

HBV plots for Passing-Bablok (upper) and Bland Altman analysis (lower).

Fig. 2.

HCV plots for Passing-Bablok (upper) and Bland Altman analysis (lower).

The Qiagen HBV DNA and HCV RNA levels in sampling_

Pattern of HBV samplingHBV DNA (IU/ml), n/total (%)Pattern of HCV samplingHCV RNA (IU/ml), n/total (%)
Negative12/67 (18%)Negative11/44 (25%)
< 10114/67 (21%)> 101  1/44 (2%)
> 102  9/67 (13%)> 102  1/44 (2%)
> 10313/67 (20%)> 104  2/44 (5%)
> 104  4/67 (6%)>105  6/44 (14%)
> 105  7/67 (10%)> 10614/44 (32%)
> 106  4/67 (6%)>107  9/44 (20%)
> 108  4/67 (6%)
DOI: https://doi.org/10.21307/pjm-2019-008 | Journal eISSN: 2544-4646 | Journal ISSN: 1733-1331
Language: English
Page range: 139 - 143
Published on: Mar 27, 2019
Published by: Polish Society of Microbiologists
In partnership with: Paradigm Publishing Services
Publication frequency: 4 issues per year

© 2019 MURAT SAYAN, AYSE ARIKAN, TAMER SANLIDAG, published by Polish Society of Microbiologists
This work is licensed under the Creative Commons Attribution-NonCommercial-NoDerivatives 4.0 License.