
Table I
In vitro activity of zabofloxacin, moxifloxacin, levofloxacin and ciprofloxacin against 116 MRSA clinical isolates.
Table II
MIC distribution of zabofloxacin, moxifloxacin, levofloxacin and ciprofloxacin determined by broth microdilution method for 116 MRSA isolates.
| Antimicrobial agent | MIC (μg/ml) | ||||||||||||
|---|---|---|---|---|---|---|---|---|---|---|---|---|---|
| 0.03 | 0.06 | 0.125 | 0.25 | 0.5 | 1 | 2 | 4 | 8 | 16 | 32 | 64 | > 64 | |
| Zabofloxacin | 10 | 17 | 25 | 12 | 7 | 1 | 32 | 12 | 0 | 0 | 0 | 0 | 0 |
| Moxifloxacin | 0 | 2 | 7 | 35 | 15 | 10 | 11 | 21 | 13 | 2 | 0 | 0 | 0 |
| Levofloxacin | 0 | 0 | 10 | 33 | 11 | 0 | 1 | 8 | 22 | 29 | 0 | 2 | 0 |
| Ciprofloxacin | 0 | 0 | 4 | 18 | 19 | 8 | 2 | 4 | 11 | 19 | 14 | 14 | 3a |
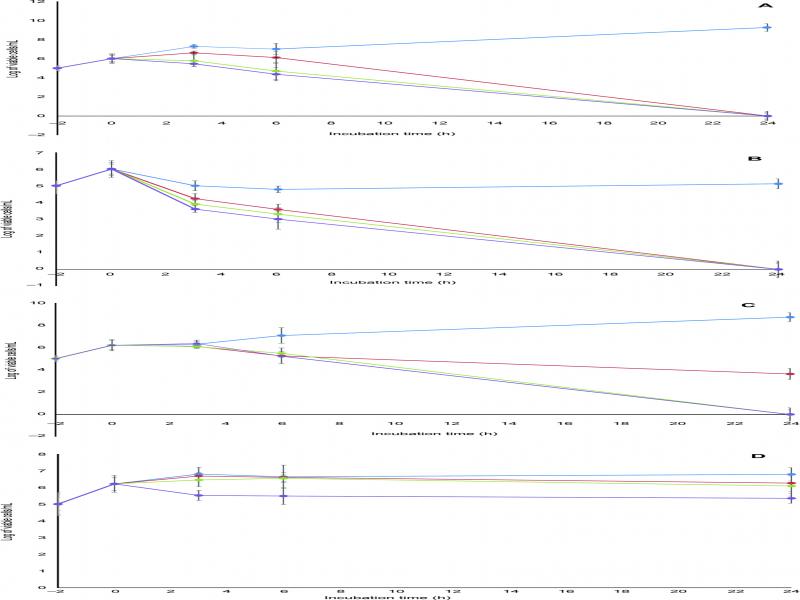
Fig. 1.
Bactericidal activities of (A) zabofloxacin, (B) moxifloxacin, (C) levofloxacin and (D) ciprofloxacin against fluoroquinolone-resistant MRSA clinical isolate S13. Blue line, 0.5 MIC; red line, 1 MIC; green line, 2 MIC; purple line, 4 MIC. Data points are geometric means with error bars being one standard deviation of replicate experiments (n = 3).
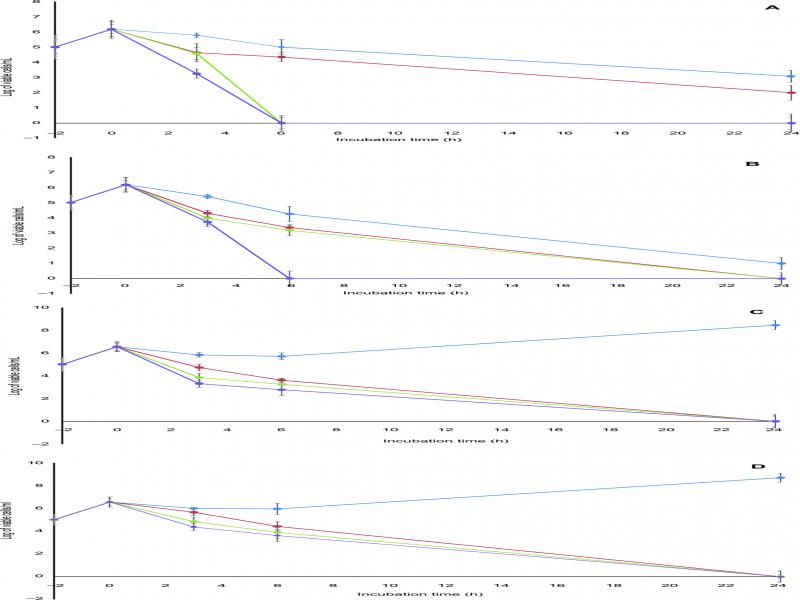
Fig. 2.
Bactericidal activities of (A) zabofloxacin, (B) moxifloxacin, (C) levofloxacin and (D) ciprofloxacin against fluoroquinolone-sensitive MRSA clinical isolate S15. Blue line, 0.5 MIC; red line, 1 MIC; green line, 2 MIC; purple line, 4 MIC. Data points are geometric means with error bars being one standard deviation of replicate experiments (n = 3).
Table III
MICs of zabofloxacin, moxifloxacin, levofloxacin and ciprofloxacin for selected 7 clinical MRSA isolates with detected mutations in QRDRs.
Table IV
In vivo activities of zabofloxacin, moxifloxacin, levofloxacin and ciprofloxacin against mice infected with MRSA S19 clinical isolate.
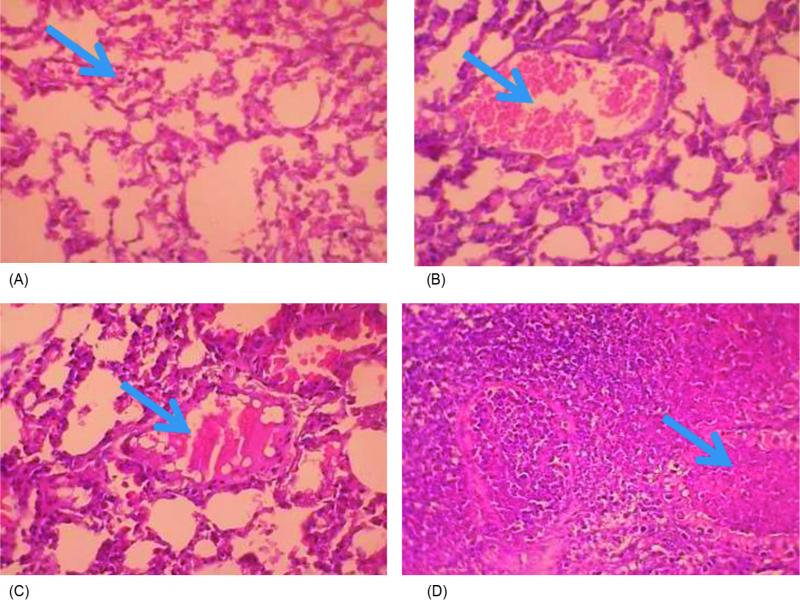
Fig. 3.
Lung tissue sections dissected from mice infected with MRSA clinical isolate and treated with (A) zabofloxacin showing very mild congestion (arrow) and inflammation with scarce inflammatory cells in the interstitial spaces; (B) moxifloxacin showing moderate congestion with ectatic vessels (arrow) and moderate interstitial inflammation; (C) levofloxacin showing moderate inflammation, congestion and oedema, with a dilated lymphatic vessel (arrow); and (D) ciprofloxacin showing bronchopneumonic changes with marked congestion, oedema, inflammatory infiltration and necrosis, with accumulation of necro-inflammatory exudate within the lumen of bronchioles (arrow) (H&E x400).
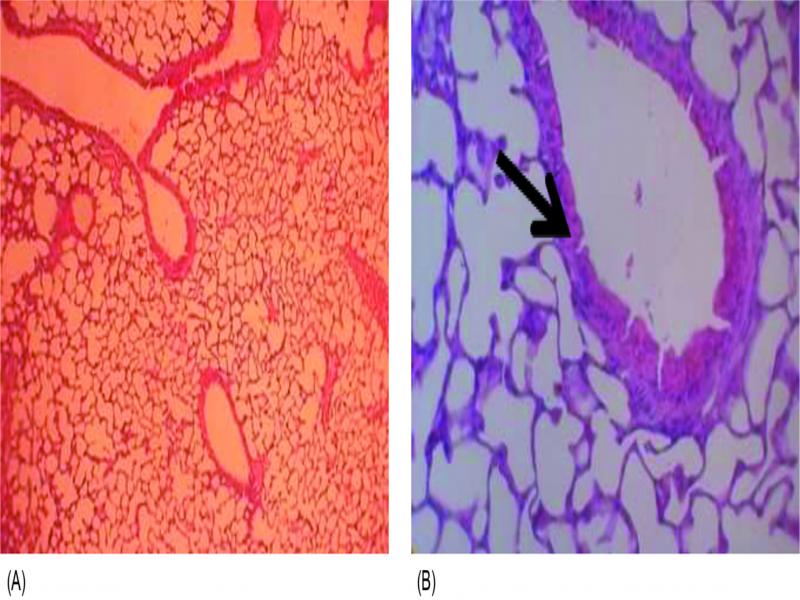
Fig. 4.
(A, × 100) cross section of lung tissue dissected from mice treated with zabofloxacin showing patent alveoli, (B, × 400) clear alveolar spaces and normal vessels, the bronchioles are lined by a layer of pneumocytes (arrow).
Table V
Scoring of detected congestion, inflammation, oedema and necrosis in lung tissues of mice groups infected with MRSA clinical isolate S19 and treated with zabofloxacin, moxifloxacin, levofloxacin and ciprofloxacin at a dose of 20 mg/kg of body weight/day.
| Histological observationa | (Score 0–3) | |||
|---|---|---|---|---|
| ZABb | MOX | LEV | CIP | |
| Congestion | 0 (40%) | |||
| +1 (20%) | +1 (60%) | +2 (80%) | +3 (60%) | |
| +2 (40%) | +2 (40%) | +1 (20%) | +1 (40%) | |
| Inflammation | 0 (40%) | |||
| +1 (20%) | +1 (60%) | +2 (80%) | +3 (60%) | |
| +2 (40%) | +2 (40%) | +1 (20%) | +1 (40%) | |
| Edema | 0 (40%) | |||
| +1 (20%) | +1 (60%) | +2 (80%) | +3 (60%) | |
| +2 (40%) | +2 (40%) | +1 (20%) | +1 (40%) | |
| Necrosis | 0 (40%) | |||
| +1 (20%) | +1 (60%) | +2 (80%) | +3 (60%) | |
| +2 (40%) | +2 (40%) | +1 (20%) | +1 (40%) | |