
Fig. 1.
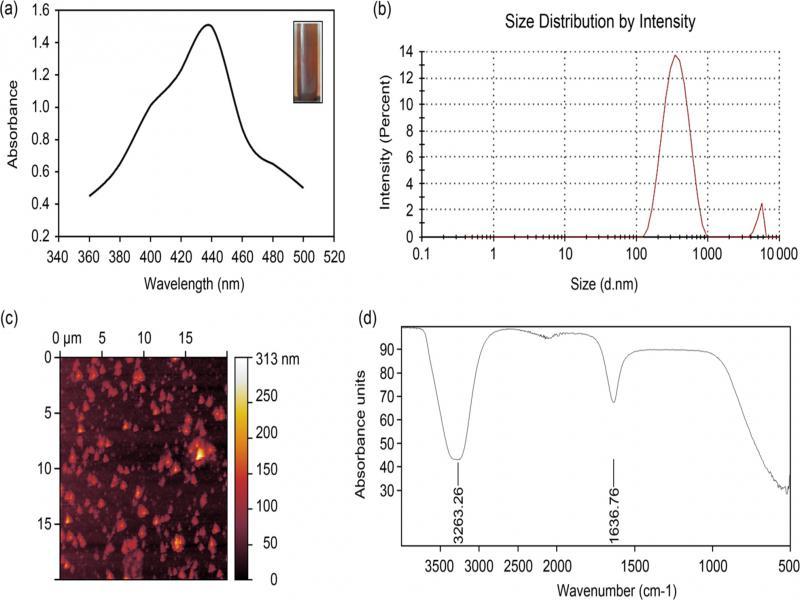
Fig. 2.
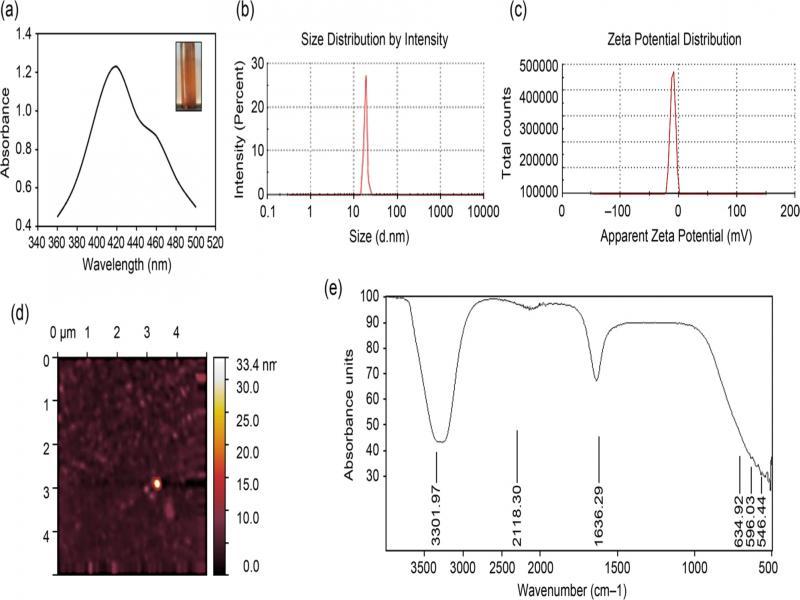
Fig. 3.
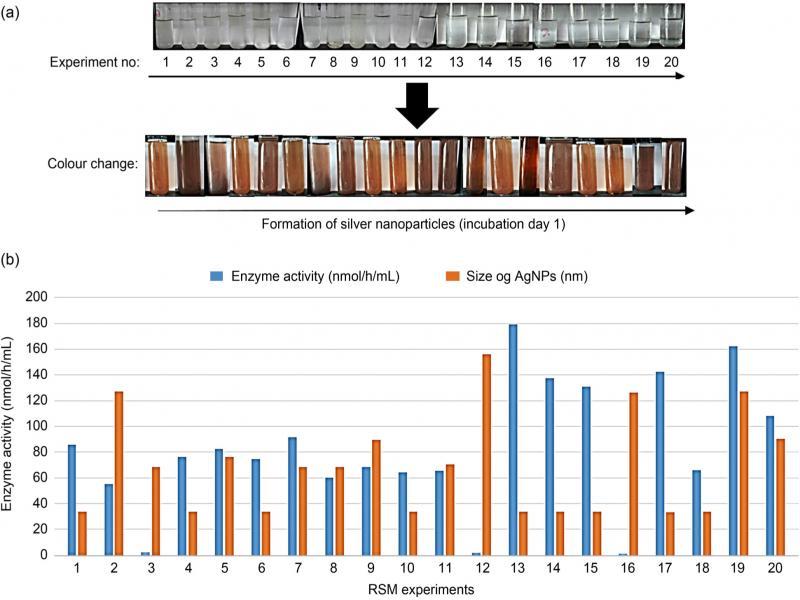
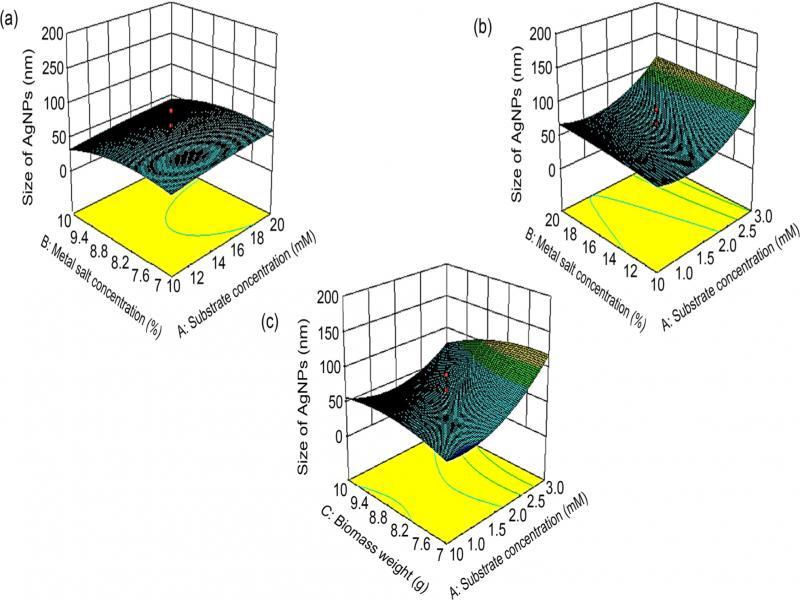
Fig. 4.
Central composite design (CCD) matrix of three independent variables for AgNPs biosynthesis in codes with experimental results_
| Runs | Factor A: Substrate concentration (mM) | Factor B: NaCl concentration (%) | Factor C: Wet weight of biomass (g) | Response: Size of AgNPs (nm) |
|---|---|---|---|---|
| 1 | 1 | 10 | 7 | 33.65 |
| 2 | 3 | 20 | 7 | 127.20 |
| 3 | 2 | 15 | 8.5 | 68.23 |
| 4 | 1 | 20 | 10 | 33.65 |
| 5 | 3 | 1 | 10 | 76.22 |
| 6 | 1 | 20 | 7 | 33.65 |
| 7 | 2 | 15 | 8.5 | 68.20 |
| 8 | 2 | 15 | 8.5 | 68.30 |
| 9 | 2 | 23.41 | 8.5 | 89.37 |
| 10 | 1 | 10 | 10 | 33.65 |
| 11 | 3 | 20 | 10 | 70.48 |
| 12 | 3.68 | 15 | 8.5 | 156.2 |
| 13 | 2 | 15 | 11.02 | 33.65 |
| 14 | 2 | 15 | 8.5 | 33.55 |
| 15 | 2 | 15 | 8.5 | 33.65 |
| 16 | 0.32 | 15 | 8.5 | 126.30 |
| 17 | 2 | 15 | 5.98 | 33.23 |
| 18 | 2 | 6.59 | 8.5 | 33.45 |
| 19 | 3 | 10 | 7 | 127.10 |
| 20 | 2 | 15 | 8.5 | 90.06 |
Analysis of Variance (ANOVA) of the Fitted Quadratic Model and regression analysis for optimization of AgNPs biosynthesis_
| Source | Sum of Squares | Df | Mean Square | F-Value | p-value | Prob > F |
|---|---|---|---|---|---|---|
| Model | 23241.50 | 9 | 2582.39 | 3.91 | 0.0224 | Significant |
| A – Substrate concentration | 7343.55 | 1 | 7343.55 | 11.11 | 0.0076 | |
| B – NaCl concentration | 572.28 | 1 | 572.28 | 0.87 | 0.3740 | |
| C – Wet weight of biomass | 836.67 | 1 | 836.67 | 1.27 | 0.2868 | |
| AB | 3.98 | 1 | 3.98 | 0.006017 | 0.9397 | |
| AC | 1447.22 | 1 | 1447.22 | 2.19 | 0.1697 | |
| BC | 4.26 | 1 | 4.26 | 0.006451 | 0.9376 | |
| A2 | 9658.74 | 1 | 9658.74 | 14.62 | 0.0034 | Significant |
| B2 | 78.85 | 1 | 78.85 | 0.12 | 0.7369 | |
| C2 | 2154.83 | 1 | 2154.83 | 3.26 | 0.1011 | |
| Residual | 6608.52 | 10 | 660.85 | |||
| Lack of Fit | 4113.14 | 5 | 822.63 | 1.65 | 0.2984 | Not significant |
| Pure Error | 2495.38 | 5 | 499.08 | |||
| Core Total | 29850.02 | 19 | ||||
| Std. dev | C.V | R-Squared | Adj R-Squared | Pred R-Squared | Adeq Precision | |
| 25.71 | 37.53 | 0.7786 | 0.5794 | 0.1664 | 8.801 |