
Table I
Details of BLAST result, % similarity, and accession numbers of all isolates.
| Isolate | Sequence length (bp) | BLAST result | % Similarity | Accession No. |
|---|---|---|---|---|
| PD4.8 | 1385 | Pseudoalteromonas shiyosakiensis | 99 | LC131142.1 |
| FB3 | 1349 | Vibrio alginolyticus | 97 | KC884661.1 |
| FB4 | 1256 | Pseudoalteromonas sp. | 96 | JX0705058.1 |
| FB7 | 1439 | Alteromonas sp. | 93 | EF061415.1 |
| FB9 | 1398 | Pseudoalteromonas sp. | 94 | JX075059.1 |
| FB13 | 1446 | Bacillus sp. | 93 | DQ448746.1 |
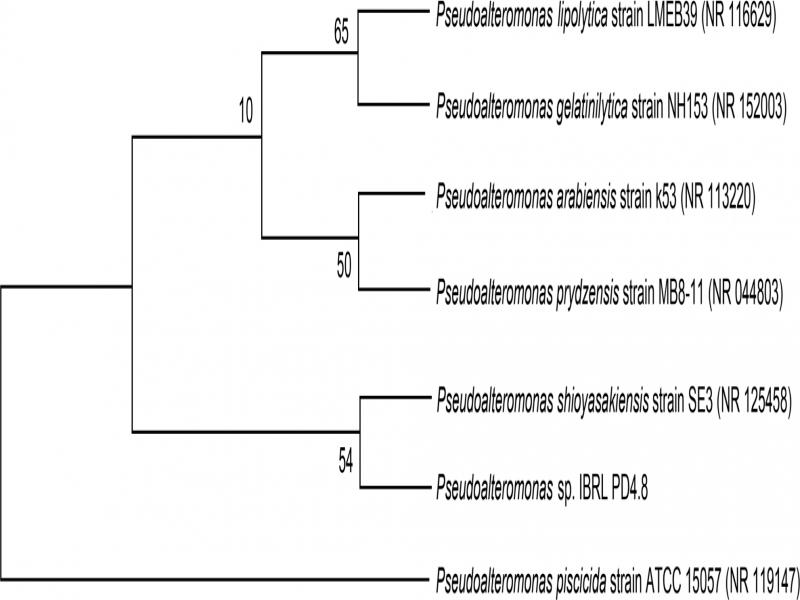
Fig. 1.
Phylogenetic tree of Pseudoalteromonas sp. IBRL PD4.8 isolated from the surface of C. racemosa.
Table II
MIC values for crude extract and fraction F3 against fouling bacteria.
| Fouling bacteria | Crude (mg/ml), MIC | F3 (mg/ml), MIC |
|---|---|---|
| Vibrio alginolyticus FB3 | 8.00 | 8.00 |
| Pseuodoaltermonas sp. FB4 | 8.00 | 4.00 |
| Alteromonas sp. FB7 | 8.00 | 8.00 |
| Pseudoalteromonas sp. FB9 | 8.00 | 8.00 |
| Bacillus sp. FB13 | 0.13 | 0.50 |
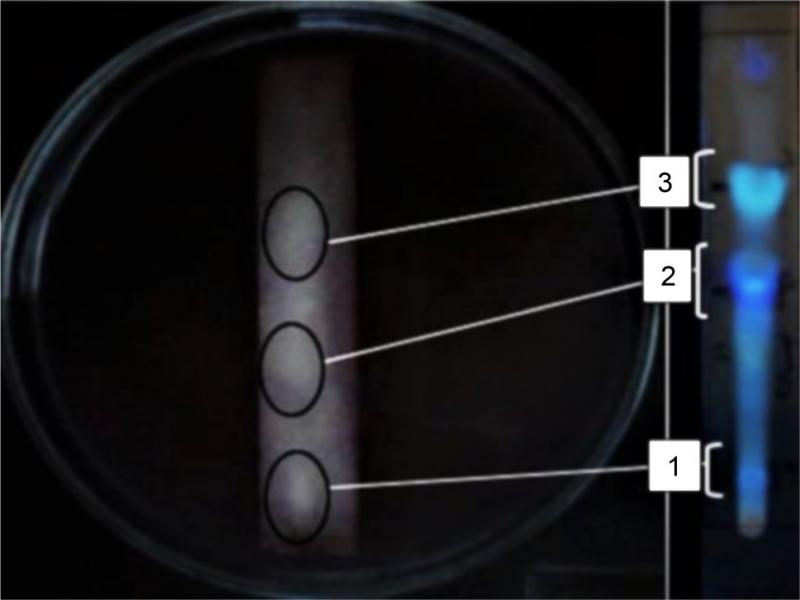
Fig. 2.
Agar-overlay assay of ethyl acetate extract of Pseudoalteromonas sp. IBRL PD4.8 against V. alginolyticus FB3.
Circle (1) light yellow, Rf 0.06; (2) fluorescent blue, Rf 0.35; (3) fluorescent green, Rf 0.55.
Table III
Characteristics of compounds from LC-MS analysis of sub-fraction F3a.
| No. | RT (min) | Compound | Mass | m/z [M-H]− | Formula | Score (DB) |
|---|---|---|---|---|---|---|
| 1 | 4.233 | Sulfate | 97.967 | 96.9597 | H2O4S | 98.79 |
| 2 | 4.906 | 4,7,10,13-hexadecatetraenoic acid | 248.1763 | 293.1748 | C16H24O2 | 84.93 |
| 3 | 5.662 | Homoveratric acid | 196.0729 | 241.071 | C10H12O4 | 95.41 |
| 4 | 6.809 | Isoacitretin | 326.1891 | 325.1821 | C21H26O3 | 84.11 |
| 5 | 6.923 | Sodium tetradecyl sulfate | 294.1859 | 293.1779 | C14H30O4S | 86.66 |
| 6 | 7.617 | D1-2-Hydroxymethylethisteron | 340.2048 | 339.1978 | C22H8O3 | 85.00 |
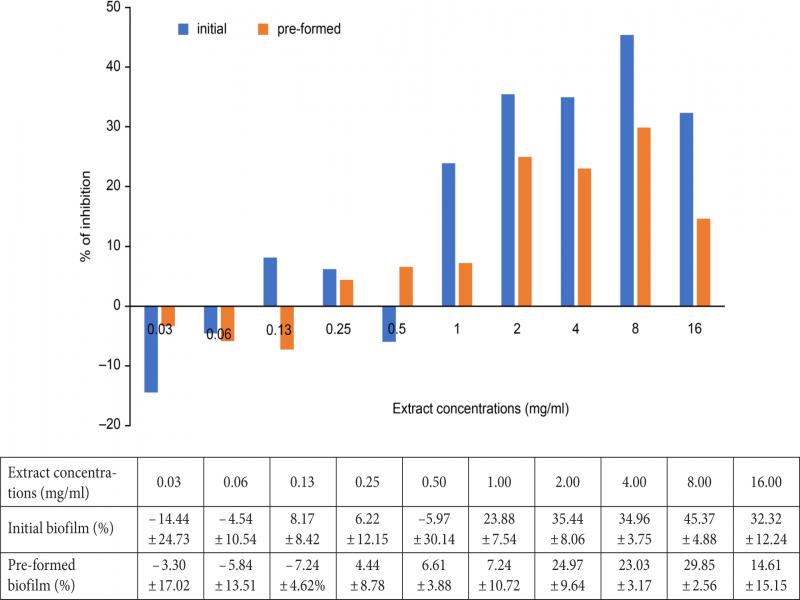
Fig. 3.
Antibiofilm activity of Pseudoalteromonas sp. IBRL PD4.8 extract against initial and pre-formed biofilm of V. alginolyticus FB3. Data of inhibition percentages are presented in the table below the figure.
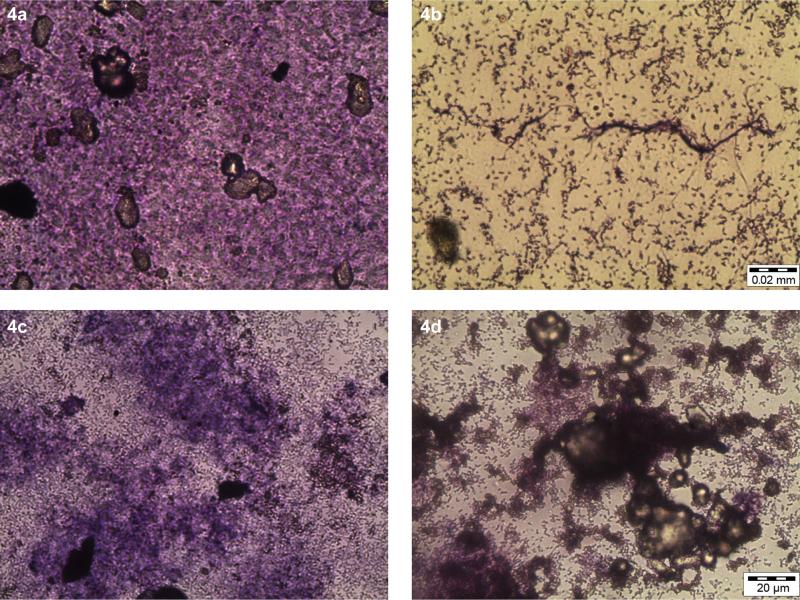
Fig. 4.
The light microscopy images of V. alginolyticus FB3 biofilms treated with Pseudoalteromonas sp. IBRL PD4.8 extract.
A. Untreated initial biofilm; B. initial biofilm treated with 8.0 mg/ml; C. untreated pre-formed biofilm; D. pre-formed biofilm treated with 8.0 mg/ml; bar = 20 µm.
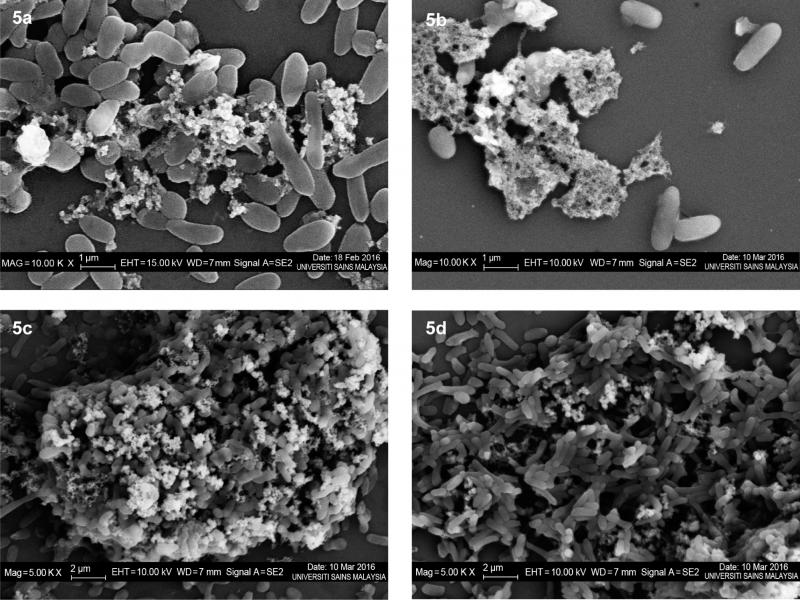
Fig. 5.
The scanning electron microscopic images of V. alginolyticus FB3 biofilms treated with the extract at a concentration of 8.0 mg/ml.
A. untreated initial biofilm (10 000×); B. treated initial biofilm (10 000×); C. untreated pre-formed biofilm (5000×); D. treated pre-formed biofilm (5000×).