
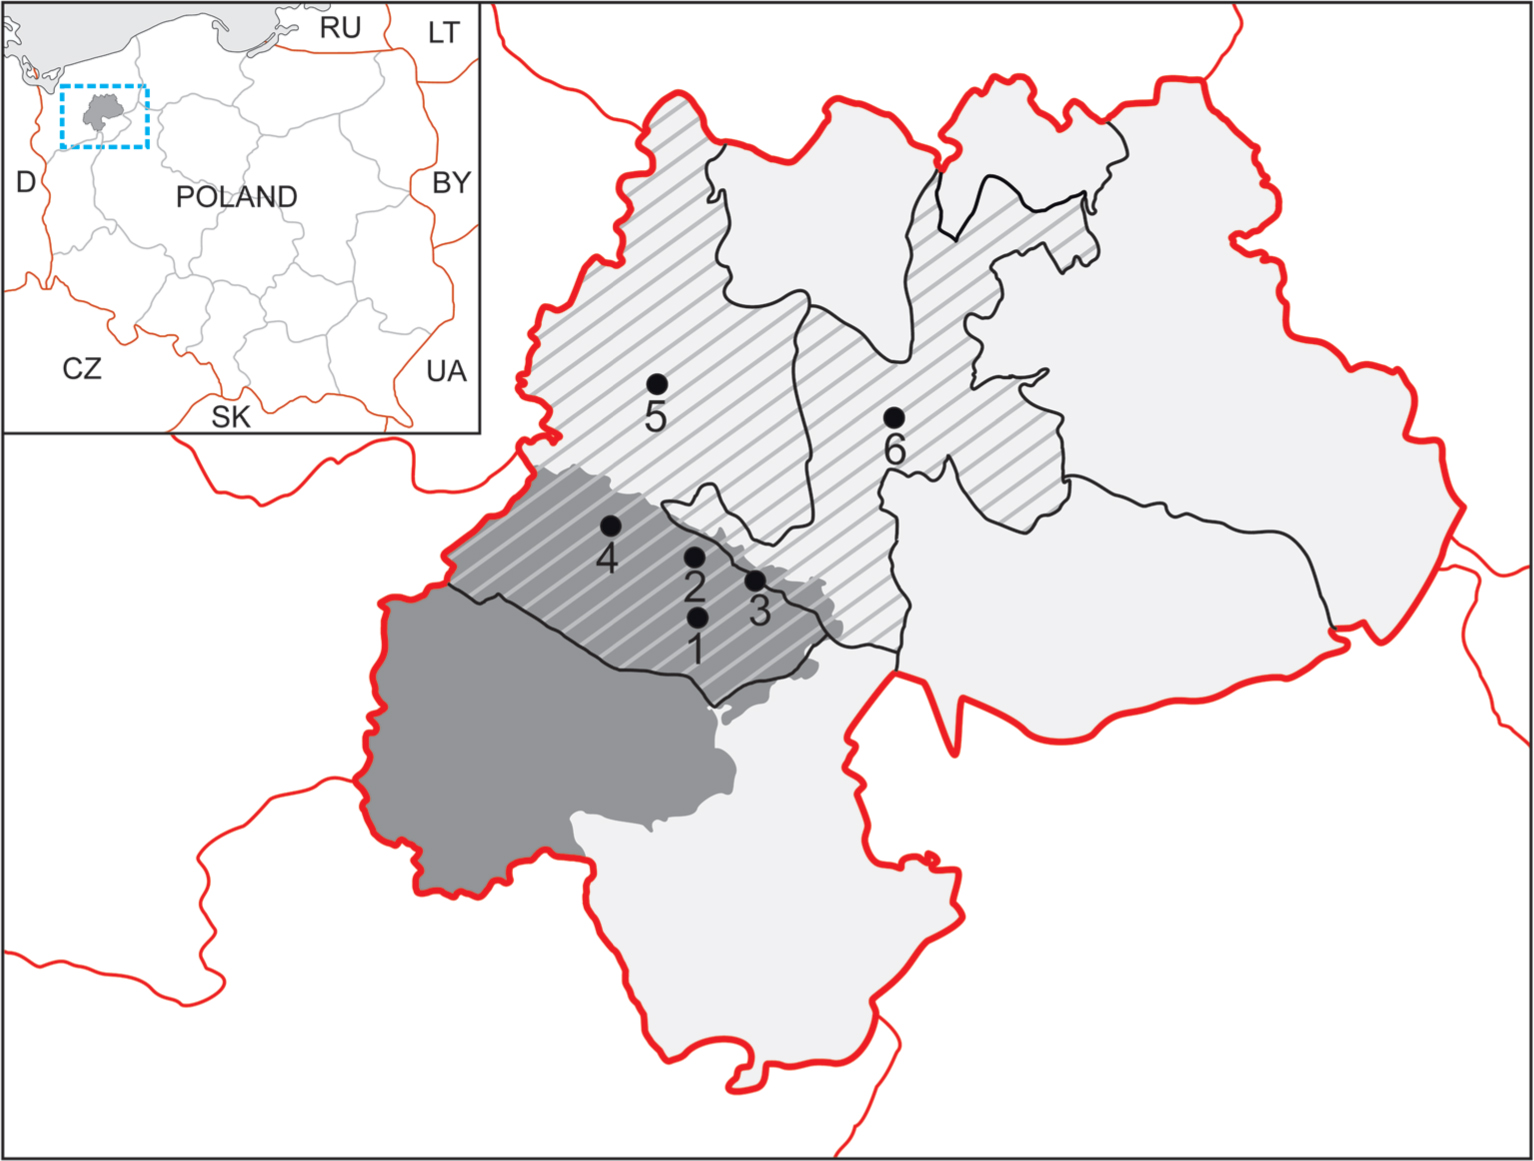
Fig. 1.
The locations of sample collection.
Legend: Area marked by the red line: Drawsko County; dark grey slanted striped areas: Drawsko and Złocieniec Districts; grey areas: Drawsko military training ground.
The numbers indicate the areas of sample collections: ticks (1 – Konotop, 2 – Lake Konotop, 3 – Karwice, 4 – Oleszno), and animals (5 – Drawsko-Pomorskie, 6 – Złocieniec).
Table I
The oligonucleotides used in real-time PCR.
| C. burnetii | F. tularensis | ||
|---|---|---|---|
| IS1111+ (Klee et al. 2006) | fopA (Emmanuel et al. 2003) | tul4 (Fujita et al. 2006) | |
| Forward primer | 5’-GTCTTAAGGTGGGCTGCGT G-3’ | 5’-AACAATGGCACCTAGTAAT ATTTCTGG-3’ | 5’-ATTACAATGGCAGGCTCC AGA-3’ |
| Reverse primer | 5’-CCCCGAATCTCATTGATC AGC-3’ | 5’-CCACCAAAGAACCATGTT AAACC-3’ | 5’-TGCCCAAGTTTTATCGTTC TTCT-3’ |
| Probe | 5’-FAM-AGCGAACCATTGGTATC GGACGTTT-TAMRA-TATGG-Pho-3’ | 5’-FAM-TGGCAGAGCGGGTACT AACATGATTGGT-TAMRA-3’ | 5’-FAM TCCTAAGTGCCATGAT ACAAGCTTCCCAATTACTAAG-BHQ1-3’ |
Table II
The estimated prevalence of positive ticks pools for C. burnetii and F. tularensis.
| Site | Number of pools | PoolSize | Number of positive pools for C. burnetii | Number of positive pools for F. tularensis | Number of individuals | Total number of individuals | Estimated prevalence (%)1C. burnetii | Estimated prevalence (%)1F. tularensis |
|---|---|---|---|---|---|---|---|---|
| Drawa | 9 | 20 | 1 | 0 | 59 | 211 | 0.5% | 0.49% |
| 1 | 19 | 0 | 0 | 52 | ||||
| 1 | 12 | 0 | 1 | 100 | ||||
| Karwice | 23 | 20 | 2 | 0 | 460 | 460 | 0.45% | 0 |
| Lake Konotop | 17 | 20 | 8 | 0 | 340 | 377 | 3.1% | 0 |
| 1 | 19 | 0 | 0 | 19 | ||||
| 1 | 13 | 0 | 0 | 13 | ||||
| 1 | 5 | 1 | 0 | 5 | ||||
| Konotop | 5 | 20 | 2 | 0 | 100 | 117 | 3.45% | 0 |
| 1 | 17 | 1 | 0 | 17 | ||||
| Oleszno | 18 | 20 | 2 | 0 | 360 | 386 | 0.55% | 0 |
| 1 | 19 | 0 | 0 | 19 | ||||
| 1 | 7 | 0 | 0 | 7 |