
Table I
Effect of sorbitol on the MICs of emodin and antibiotics against C. albicans ATCC 10231.
| MIC (µg/ml) | ||
|---|---|---|
| Without sorbitol | With sorbitol | |
| Emodin | 12.5 | 25 |
| Caspofungin | 0.15 | 0.6 |
| Amphotericin B | 1 | 1 |
Table II
In vitro activity of emodin and caspofungin alone and in combination assessed by the broth dilution assay against clinical strains of C. albicans isolated from urinary tracts.
| Strain No. | MIC of the drug used alone (µg/ml) | MIC of the drug used in combination (µg/ml) | FICI | Interaction | |
|---|---|---|---|---|---|
| Emodin | Caspofungin | Emodin + Caspofungin | |||
| 1 | 12.5 | 0.15 | 12.5 + 0.3 | 3 | Indifferent |
| 2 | 12.5 | 0.07 | 12.5 + 0.3 | 5.28 | Antagonism |
| 3 | 25 | 0.3 | 25 + 0.6 | 3 | Indifferent |
| 4 | 25 | 0.3 | 25 + 0.3 | 2 | Indifferent |
| 5 | 50 | 0.6 | 50 + 1.2 | 3 | Indifferent |
| 6 | 50 | 0.15 | 50 + 0.3 | 3 | Indifferent |
| 7 | 12.5 | 0.15 | 12.5 + 0.3 | 3 | Indifferent |
| 8 | 12.5 | 0.07 | 12.5 + 0.3 | 5.28 | Antagonism |
| 9 | 25 | 0.03 | 25 + 0.15 | 6 | Antagonism |
| 10 | 25 | 0.3 | 25 + 0.15 | 1.5 | Indifferent |
| 11 | 25 | 0.15 | 25 + 0.3 | 3 | Indifferent |
| 12 | 50 | 0.6 | 50 + 0.3 | 1.5 | Indifferent |
| 13 | 50 | 0.3 | 50 + 0.3 | 2 | Indifferent |
| 14 | 50 | 0.6 | 50 + 0.6 | 2 | Indifferent |
| 15 | 25 | 0.3 | 25 + 0.15 | 1.5 | Indifferent |
| 16 | 6.25 | 0.03 | 12.5 + 0.06 | 4 | Indifferent |
| 17 | 50 | 0.6 | 50 + 0.6 | 2 | Indifferent |
| 18 | 50 | 0.3 | 50 + 0.3 | 2 | Indifferent |
| 19 | 50 | 0.15 | 25 + 0.15 | 1.5 | Indifferent |
| 20 | 25 | 0.6 | 50 + 0.6 | 3 | Indifferent |
Table III
In vitro activity of emodin and caspofungin alone and in combination assessed by the broth dilution method against clinical strains of C. albicans isolated from vaginas.
| Strain No. | MIC of the drug used alone (µg/ml) | MIC of the drug used in combination (µg/ml) | FICI | Interaction | |
|---|---|---|---|---|---|
| Emodin | Caspofungin | Emodin + Caspofungin | |||
| 1 | 50 | 0.3 | 50 + 0.3 | 2 | Indifferent |
| 2 | 50 | 0.6 | 50 + 0.6 | 2 | Indifferent |
| 3 | 25 | 0.15 | 25 + 0.3 | 3 | Indifferent |
| 4 | 50 | 0.3 | 50 + 0.3 | 2 | Indifferent |
| 5 | 25 | 0.15 | 25 + 0.3 | 3 | Indifferent |
| 6 | 50 | 0.07 | 25 + 0.15 | 2.64 | Indifferent |
| 7 | 50 | 0.3 | 50 + 0.6 | 3 | Indifferent |
| 8 | 50 | 0.6 | 25 + 0.3 | 1 | Indifferent |
| 9 | 12.5 | 0.3 | 25 + 0.3 | 3 | Indifferent |
| 10 | 50 | 0.15 | 50 + 0.6 | 5 | Antagonism |
| 11 | 50 | 0.07 | 50 + 0.15 | 3 | Indifferent |
| 12 | 50 | 0.6 | 50 + 0.3 | 1.5 | Indifferent |
| 13 | 25 | 0.3 | 50 + 0.3 | 3 | Indifferent |
| 14 | 25 | 0.6 | 50 + 0.15 | 2.25 | Indifferent |
| 15 | 25 | 0.3 | 50 + 0.15 | 2.5 | Indifferent |
| 16 | 12.5 | 0.03 | 25 + 0.15 | 5 | Antagonism |
| 17 | 12.5 | 0.6 | 12.5 + 0.6 | 2 | Indifferent |
| 18 | 50 | 0.3 | 50 + 0.6 | 3 | Indifferent |
| 19 | 50 | 0.15 | 25 + 0.07 | 1 | Indifferent |
| 20 | 50 | 0.6 | 50 + 0.3 | 1.5 | Indifferent |
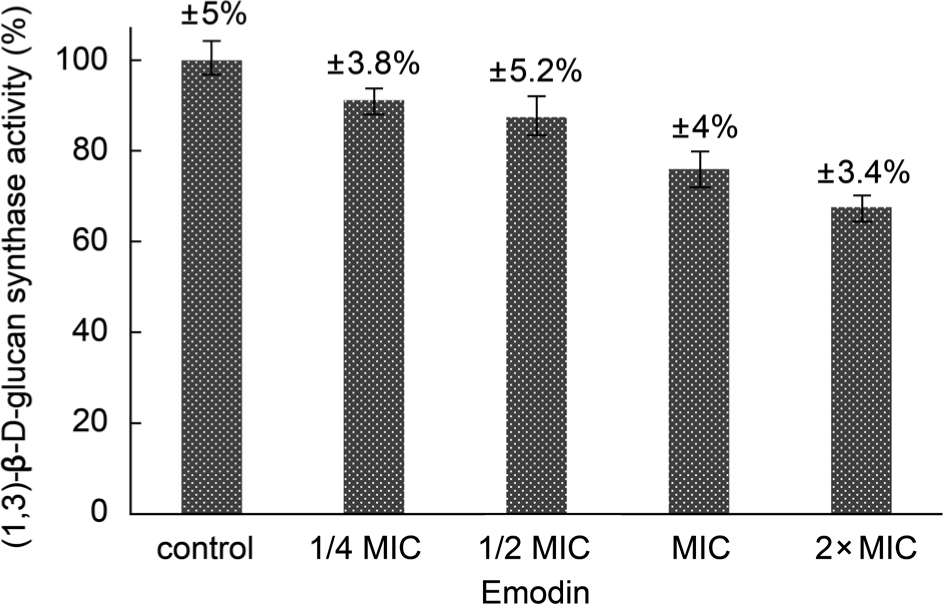
Fig. 1.
Effect of emodin on (1,3)-β-D-glucan synthase activity.
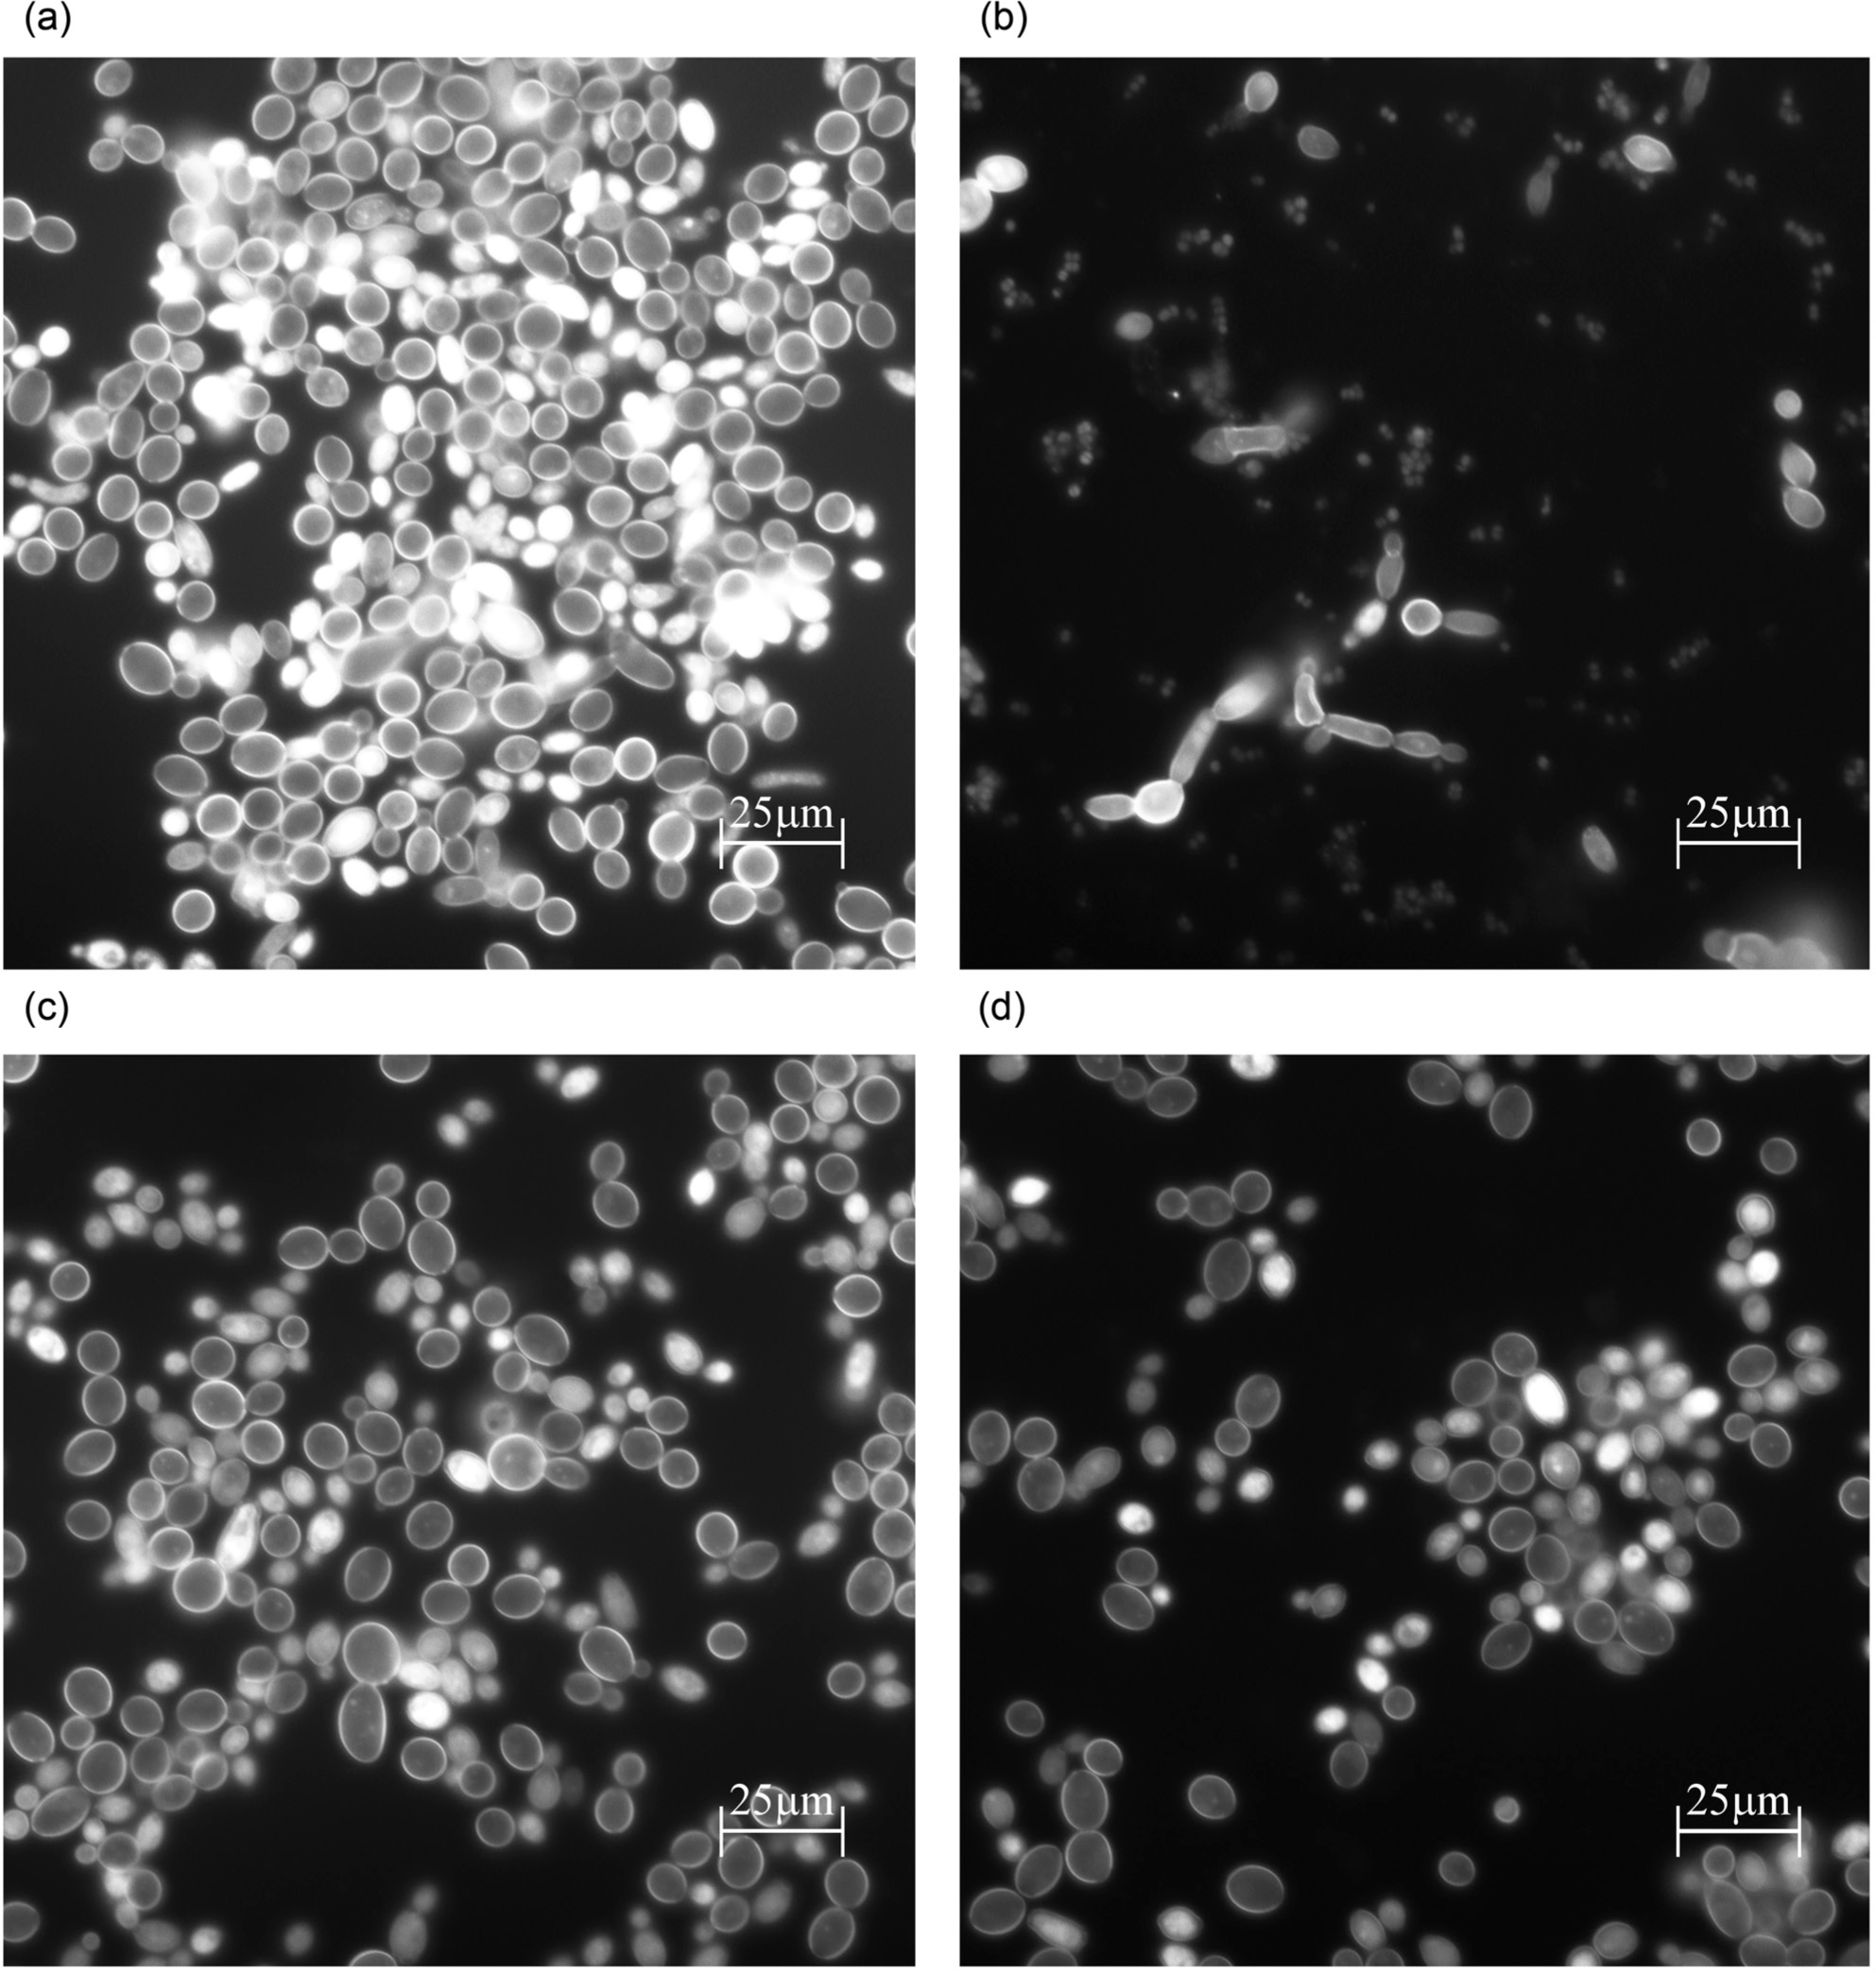
Fig. 2.
Aniline blue staining of C. albicans cell walls. A) treatment with DMSO at 1% (control); B) caspofungin at 0.07 µg/ml; C) emodin at 6.25 µg/ml; D) emodin at 3.12 µg/ml.
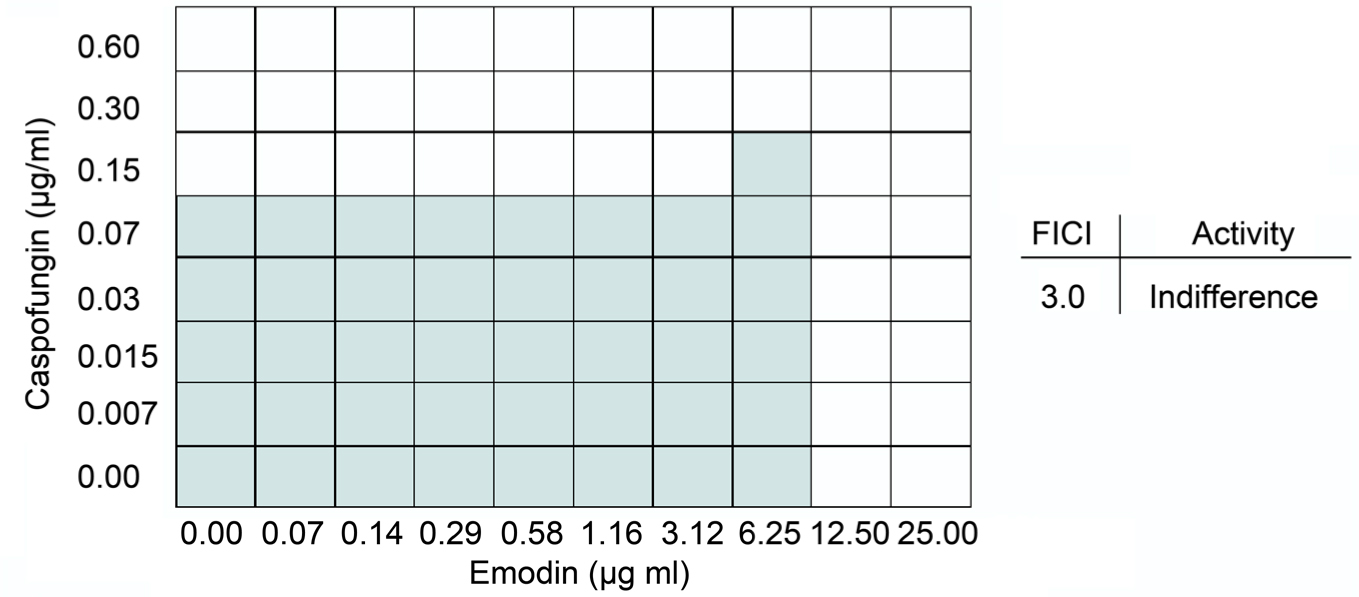
Fig. 3.
The checkerboard method showing unresponsiveness of the emodin-caspofungin combination. The resulting checkerboard included each combination of emodin and caspofungin, with wells containing the highest concentration of each compounds in opposite corners (darkened fields mean cell growth; light fields mean no growth).