
Fig. 1.
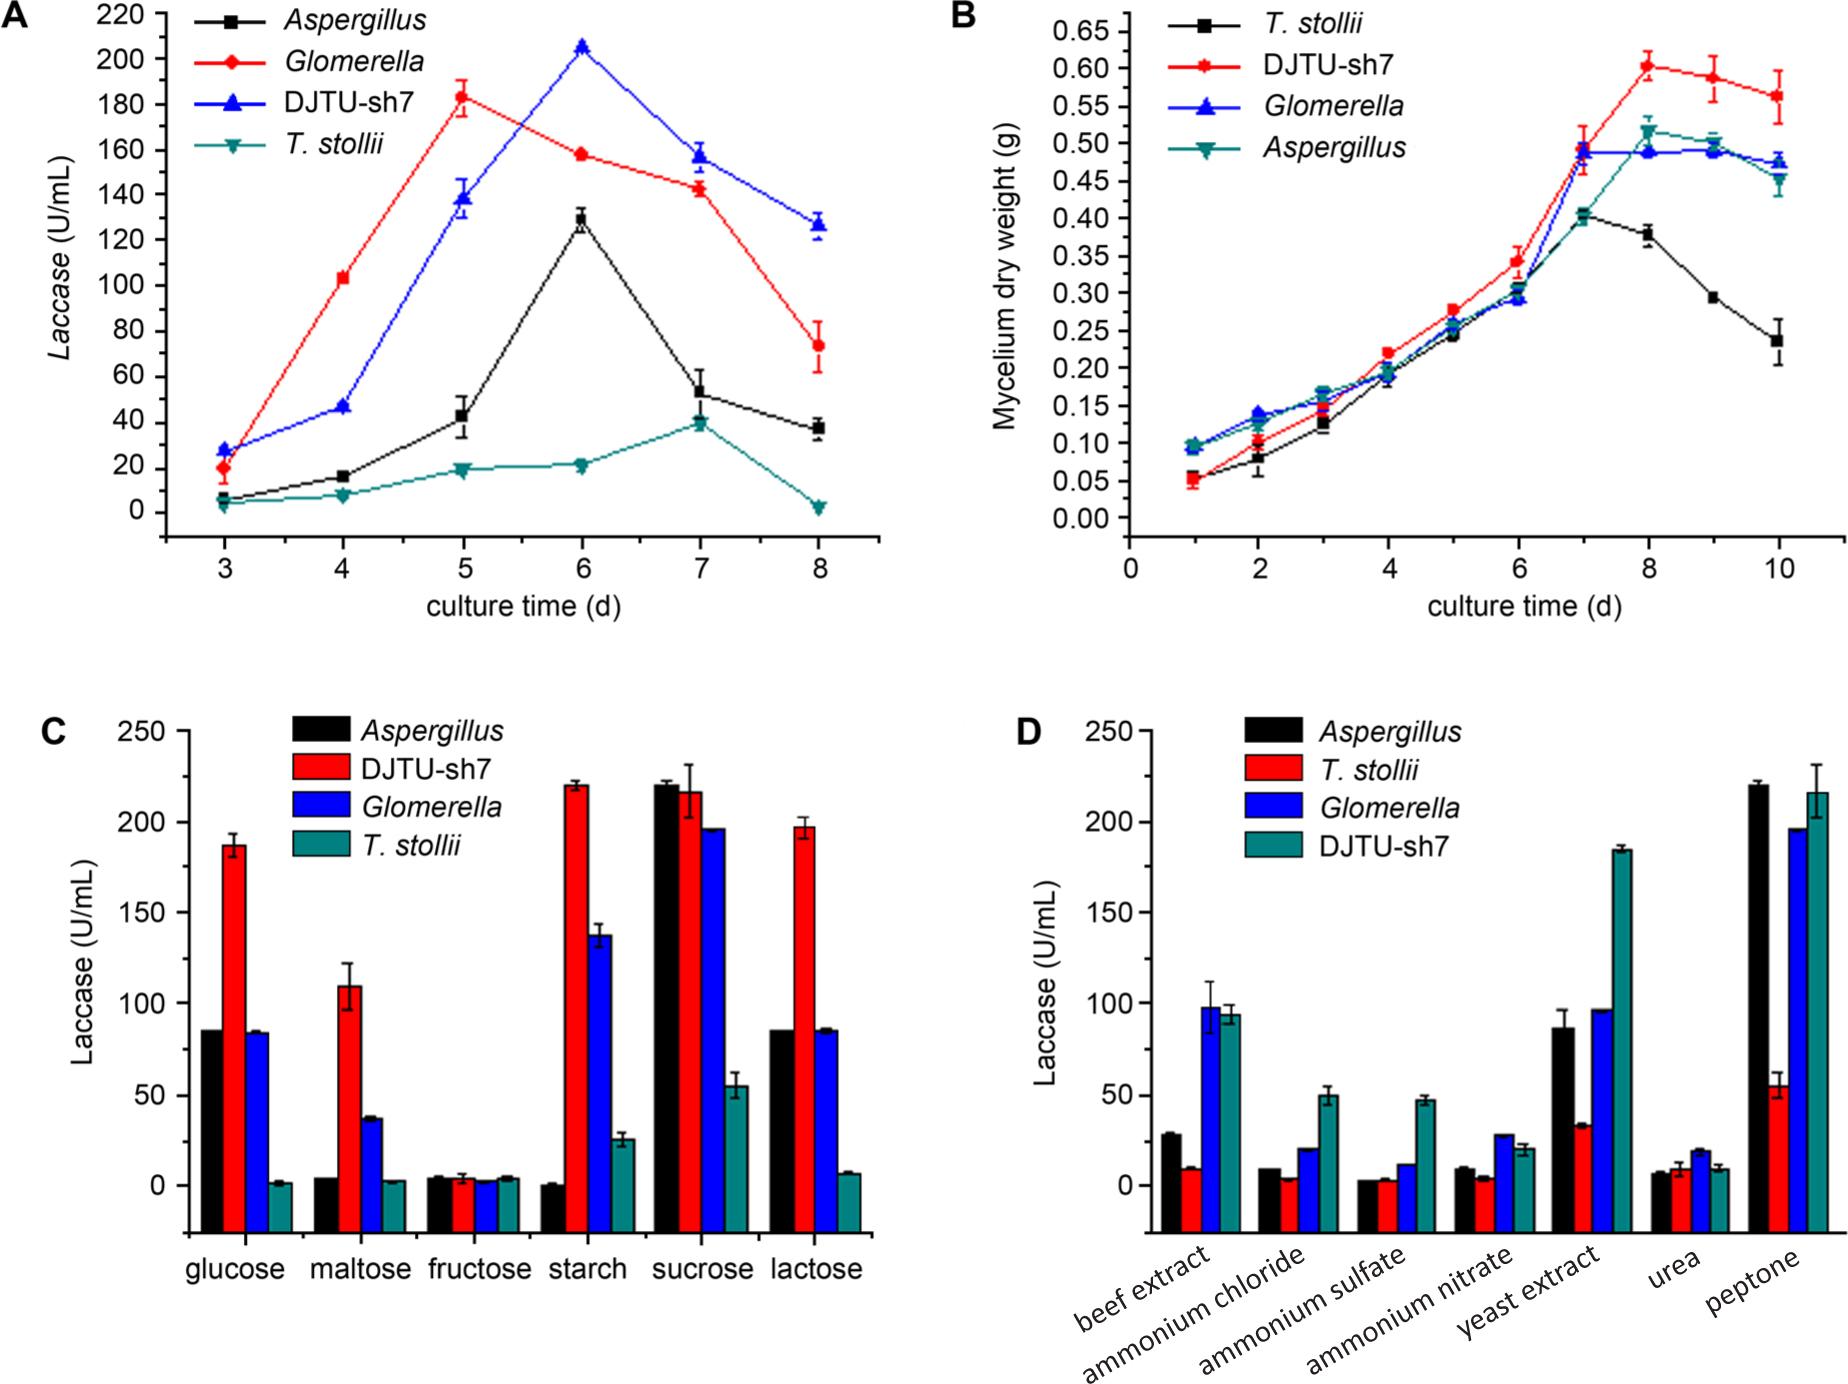
Fig. 2.
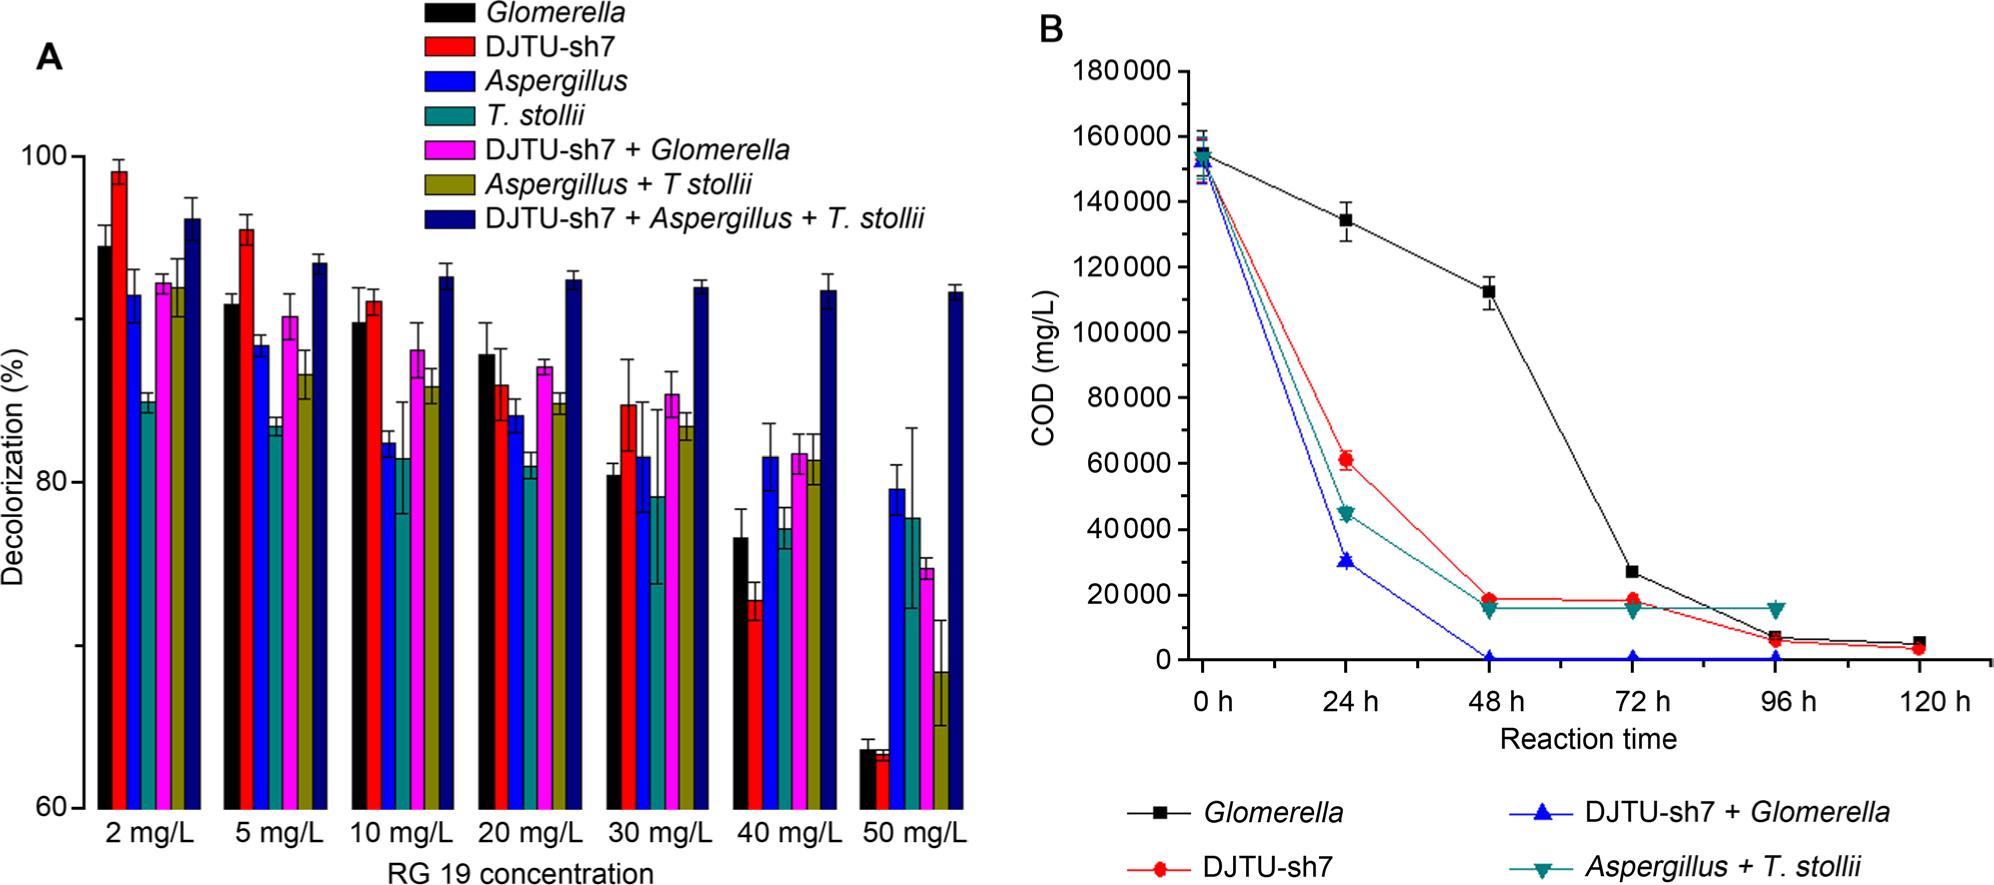
Fig. 3.
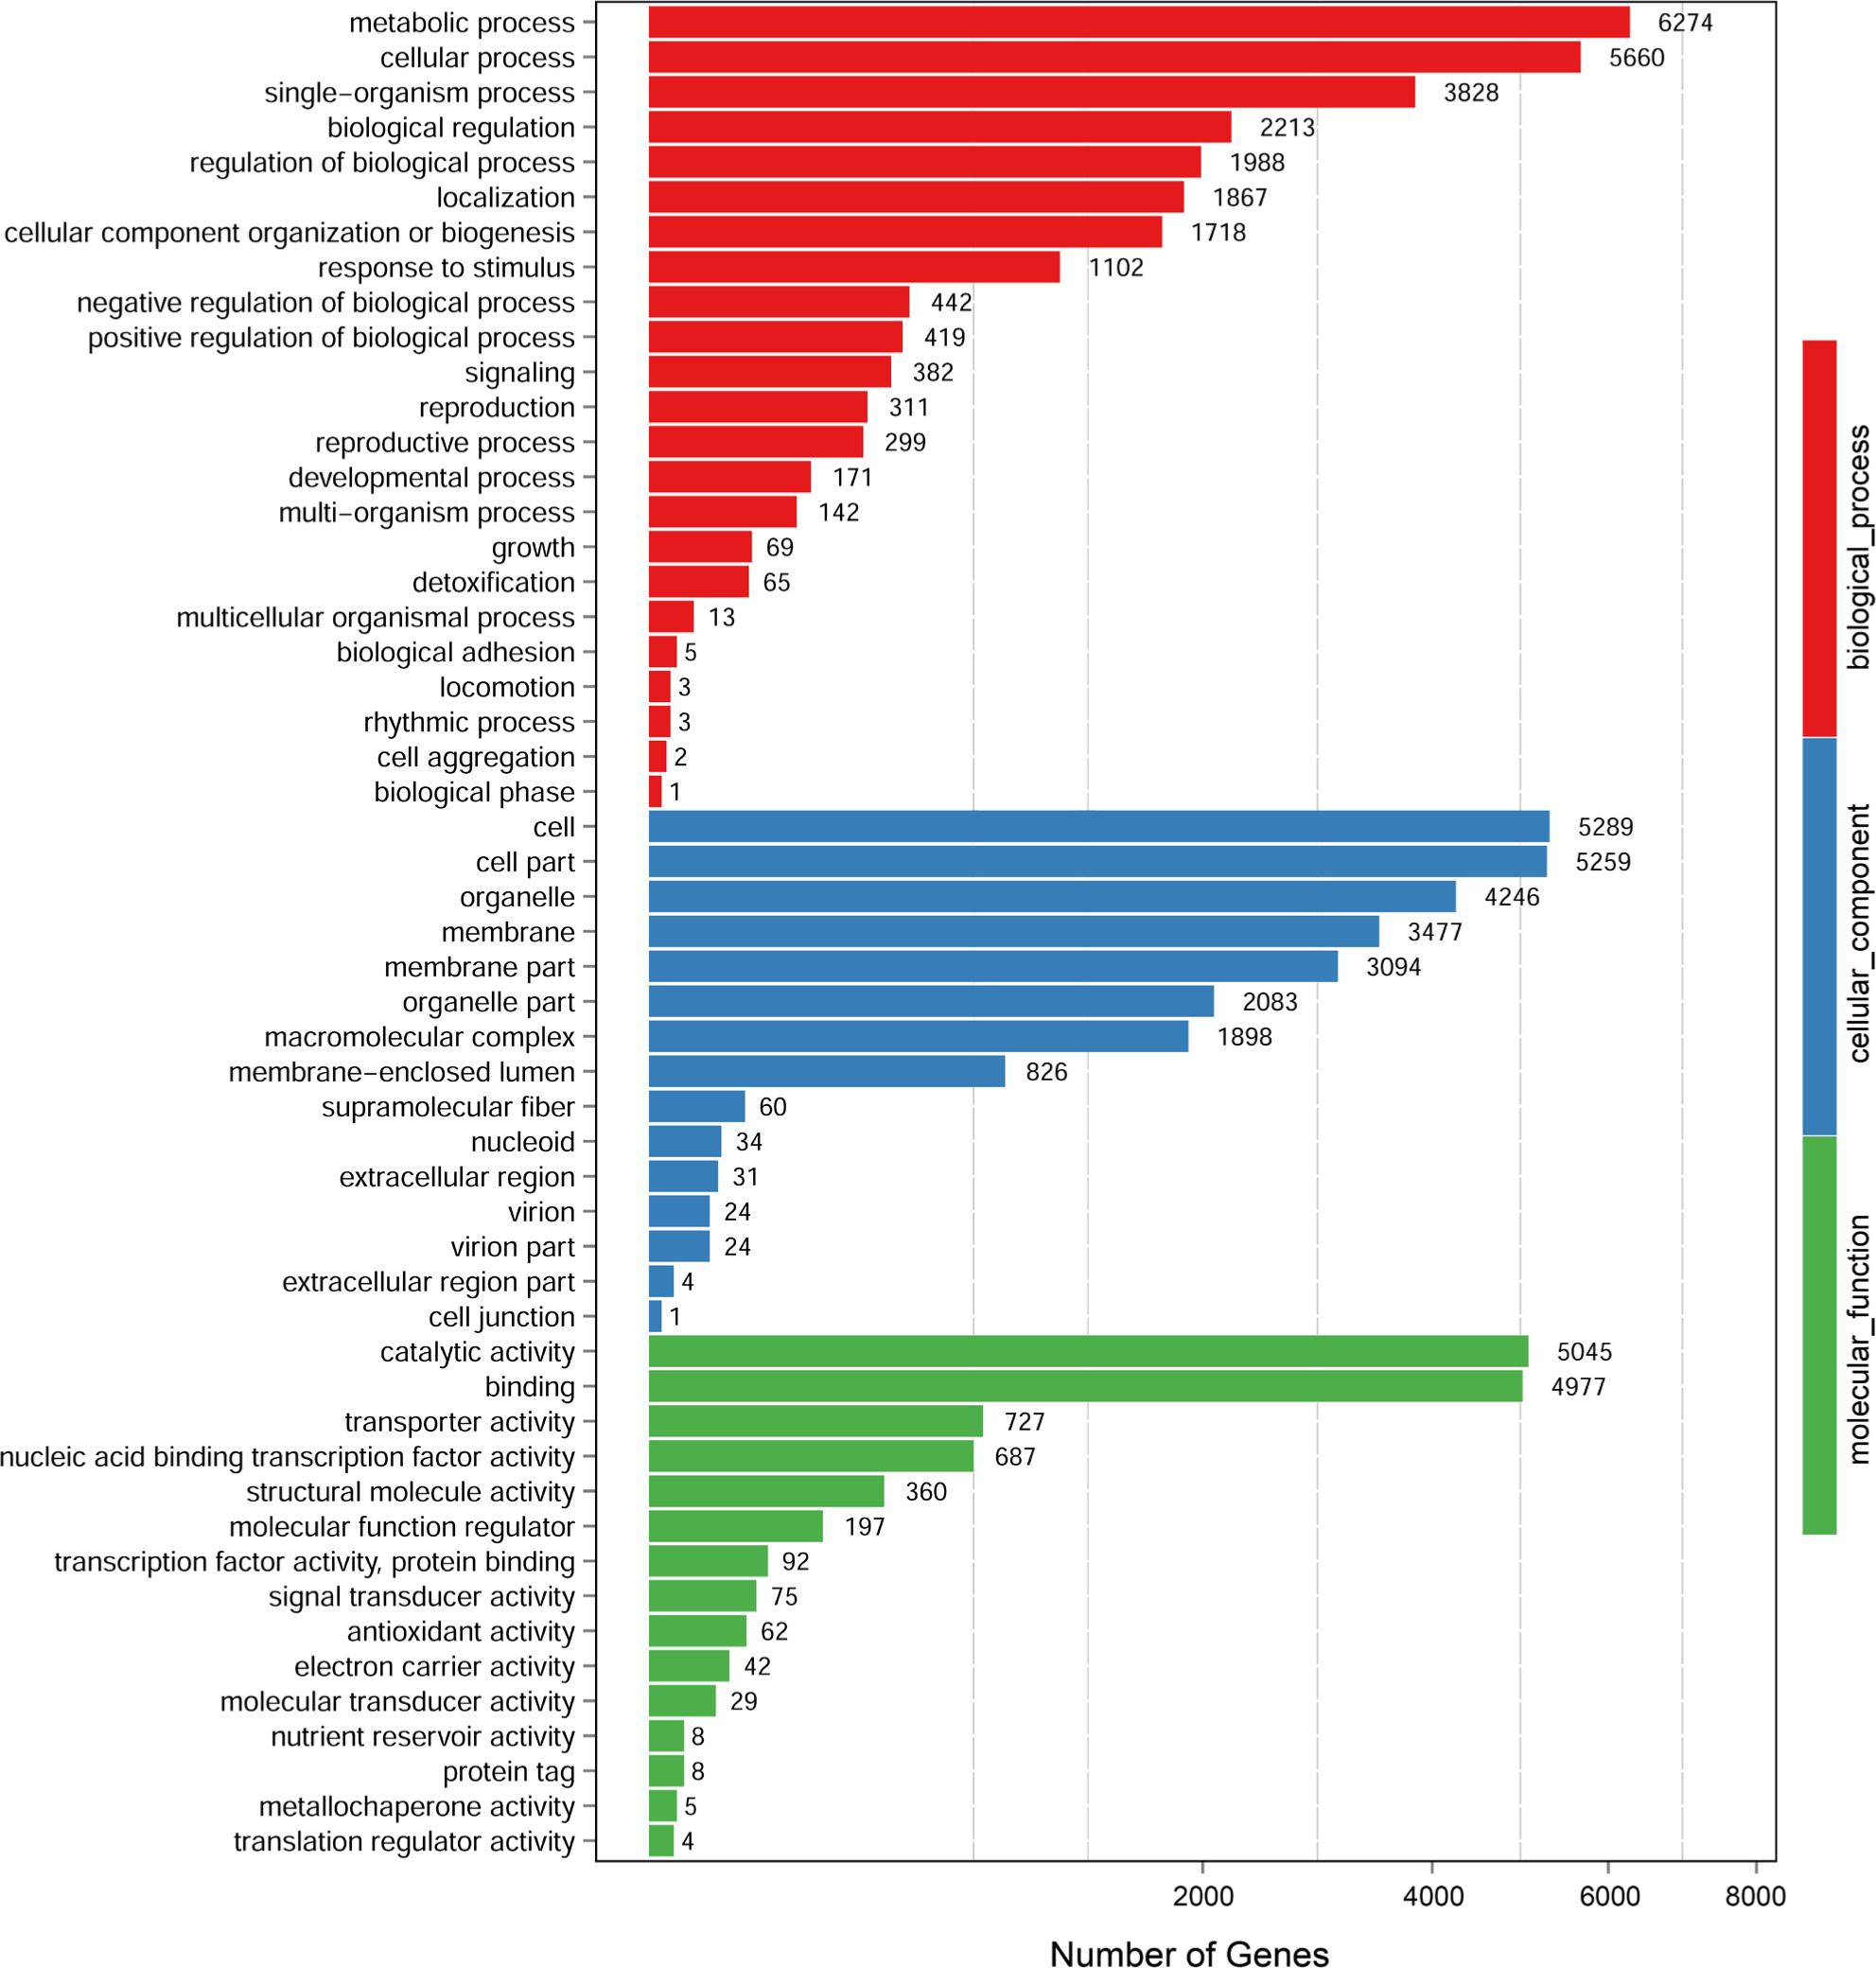
Fig. 3.
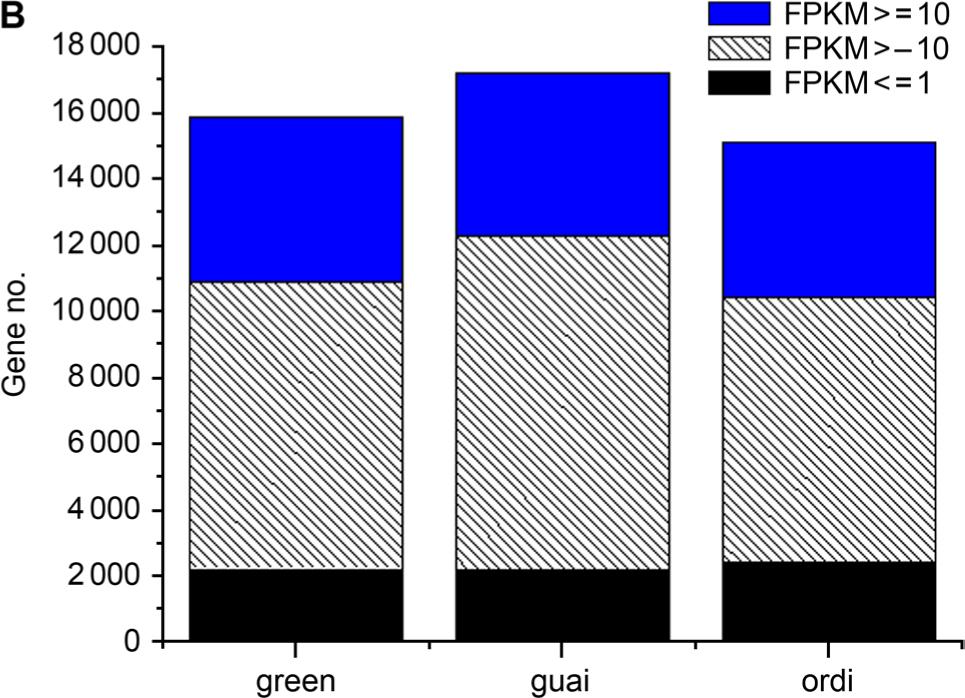
Fig. 3.
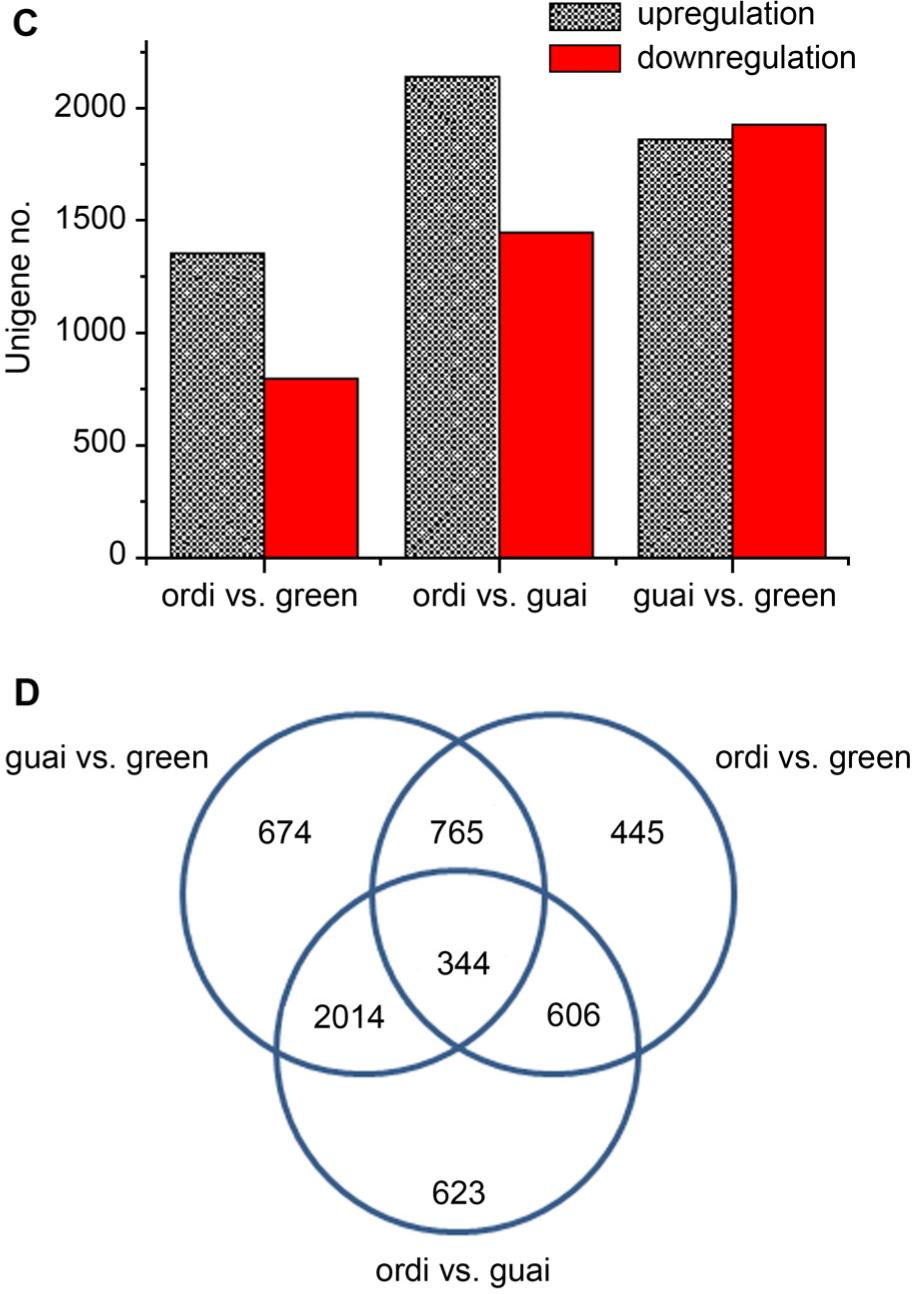
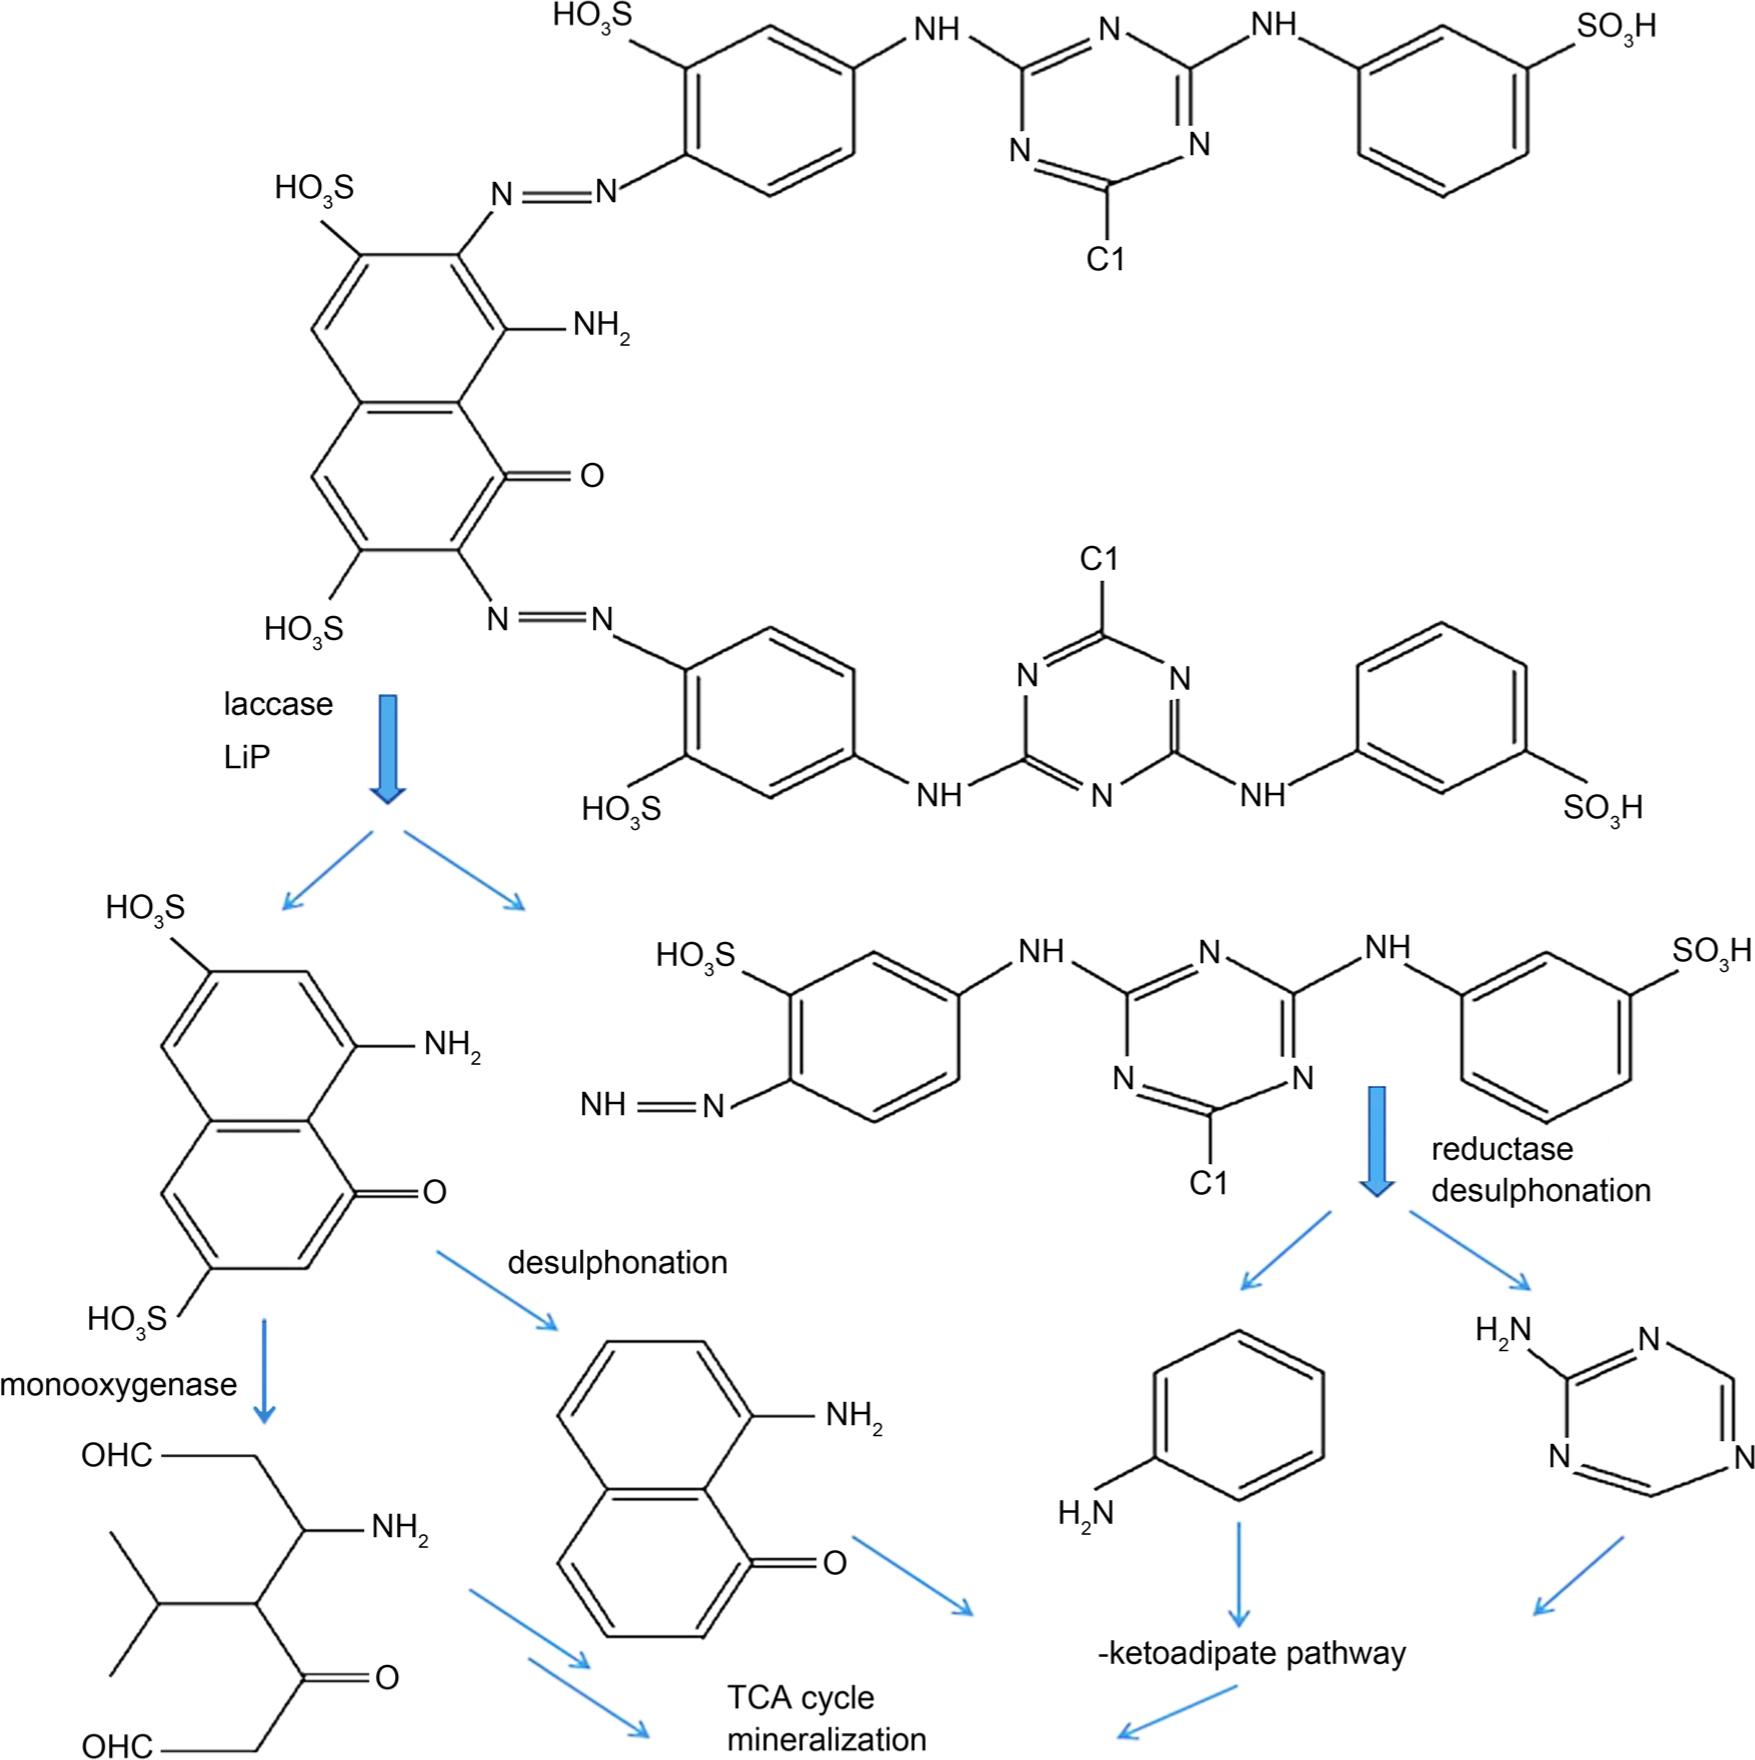
Fig. 4.
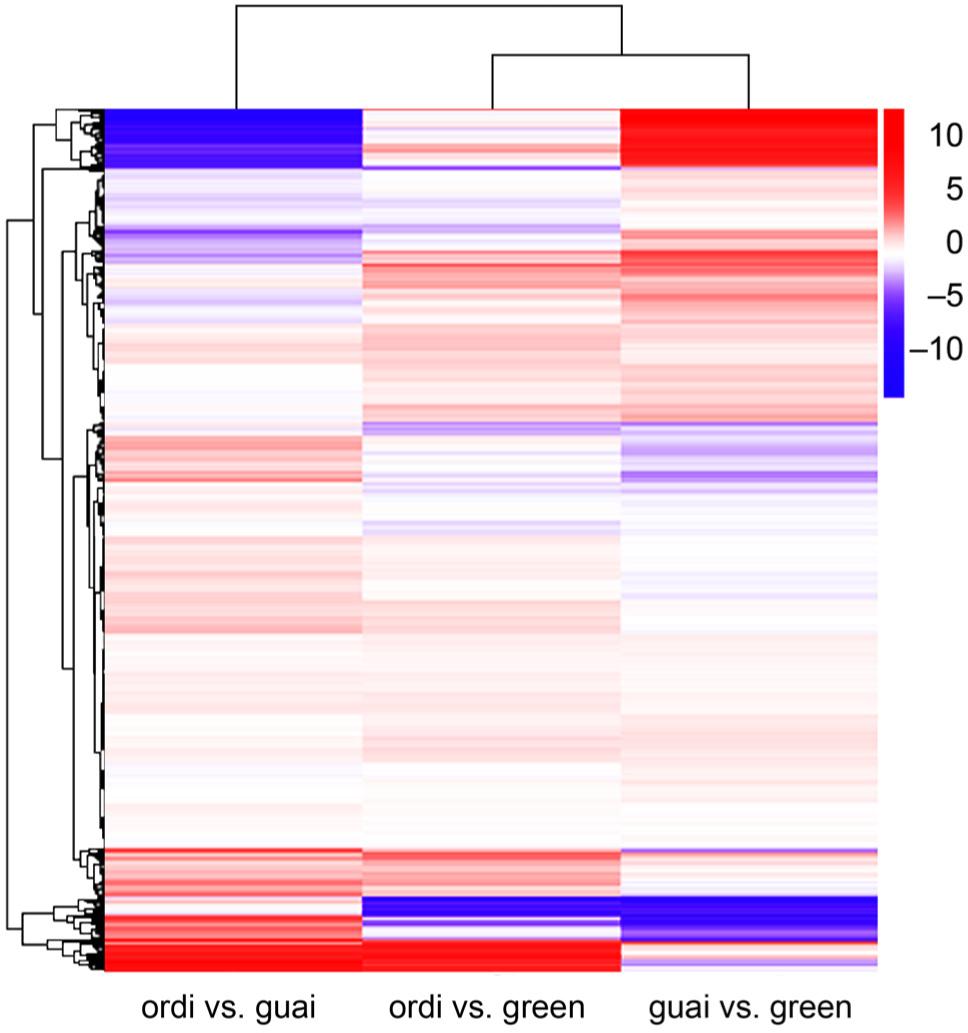
Fig. 5.
Enzyme activities of M_ verrucaria strain DJTU-sh7 in decolorizing RG19_
| Enzyme (U/ml) | RG19 addition | No RG19 | ||
|---|---|---|---|---|
| Intracellular | Extracellular | Intracellular | Extracellular | |
| Laccase | ND | 26.241 ± 0.760* | ND | 17.108 ± 0.895 |
| Lignin peroxidase | 0.164 ± 0.006^ | 0.120 ± 0.006^ | 0.152 ± 0.017 | 0.097 ± 0.002 |
| Mn peroxidase | ND | ND | ND | ND |
| Tyrosinase | 45.000 ± 3.000^ | 38.667 ± 8.386^ | 42.333 ± 6.429 | 33.667 ± 2.309 |
| Aryl alcohol oxidase | 14.093 ± 0.056* | 5.900 ± 0.001* | 5.244 ± 0.056 | 3.572 ± 0.056 |
| Ferric reductase | 7.845 ± 0.137** | 11.788 ± 0.182* | 6.849 ± 0.068 | 9.000 ± 0.182 |
| Azo reductase | 22.853 ± 0.544^ | 12.696 ± 0.670^ | 23.242 ± 0.155 | 12.204 ± 0.432 |
| NADH-DCIP reductase | 3.644 ± 1.547^ | 8.926 ± 0.696^ | 2.603 ± 1.610 | 7.550 ± 2.260 |