
Table I
Susceptibility profiles of 20 clinical A. baumannii isolates.
| Antibiotics | Susceptible | Resistant | ||
|---|---|---|---|---|
| Number | Rate (%) | Number | Rate (%) | |
| Amikacin | 3 | 15.0% | 17 | 85.0% |
| Ceftazidime | 0 | 0.0% | 20 | 100% |
| Ciprofloxacin | 0 | 0.0% | 20 | 100% |
| Levofloxacin | 0 | 0.0% | 20 | 100% |
| Gentamicin | 0 | 0.0% | 20 | 100% |
| Tobramycin | 3 | 15.0% | 17 | 85.0% |
| Ceftriaxone | 0 | 0.0% | 20 | 100% |
| Cefotaxime | 0 | 0.0% | 20 | 100% |
| Cefepime | 0 | 0.0% | 20 | 100% |
| Imipenem | 0 | 0.0% | 20 | 100% |
| Meropenem | 0 | 0.0% | 20 | 100% |
| Trimethoprim/sulfamethoxazole | 6 | 30.0% | 14 | 100% |
| Piperacillin/tazobactam | 0 | 0.0% | 20 | 100% |
| Tigecycline | 20 | 100% | 0 | 0.0% |
| Polymyxin B | 20 | 100% | 0 | 0.0% |
Table II
Susceptibility profiles of the airborne and clinical strains with the highest similarity.
| Strain / Antibiotics | TAaba004 | TAaba012 |
|---|---|---|
| Amikacin | R | R |
| Ceftazidime | R | R |
| Ciprofloxacin | R | R |
| Levofloxacin | R | R |
| Gentamicin | R | R |
| Tobramycin | R | R |
| Ceftriaxone | R | R |
| cefotaxime | R | R |
| Cefepime | R | R |
| Imipenem | R | R |
| Meropenem | R | R |
| Trimethoprim/sulfamethoxazole | R | R |
| Piperacillin/tazobactam | R | R |
| Tigecycline | S | S |
| Polymyxin B | S | S |
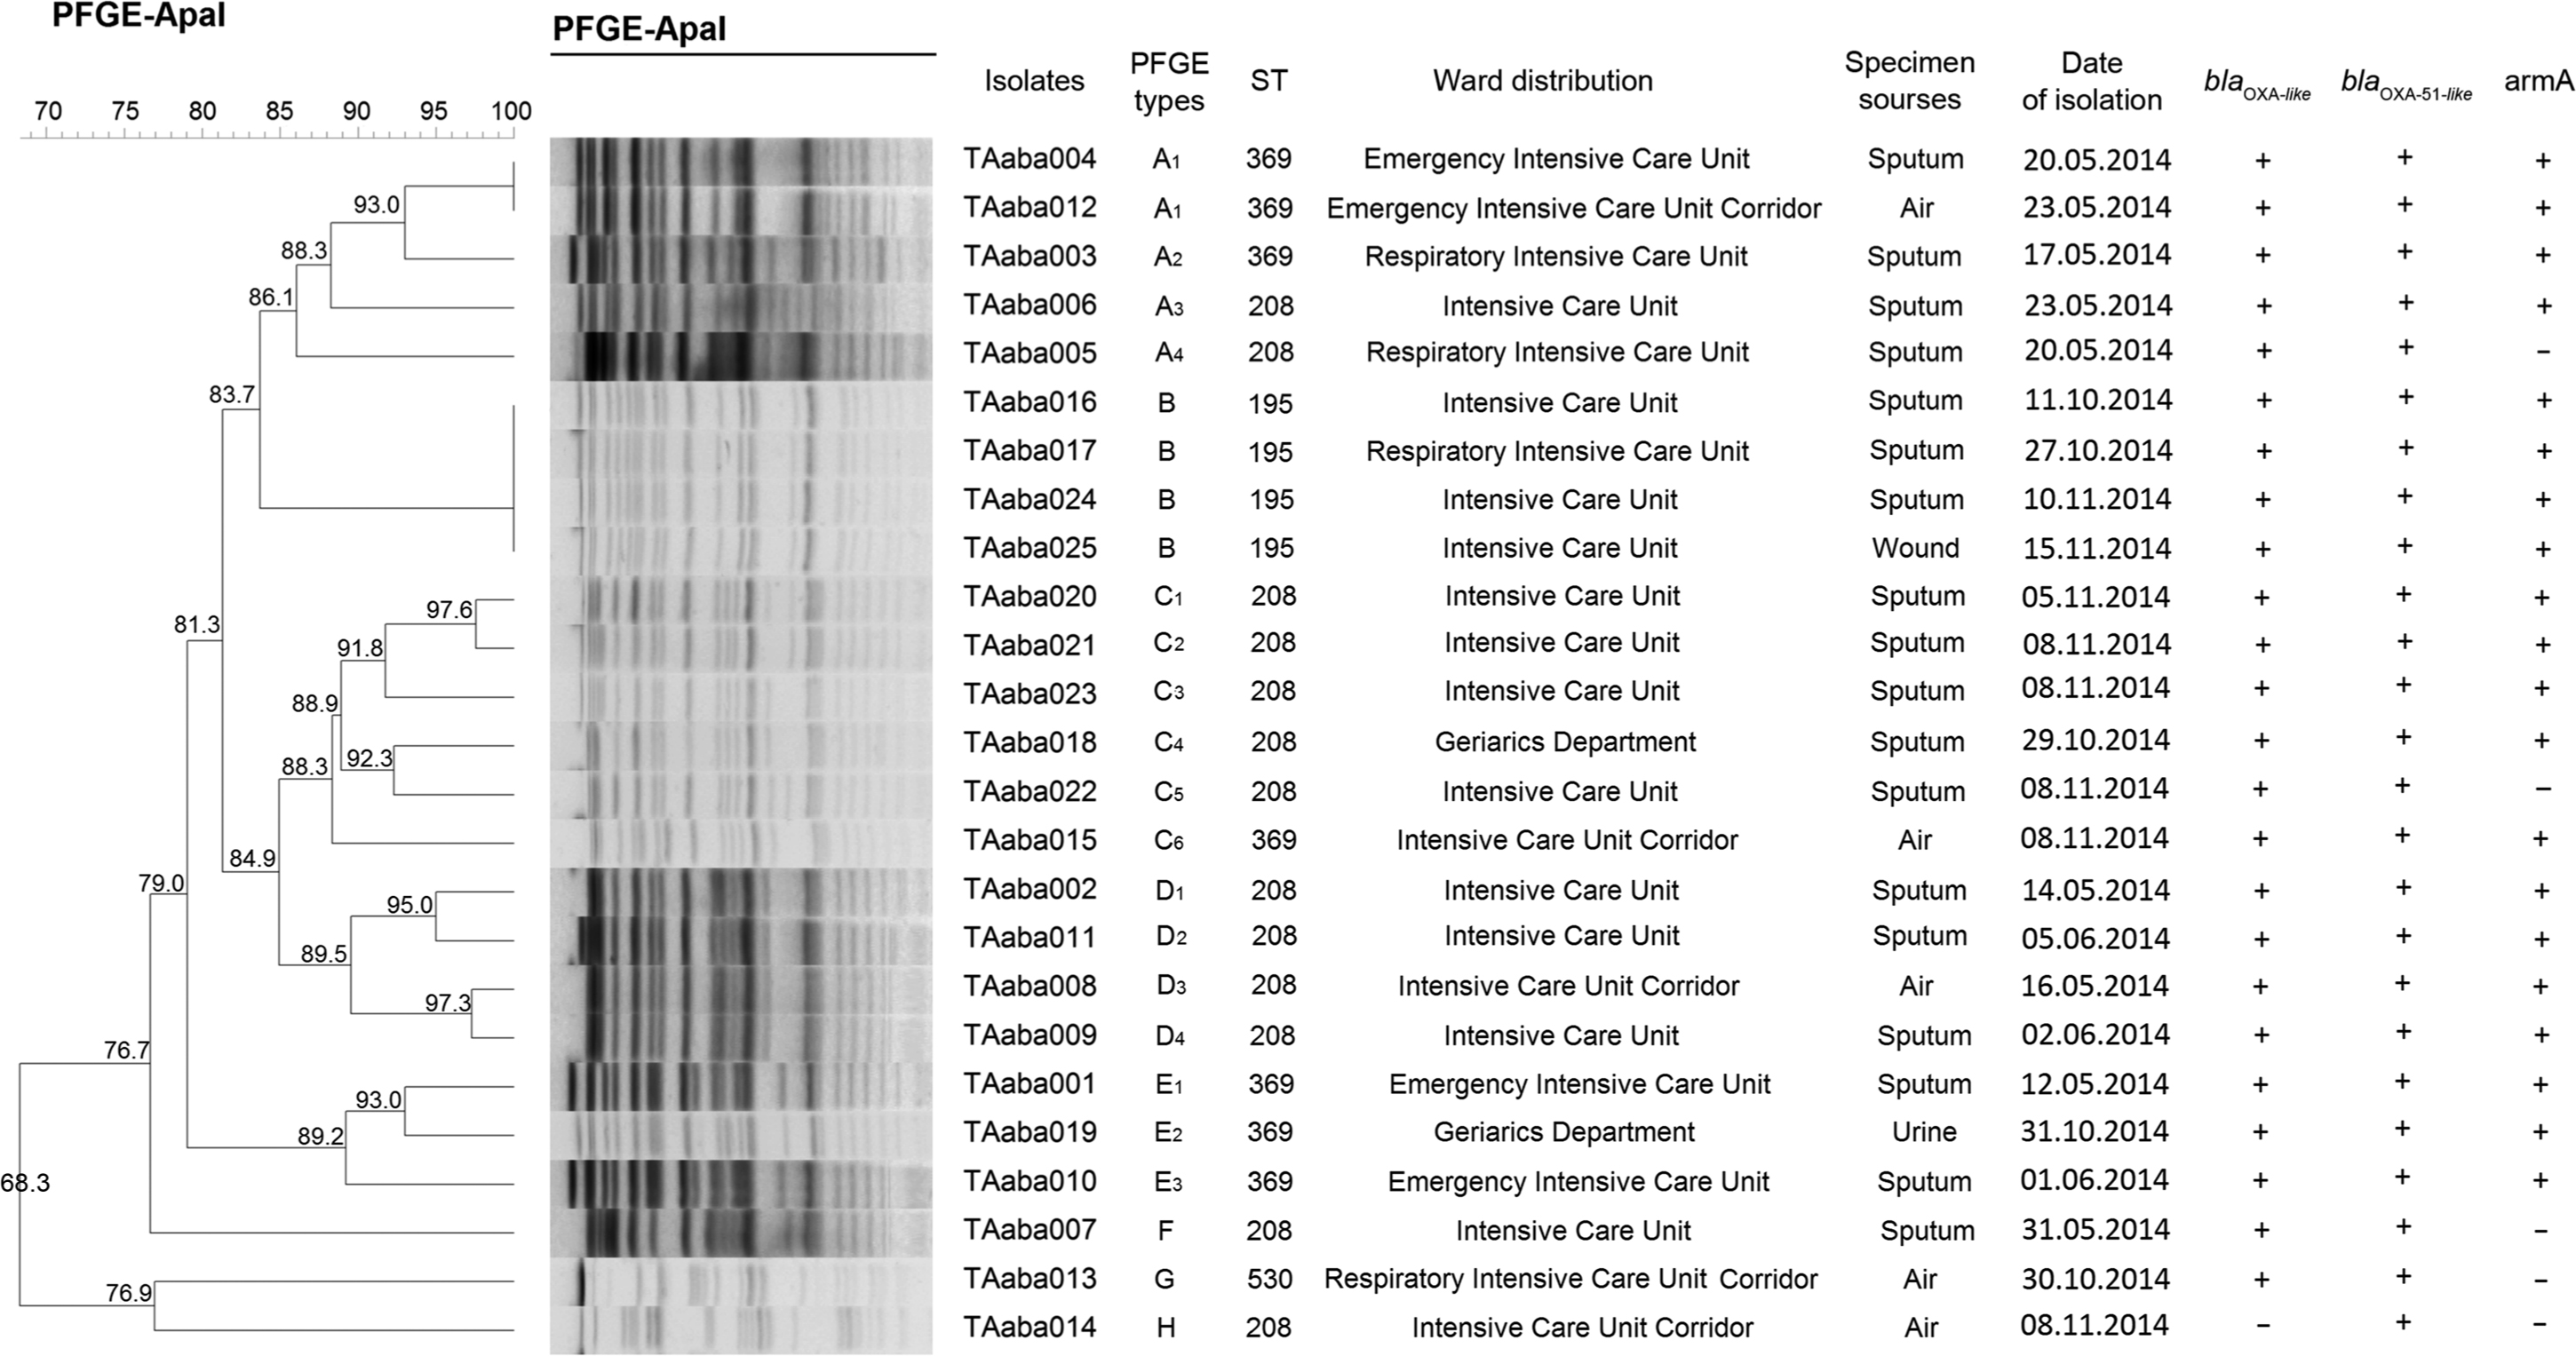
Fig. 1.
Dendrogram showing the PFGE and MLST profiles of the A. baumannii isolates. The dendogram was generated by the BioNumerics software. The sampling date, isolate number, ward and source, PFGE and ST types and resistance genes are shown for each isolate.