
Table 1.
In vitro parameters for hypothermically stored RBC units post-deglycerolization using the ACP 215 after manual removal of excess glycerol before processing
| Length of hypothermic storage post-deglycerolization | ||||||
|---|---|---|---|---|---|---|
| McLeod (n = 1) | Control group (n = 3) | |||||
| Parameter | 1 day | 7 days | 14 days | 1 day | 7 days | 14 days |
| RBC hemolysis (%) Mean (SD) | 0.23 | 0.48* | 0.55 | 0.19 (0.02) | 0.31 (0.02) | 0.52 (0.10) |
| ATP (µmol/g Hgb) Mean (SD) | 4.196* | 2.150 | 1.432 | 3.735 (0.223) | 2.617 (0.512) | 1.816 (0.349) |
| MCF (g/L NaCl) † Mean (SD) | 6.104 | 5.986 | 5.918 | 5.541 (0.688) | 5.504 (0.656) | 5.473 (0.653) |
| Supernatant K+ (µmol/L) Mean (SD) | 5.2* | 15.0 | 20.6 | 3.7 (0.5) | 13.2 (1.1) | 18.8 (1.6) |
| MCV (fL) Mean (SD) | 85.1* | 84.9 | 86.3 | 104.1 (9.3) | 98.4 (8.7) | 98.4 (8.4) |
1* Indicates when the unit of McLeod red blood cells (RBCs) is >2 standard deviations (SDs) from the control group at the same storage time point.
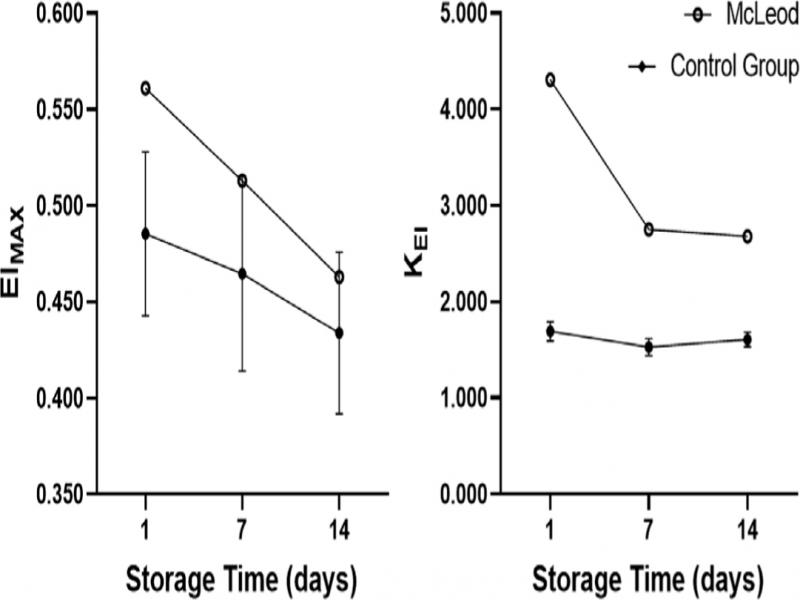
Fig. 1.
Red blood cell (RBC) deformability represented by two index parameters: EIMax, the maximum elongation of RBCs under sheer stress, and KEI, a measure of rigidity, represented by the sheer stress required to reach half of the RBC maximum elongation. Data shown as mean ± 1 standard deviation for the control group (n = 3).
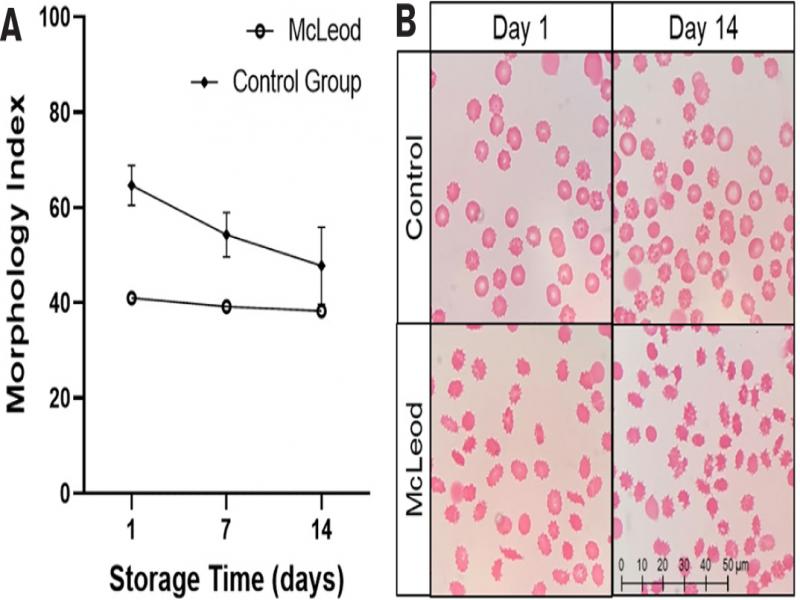
Fig. 2.
(A) Morphology index of red blood cells (RBCs) stored for up to 14 days post-deglycerolization at 1–6°C. Data shown as mean ± 1 standard deviation for the control group (n = 3). (B) Microscopic images of RBC morphology at 1 and 14 days of hypothermic storage post-deglycerolization from thin smear slide preparations. The control images are from a representative sample taken from preparations of 1 RBC unit from the control group. The control unit images contain RBCs undergoing various states of crenation due to the hypothermic storage lesion, which should not be confused with pathologic acanthocytosis. RBCs from both the control and McLeod units will naturally undergo crenation, which may obscure or artificially increase the degree of acanthocytosis in the McLeod sample.