
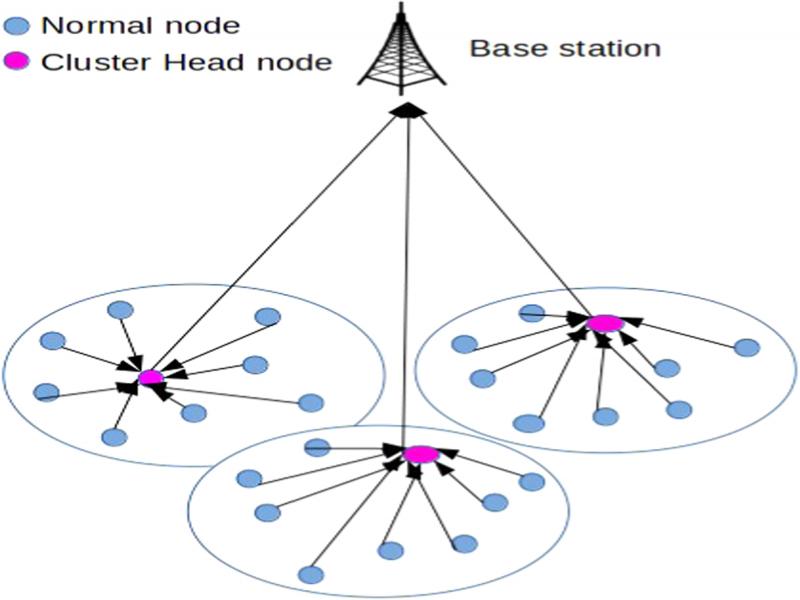
Figure 1:
Structure of the LEACH Protocol.
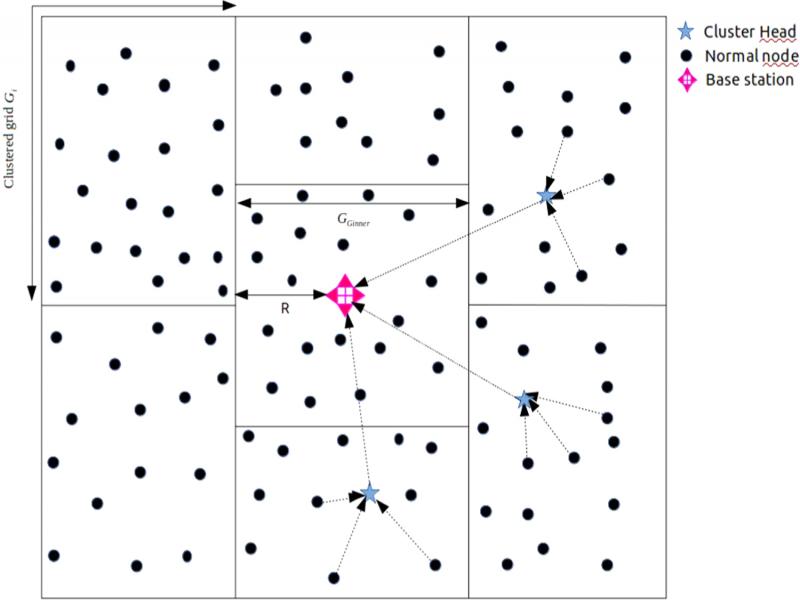
Figure 2:
A WSN model with grid clustering hierarchy.
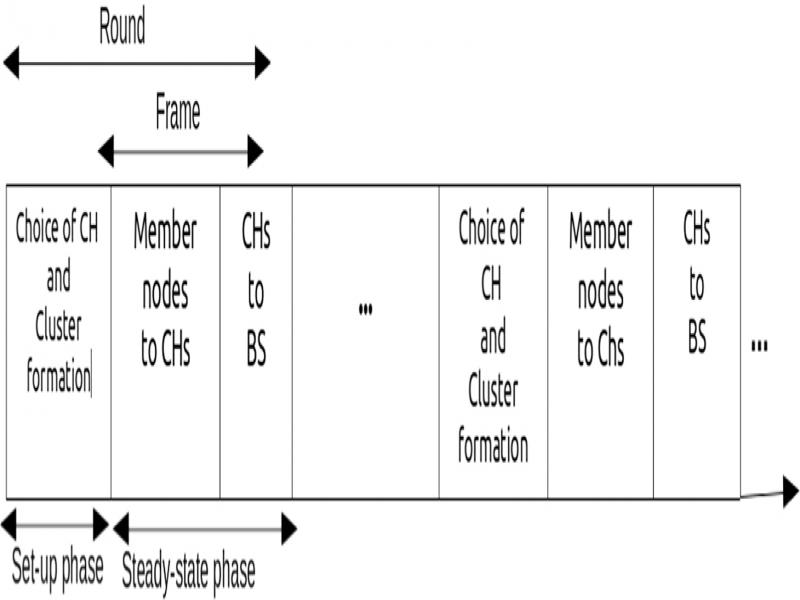
Figure 3:
Timeline for a basic clustering Protocol.
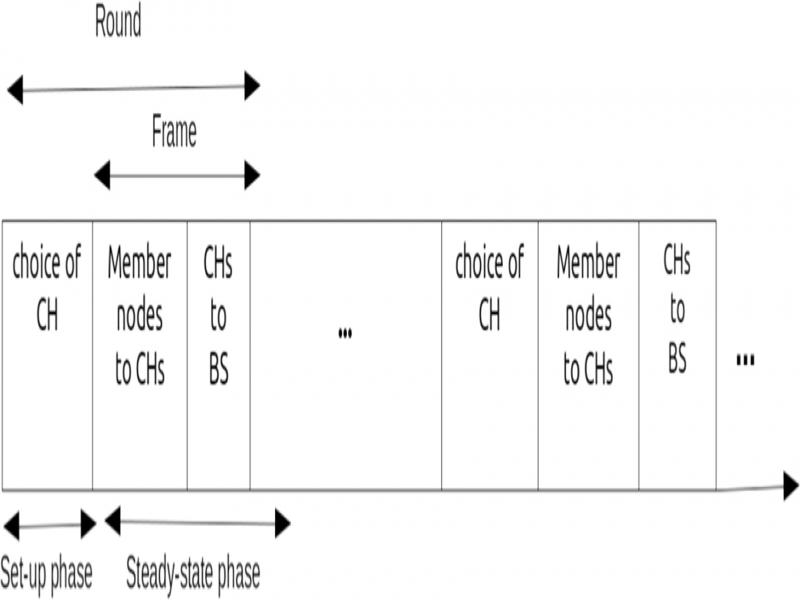
Figure 4:
Timeline for EAC-ECHS clustering Protocol.
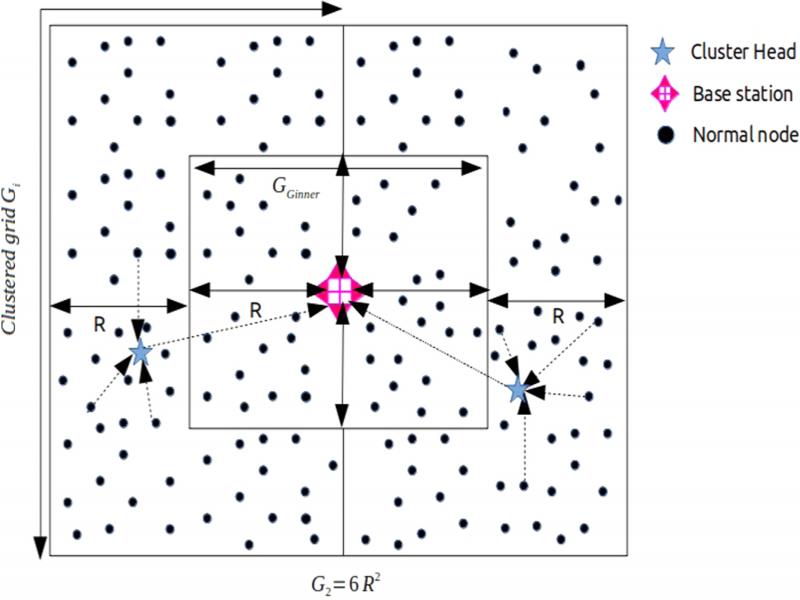
Figure 5:
The subdivisions of the network area into 2 grids.
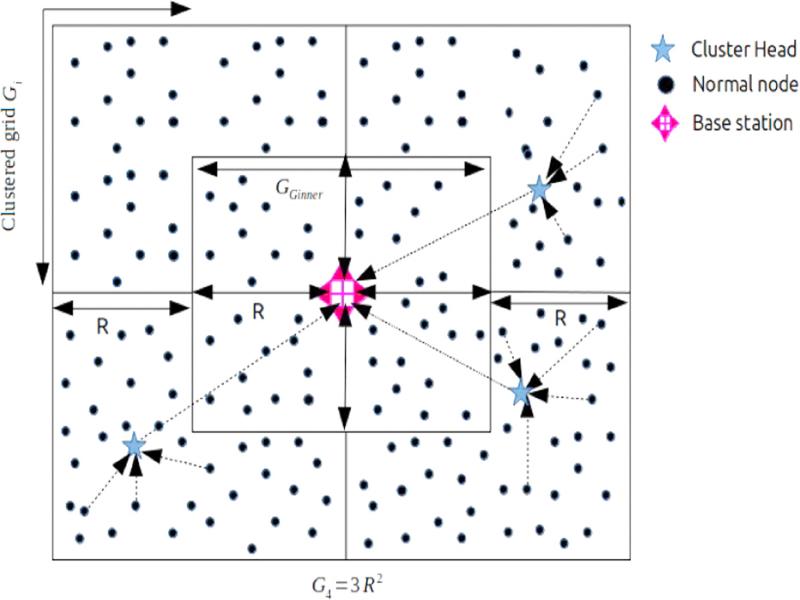
Figure 6:
The subdivisions of the network area into 2 grids.
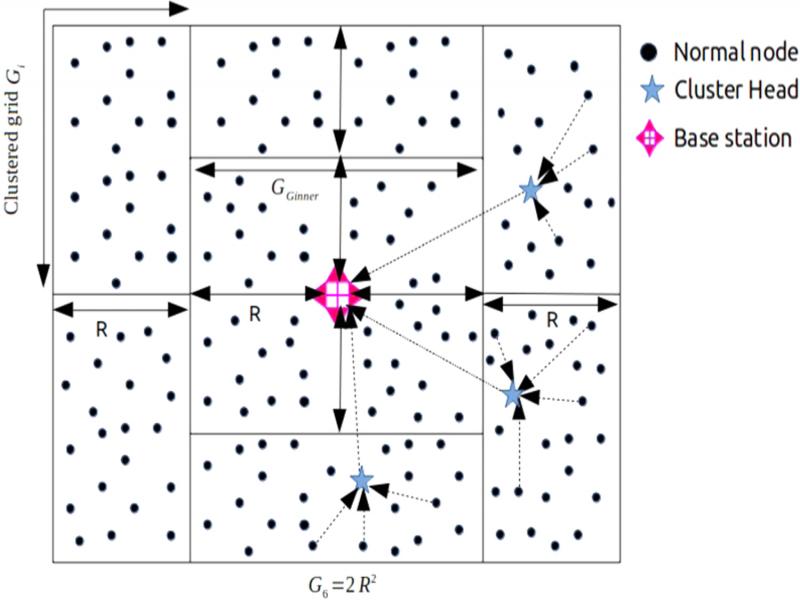
Figure 7:
The subdivisions of the network area into 2 grids.
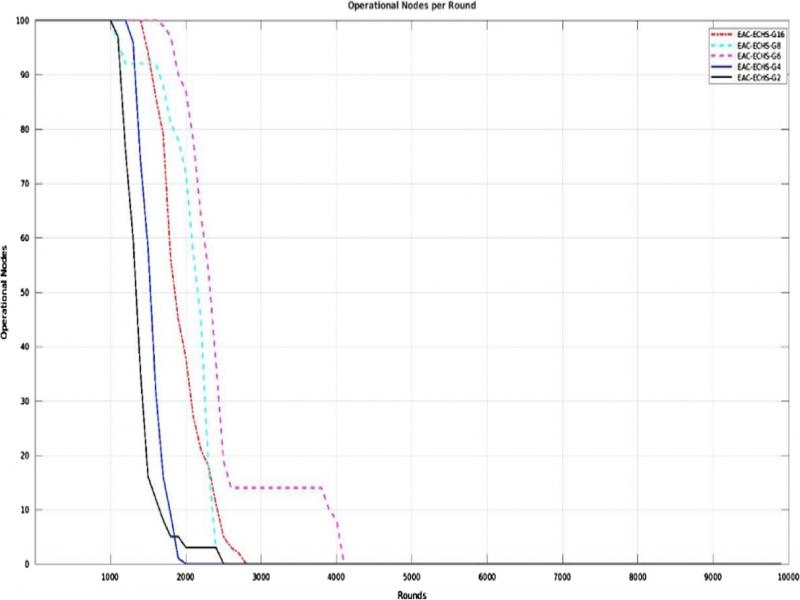
Figure 8:
Comparison to the network lifetime for different division.
Figure 9:
First parquet format.
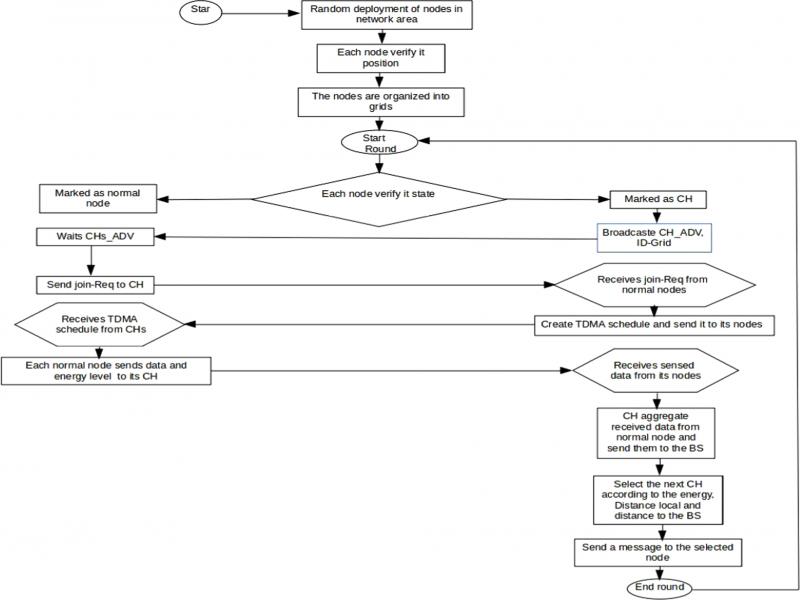
Figure 10:
Flow of the proposed EAC-ECHS Protocol.
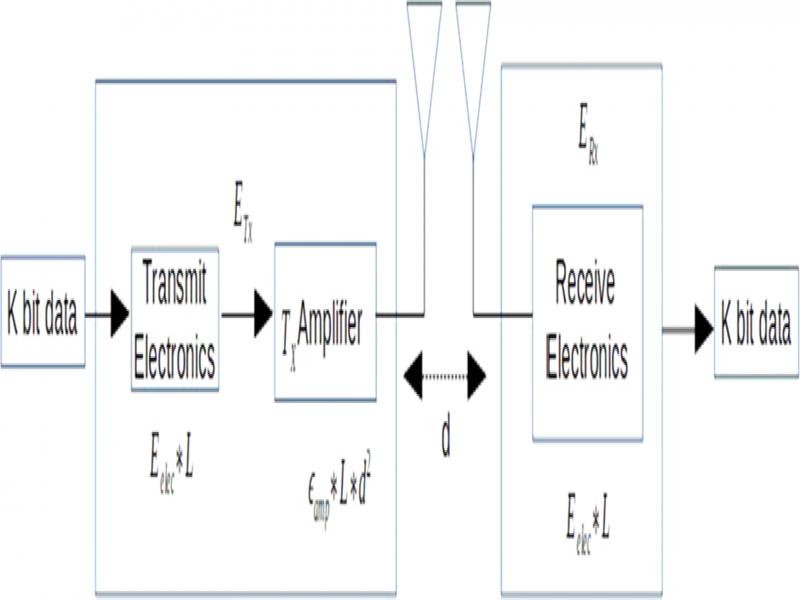
Figure 11:
Radio dissipation model.
Table 1.
Simulation parameters.
| Type | Parameter | Value |
|---|---|---|
| Network topology | Network field | 100 m × 100 m |
| Number of nodes | 100 | |
| Base station location | (50, 50) | |
| Initial energy | 0.5 J | |
| Node setting | Energy consumption for sensing, fusion, and sleeping | ~0 J (ignored) |
| Eelec | 50 nJ/bit | |
| First-order radio model | εfs | 10 pJ/bit/m2 |
| εmp | 0.0013 pJ/bit/m4 | |
| Data | Data size | 4000 bits |
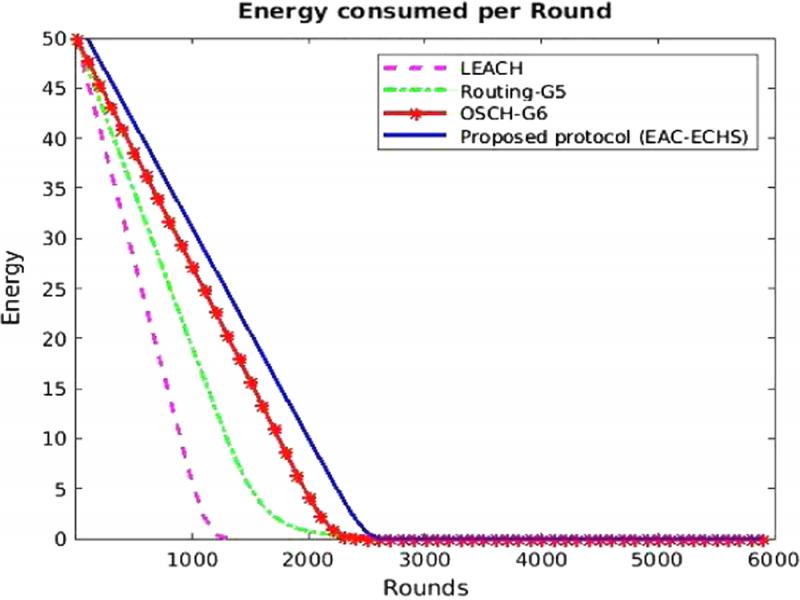
Figure 12:
The energy consumption for different clustering approaches compared with proposed.
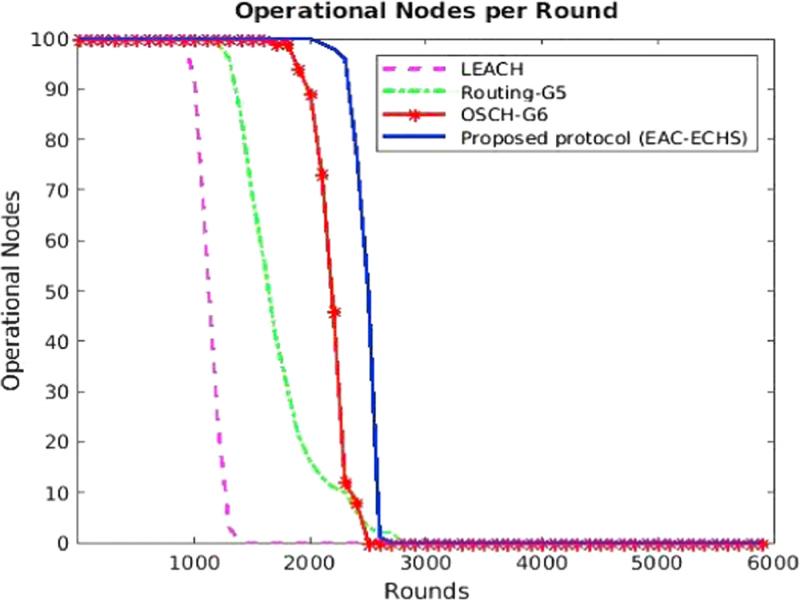
Figure 13:
The network lifetime for different clustering approaches compared with proposed method.
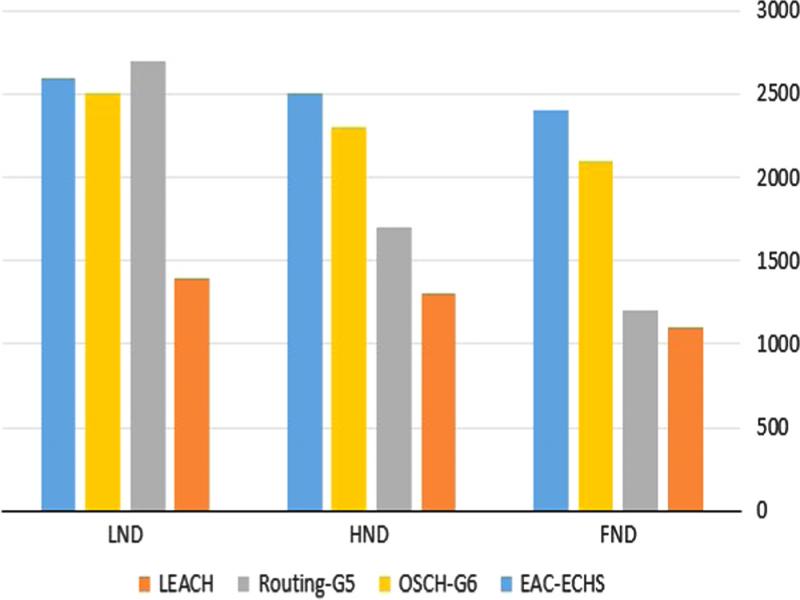
Figure 14:
Comparison of nodes die with respect to FND, HND, and LND for the different algorithms.
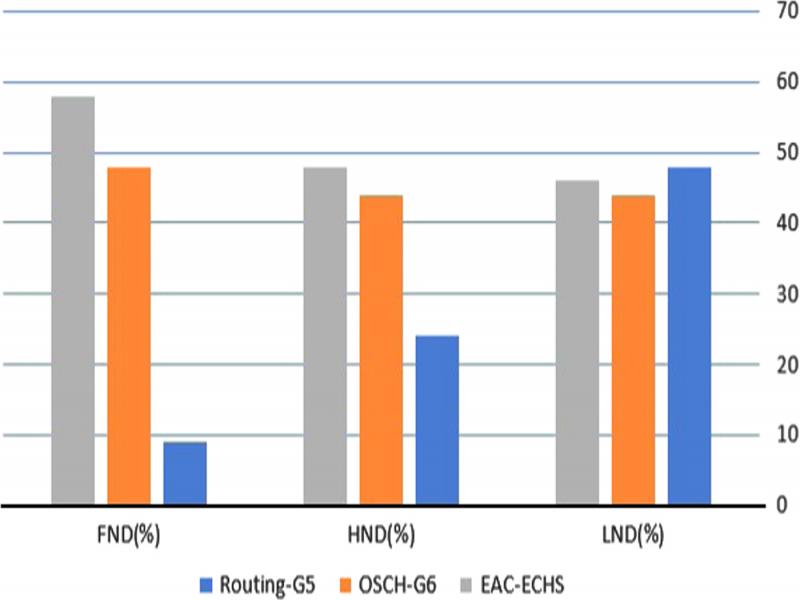
Figure 15:
Percentage improvement compared with LEACH with respect to FND, HND, and LND for the different algorithms.
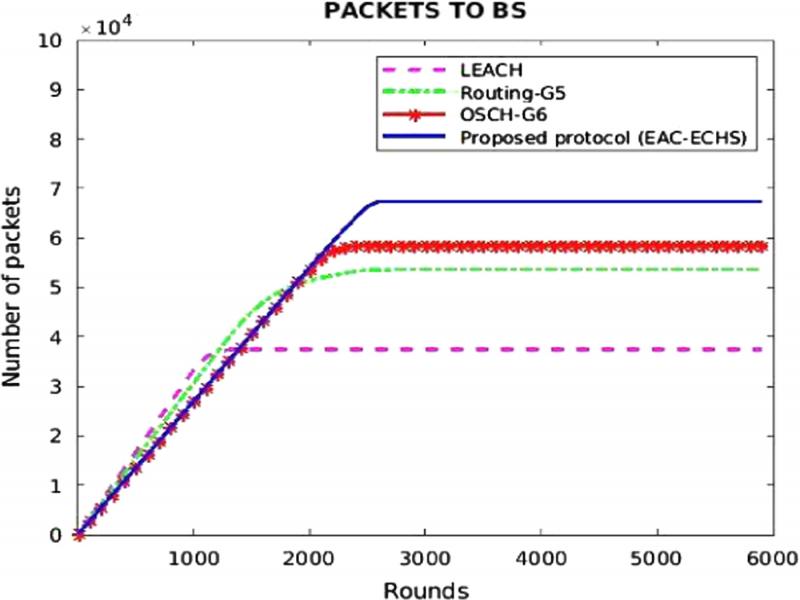
Figure 16:
Packets received by BS in LEACH, Routing-G5, OSCH-G6 and proposed protocol.
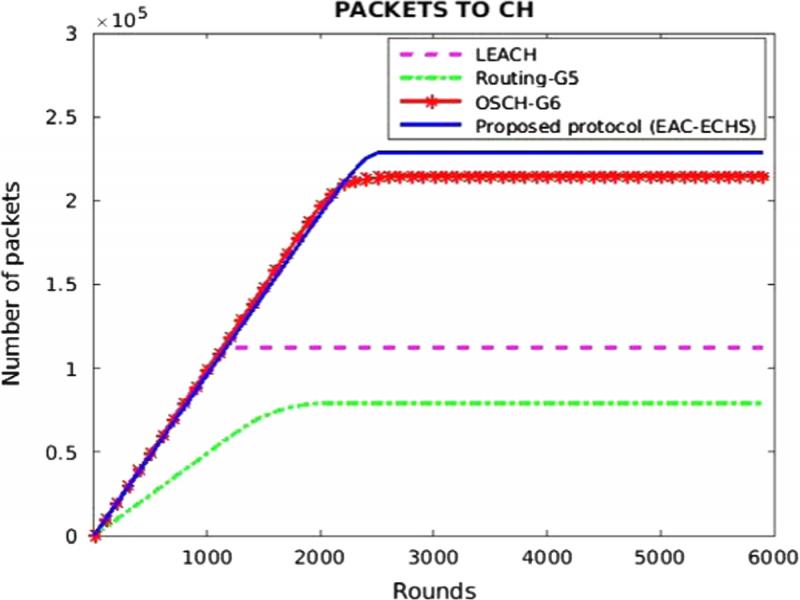
Figure 17:
Packets received by CH in LEACH, Routing-G5, OSCH-G6 and proposed protocol.