
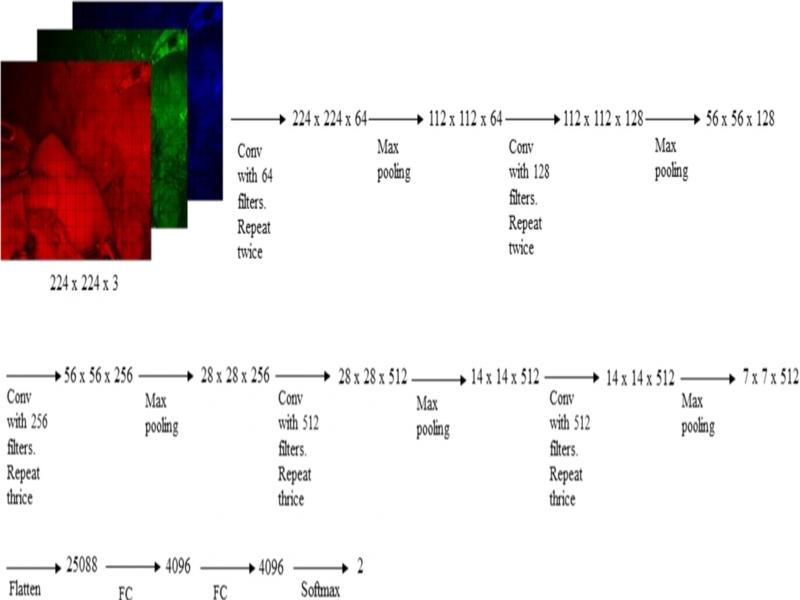
Figure 1:
VGG-16 network used for classification.
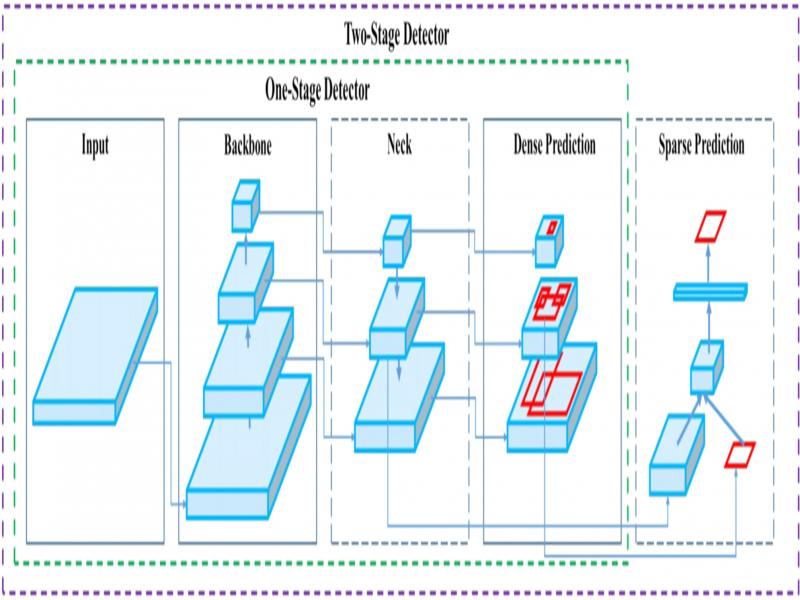
Figure 2:
Object detection stages (Bochkovskiy et al., 2020).
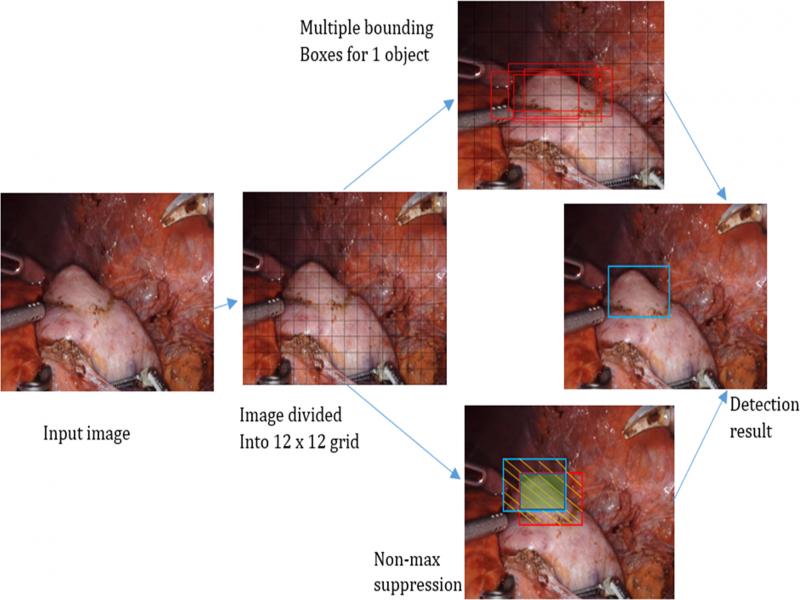
Figure 3:
Object detection stages of YOLOv3 and YOLOv4.
Table 1.
Institutions that produced the videos.
| Source | Country | State |
|---|---|---|
| Brigham and Women’s Hospital | USA | Massachusetts |
| Seattle Science Foundation | USA | Washington |
| Pacific Northwest Urology specialist | USA | Washington |
| Vattikuti Foundation | USA | Michigan |
| Urologic Surgeons of Washington | USA | Washington |
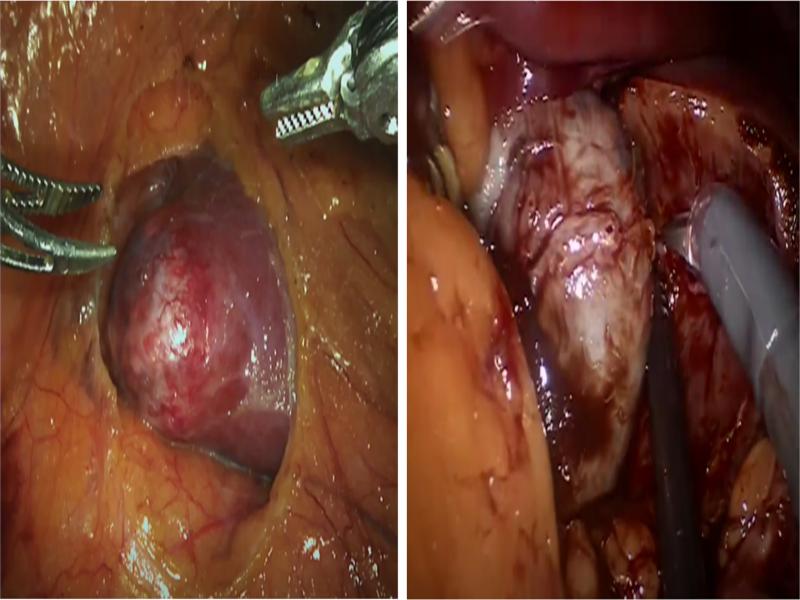
Figure 4:
Cropped photo from the surgical video. Contains tumor, portions of kidney, portions of fatty tissue (Abaza, 2020a, b; P. N. U. Specialist, n.d.).
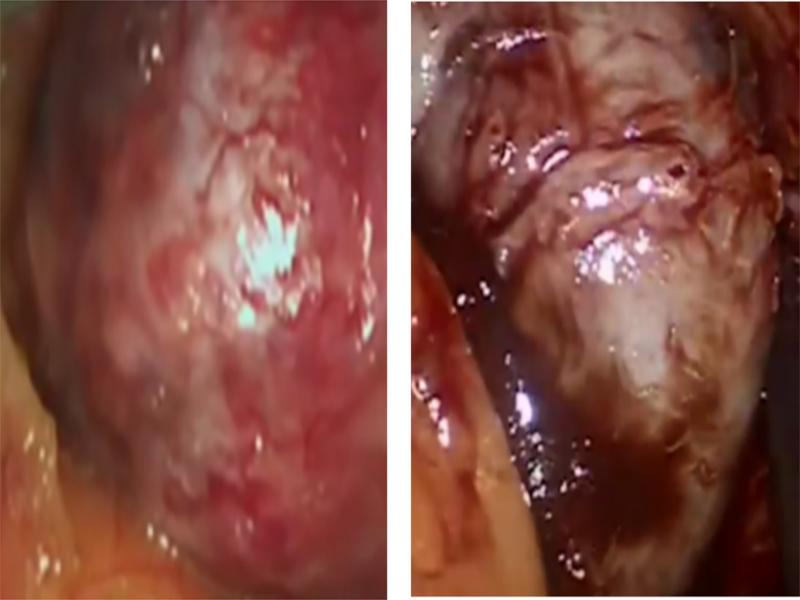
Figure 5:
Tumors cropped from Figure 3 (Abaza, 2020a, b; P. N. U. Specialist, n.d.).
Table 2.
Train, validation, test division.
| Dataset | Label | Training | Validation | Test |
|---|---|---|---|---|
| 1st dataset | Cancerous tissue | 30 | 9 | 5 |
| Non-cancerous tissue | 40 | 13 | 9 | |
| Fatty tissue | 21 | 10 | 6 | |
| 2nd dataset | Cancerous tissue | 105 | 9 | 5 |
| Non-cancerous tissue | 105 | 13 | 9 | |
| Fatty tissue | 105 | 10 | 6 | |
| 3rd dataset | Cancerous tissue | 150 | 9 | 5 |
| Non-cancerous tissue | 150 | 23 | 15 |
Table 3.
Result comparison.
| Detection algorithm | Precision | Recall | Mean average precision | Frames per second |
|---|---|---|---|---|
| YOLOv3 on virtual machine | 0.88 | 0.62 | 0.758 | Not applicable |
| YOLOv4 on windows | 0.98 | 0.99 | 0.974 | 21.4 |
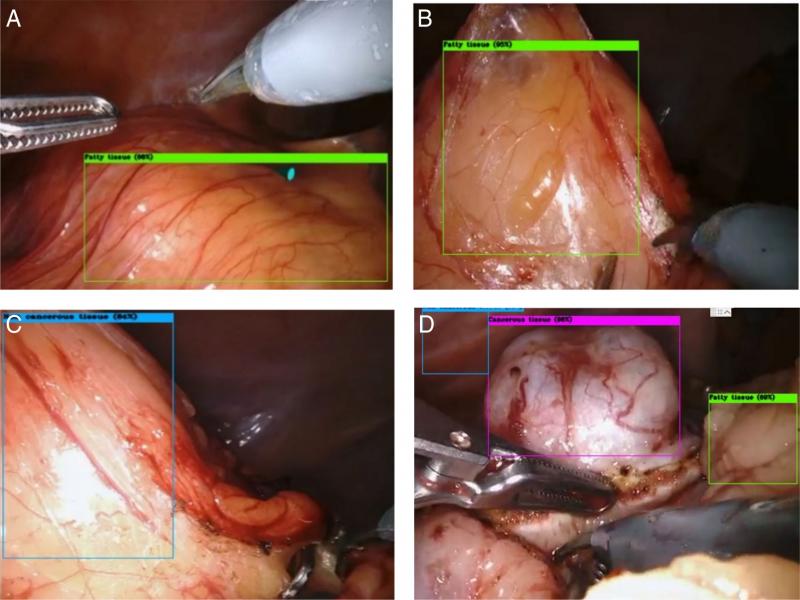
Figure 6:
Tumor detection on windows machine on videos (A) fatty tissue, (B) fatty tissue, (C) non-cancerous tissue, (D) cancerous tissue, non-cancerous tissue, fatty tissue.
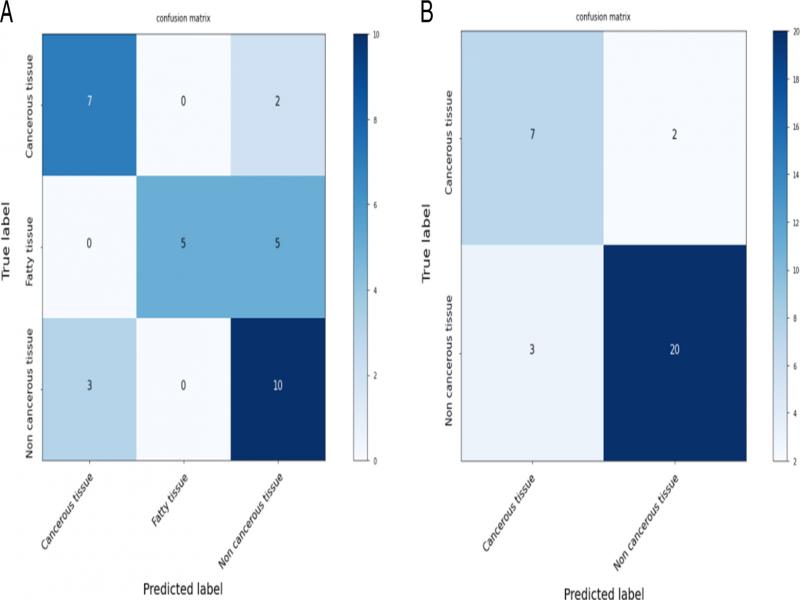
Figure 7:
(A) VGG-16 2nd dataset, lower lr, Dropout 0.5, callback (B) VGG-16 3rd dataset, lower lr callback.
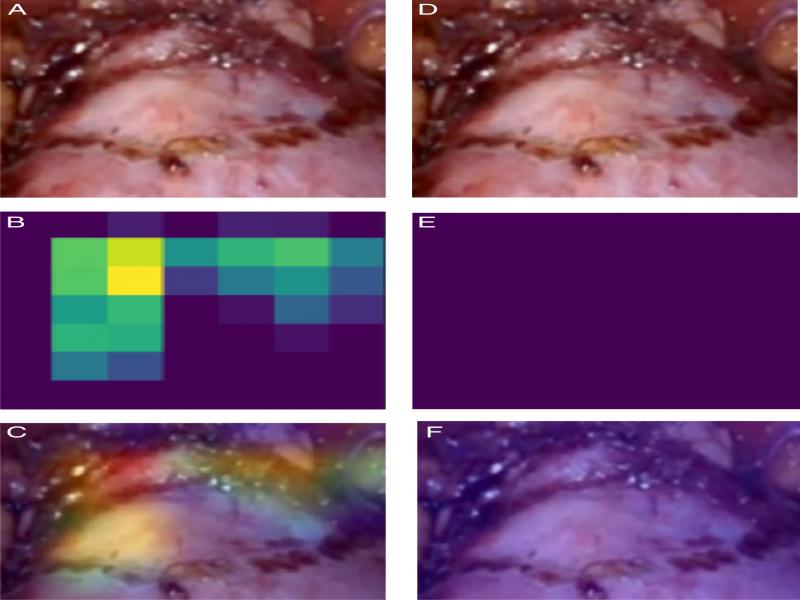
Figure 8:
Comparison of VGG-16 with lower lr, dropout, callback (left column) and VGG-16 with lower lr, callback (right column) for 5th dataset (3 class classification). (A) One of the images from the test set, (B) Coarse heatmap for the image from lower lr, dropout, callback, (C) Heatmap for the image from lower lr, dropout, callback. On the right column it was not detected. (D) The same image from the test set, (E) Network was not able to detect the image, that is why it is purple (F) No heatmap got detected on the image.
Table 4.
Comparison with other studies.
| Method | Image type | AI technique used | Total images (TI) | Evaluation metric | Validation performance (VP) | |
|---|---|---|---|---|---|---|
| Hadjiyski (2020) | CT scans | Inception v3 | 4,200 | AUC | 86% | 0.02 |
| Aubreville et al. (2020) | Whole Slide Images | RetinaNet with ResNet-50 | 13,907 | F1 score | 79.1% | 0.01 |
| Wang et al. (2018) | Multi parametric MRI | V-net | 79 cases in total. About 790 images | Accuracy | 89.4% | 0.11 |
| Chung et al. (2015) | Multi parametric MRI | SVM with RD-CRF | 20 cases in total. About 200 images | Accuracy | 59% | 0.29 |
| Brunese et al. (2020) | Chest X-ray | VGG-16 | 9,326 | Accuracy | 98% | 0.01 |
| Wu et al. (2021) | Chest CT scan | VGG-16 with segmentation | 3,855 | Sensitivity | 95% | 0.03 |
| This study | Live partial robotic nephrectomy | Object detection with VGG-16 | 143 | Accuracy | 84% | 0.59 |
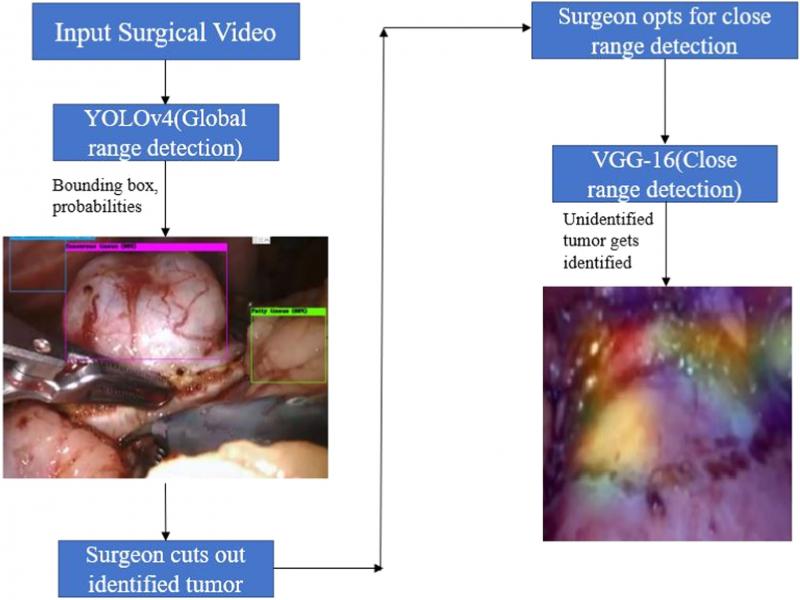
Figure 9:
Research methodology flowchart.