
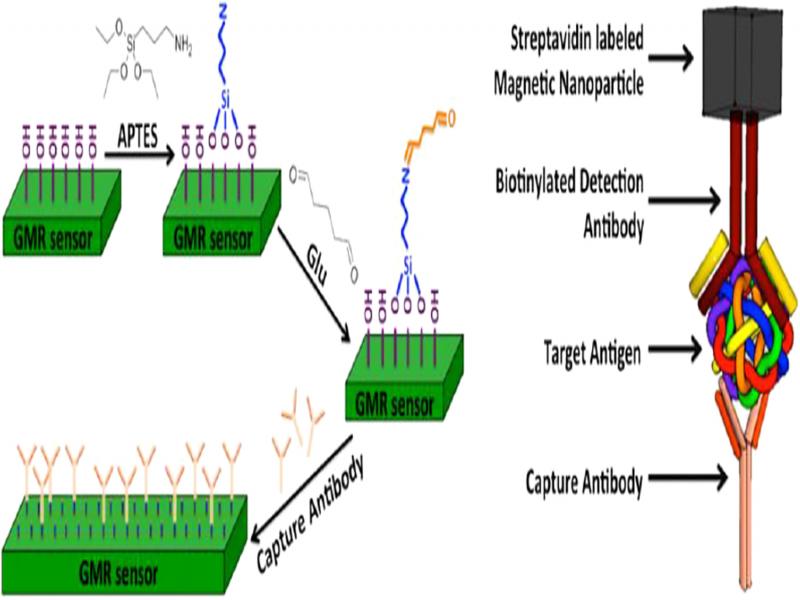
Figure 1:
Sandwich immunoassay mechanism of a GMR biosensor forming a capture antibody–target antigen–detection antibody–MNP complex (Wu et al., 2020).
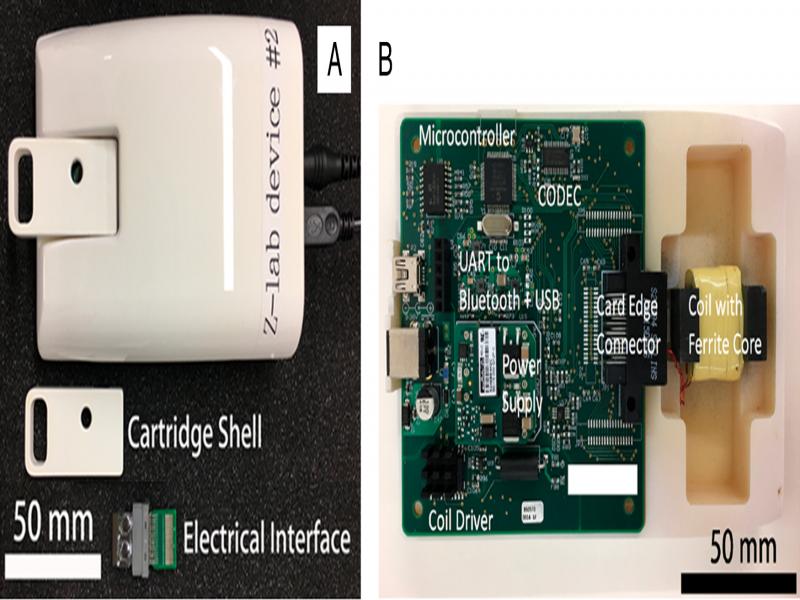
Figure 2:
Picture of the GMR-based hand-held device (a), and top view of the electronic section with highlighted the main components (b) (Wu et al., 2017, 2020).
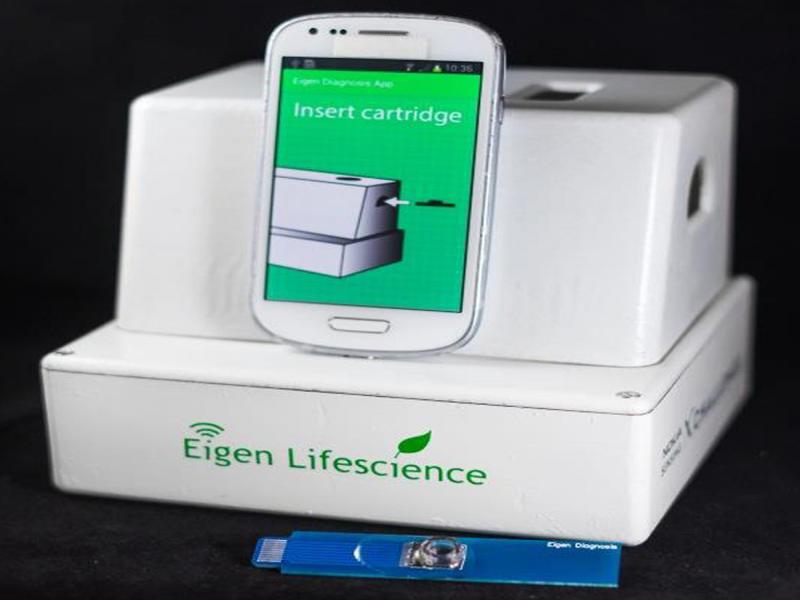
Figure 3:
Picture of GMR-based portable device reported by the researchers from Stanford University (Choi et al., 2016).
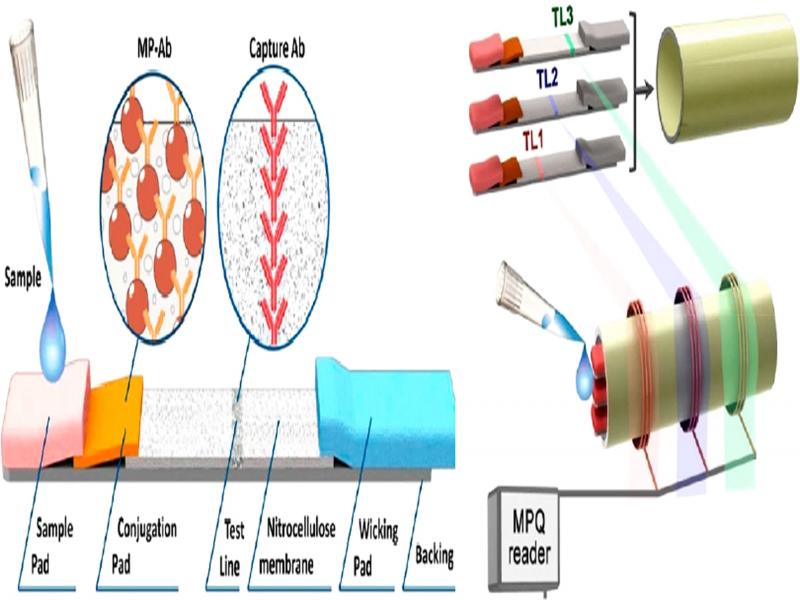
Figure 4:
Test-strip design and setup (Orlov et al., 2016).
Table 1.
Advantages and disadvantages of different magnetic nano-sensors technologies (Wu et al., 2020).
| Platform | Advantages | Disadvantages |
|---|---|---|
| GMR | High sensitivity | Multiple washing steps usually required, thus needing well-trained technicians, but can be wash-free, which reduces the sensitivity |
| Availability of a portable device | Time-consuming | |
| Mass production capability | High cost per test; nanofabrication of GMR biosensors required | |
| MTJ | High sensitivity | Multiple washing steps usually required, thus needing well-trained technicians, but can be wash-free, which reduces the sensitivity |
| Mass production capability | High noise; large distance from the MNP to the sensor surface | |
| Hard-to-acquire linear response | ||
| Complicated fabrication process | ||
| Time-consuming | ||
| High cost per test; nanofabrication of MTJ biosensors required | ||
| MPS, surface-based | High sensitivity | Multiple washing steps usually required, thus needing well-trained technicians, but can be wash-free, which reduces the sensitivity |
| Low cost per test | Time-consuming | |
| Availability of a portable device | ||
| MPS, volume-based | One-step wash-free detection allowed | Medium sensitivity |
| Immunoassays that can be hand-held by non-technicians | ||
| Low cost per test | ||
| Availability of a portable device | ||
| NMR | Availability of a portable device | Multiple washing steps usually required, thus needing well-trained technicians, but can be wash-free, which reduces the sensitivity |
| Time-consuming | ||
| Medium sensitivity |
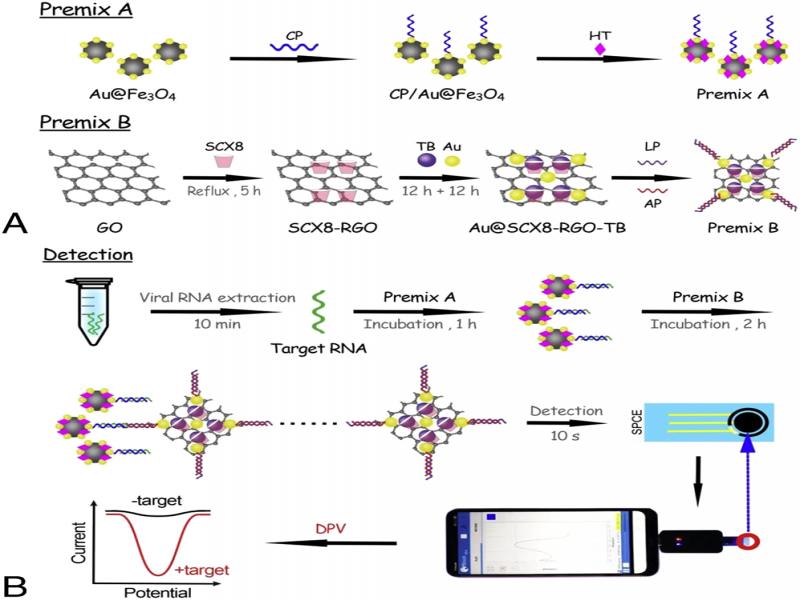
Figure 5:
Schematic representation of SARS-CoV-2 detection using the electrochemical biosensor. (a) Prepare the premix A and B; (b) Process of electrochemical detection using a smartphone (Zhao et al., 2021).
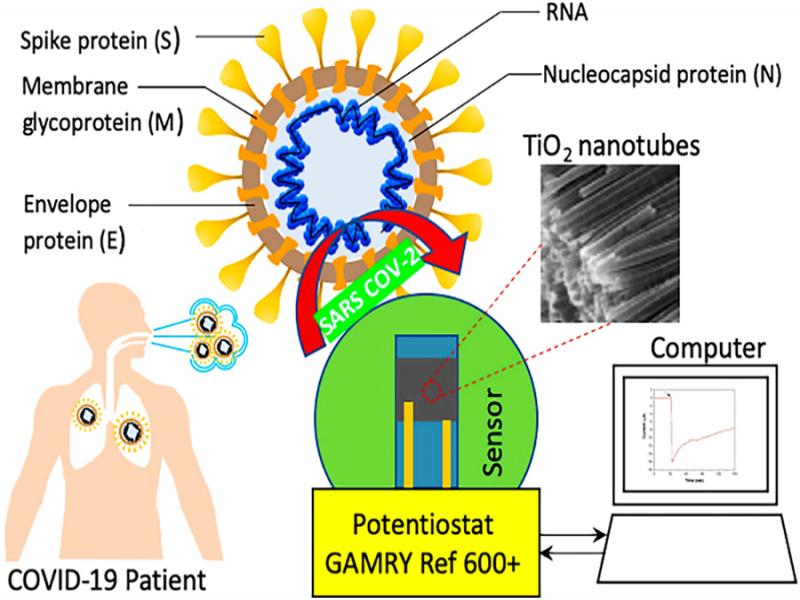
Figure 6:
Schematic of Co-functionalized TiO2 nanotube (Co-TNT)-based sensing platform for detecting SARS-CoV-2 (Vadlamani et al., 2020).
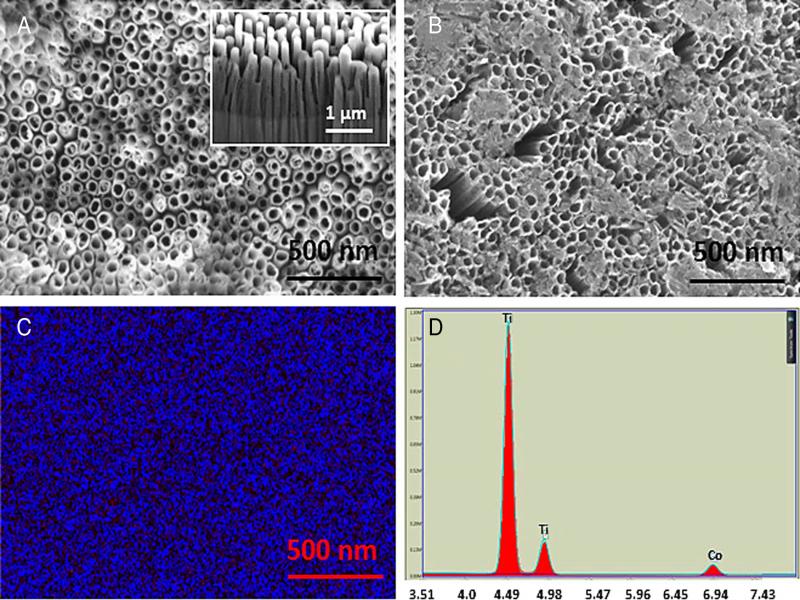
Figure 7:
Scanning electron microscopy (SEM) micrographs of (a) TiO2 nanotubes (TNTs) post-annealing. Inset shows sidewalls of TNTs, (b) Co-functionalized TNTs showing the Co (OH)2 precipitate, (c) EDS map of Co confirming its uniform distribution, and (d) EDS spectra confirming the presence of Co (Vadlamani et al., 2020).
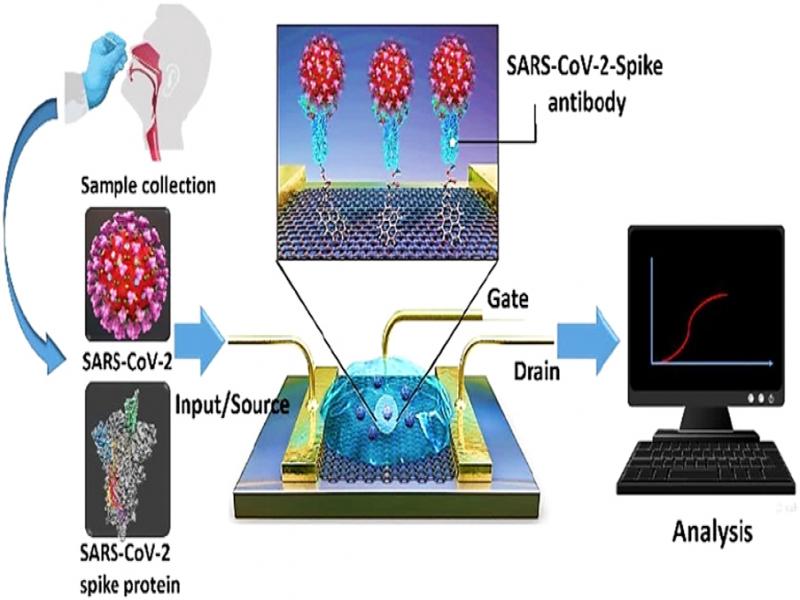
Figure 8:
Schematic diagram of COVID-19 FET-based biosensor operation (Seo et al., 2020).
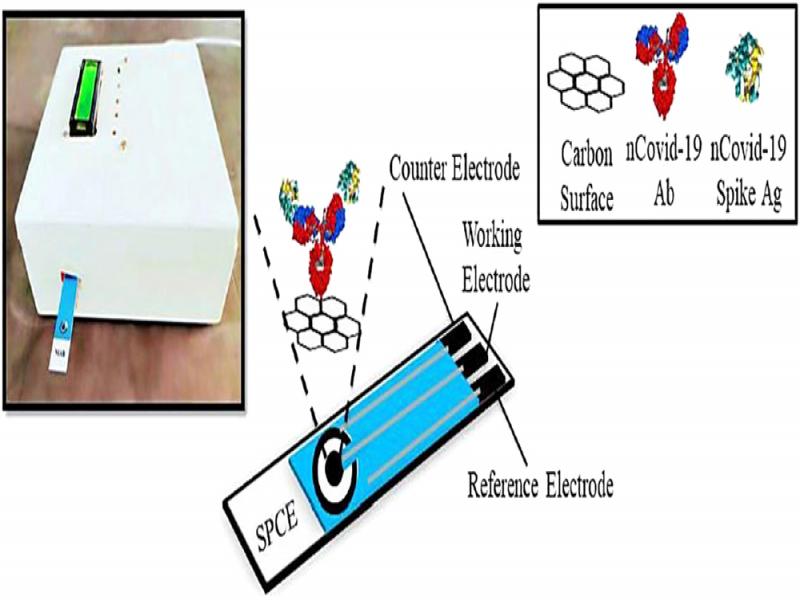
Figure 9:
Graphical representation of the working operation of the eCovSens device using SPCE electrode, including COVID-19 antibody (Mahari et al., 2020).
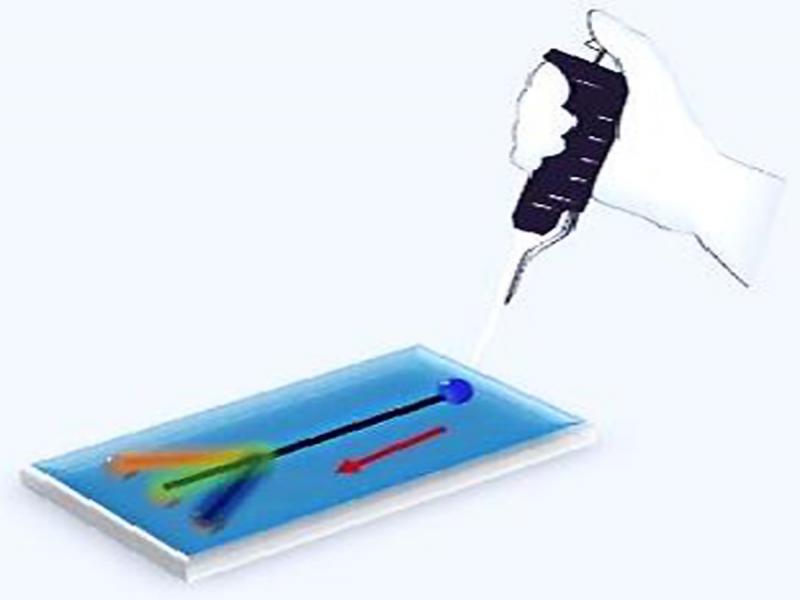
Figure 10:
DhITACT-TR chip for robust detection of target pathogen in a single-step injection of RNA extract (Samson et al., 2020).
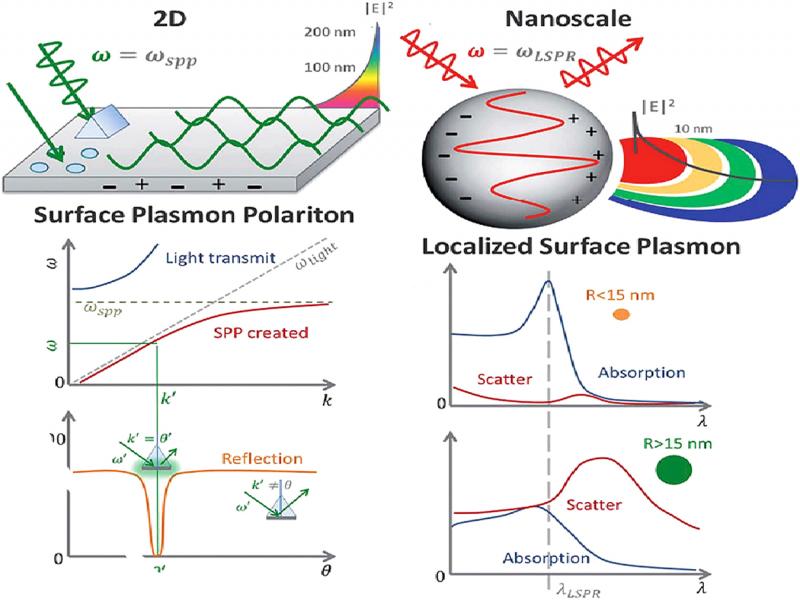
Figure 11:
The surface plasmon polariton (SPP) can only be excited at specific wave vectors and decays evanescently from the surface. The momentum-matching condition leads to the SPP resonance and only exists at certain incident angles (Li et al., 2015).
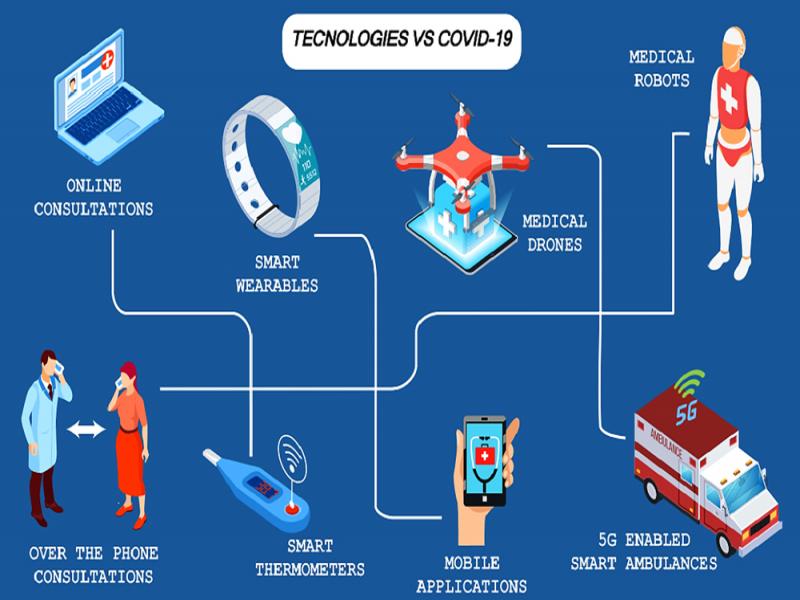
Figure 12:
Different technologies versus the COVID-19 (Chamola et al., 2020).
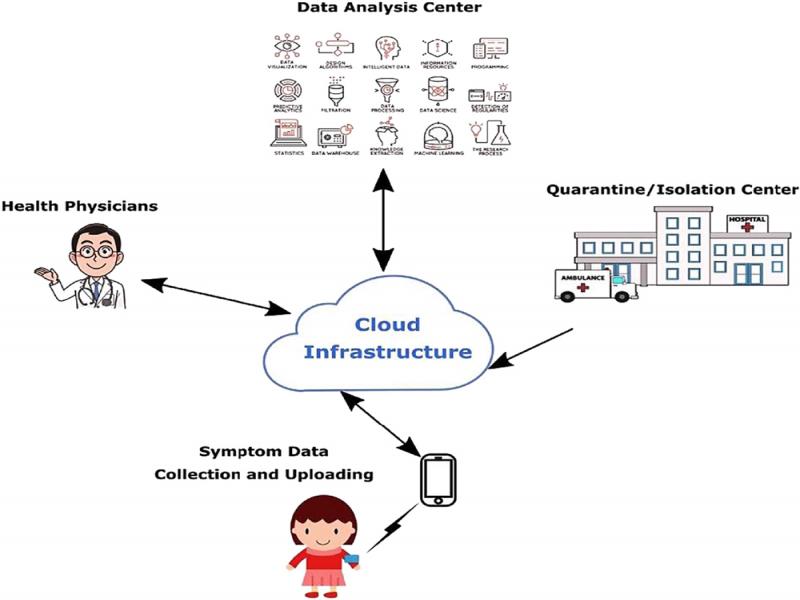
Figure 13:
Representation of IoT-based framework for early identification and monitoring of new cases of COVID-19 virus infections (Otoom et al., 2020).
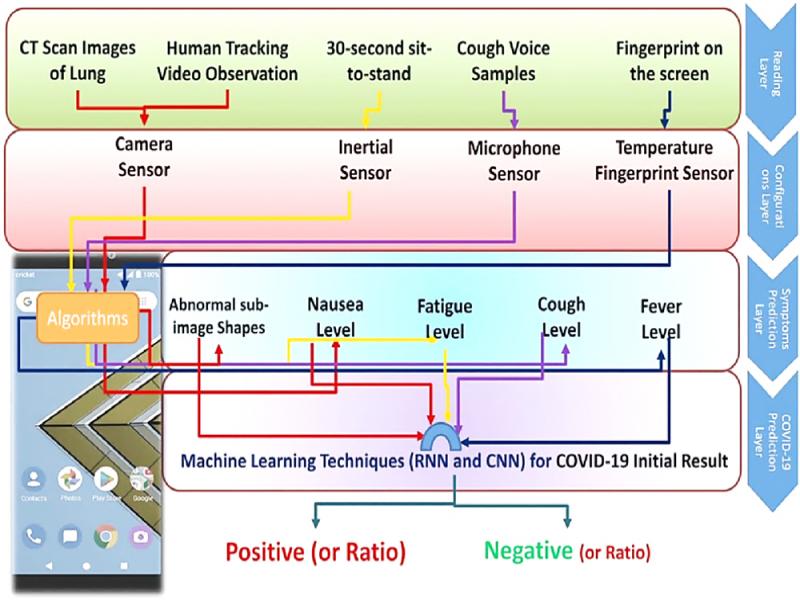
Figure 14:
Scheme of the proposed framework to predict COVID-19 (Maghded et al., 2020).
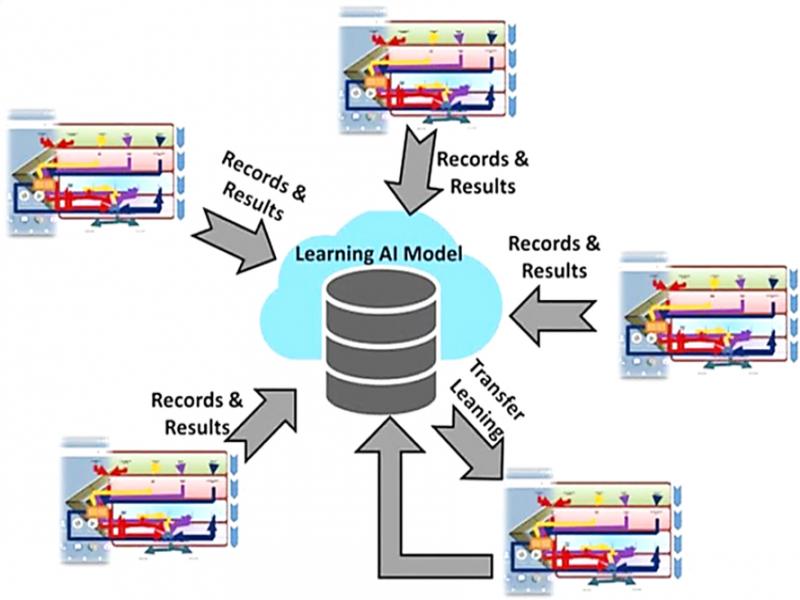
Figure 15:
Cloud computing for the proposed framework (Maghded et al., 2020).
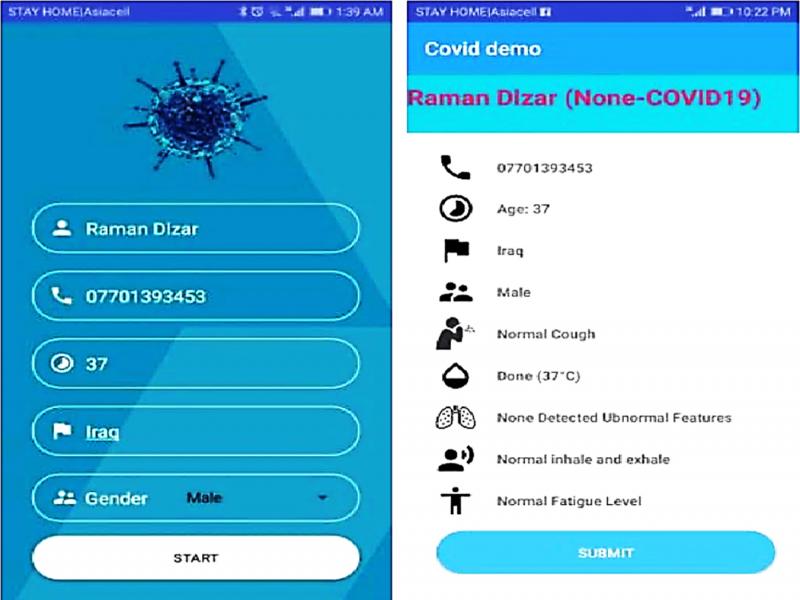
Figure 16:
User registration & results of the test (Maghded et al., 2020).
Table 2.
A full list of extracted features (Sun et al., 2020).
| Category | Modality | Features | Extraction |
|---|---|---|---|
| Mobility | Smartphone location | Homestay | The time spent within 200m radius of home location (determined using DBSCAN) |
| Maximum traveled distance from home | The maximum distance traveled from home location | ||
| Smartphone Bluetooth | Maximum number of nearby devices | The maximum number of Bluetooth-enabled nearby devices | |
| Fitbit step count | Step count | Daily total of Fitbit step count | |
| Functional measures | Fitbit sleep | Sleep duration | Daily total duration of sleep categories (light, deep, and rem) |
| Bedtime | The first sleep category of the night | ||
| Fitbit heart rate | Average heart rate | The daily average heart rate | |
| Phone usage | Smartphone user interaction | Unlock duration | The total duration of phone in the unlocked state |
| Smartphone usage event | Social app use duration | The total duration spent on social apps (Google Play categories of Social, Communication, and Dating) |
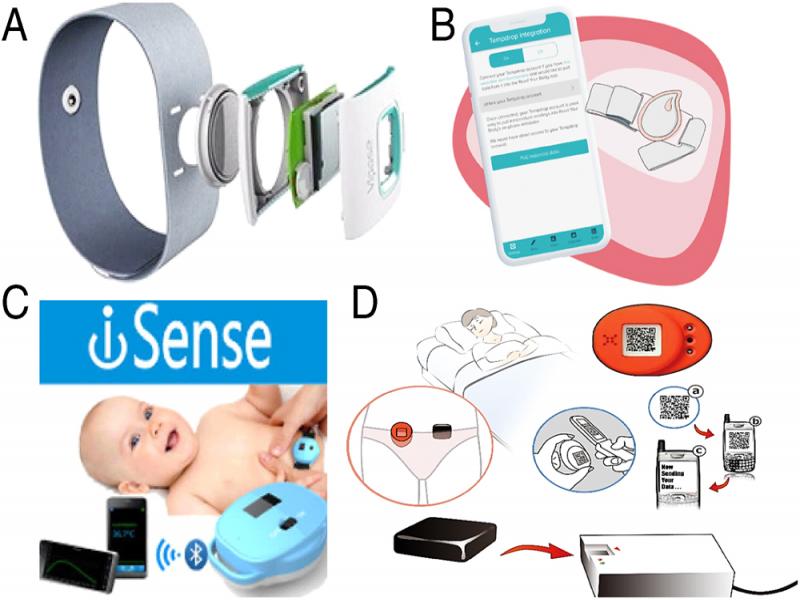
Figure 17:
iFever (a), Tempdrop (b), iSense (c), Ran’s Night (d), and smart thermometers.
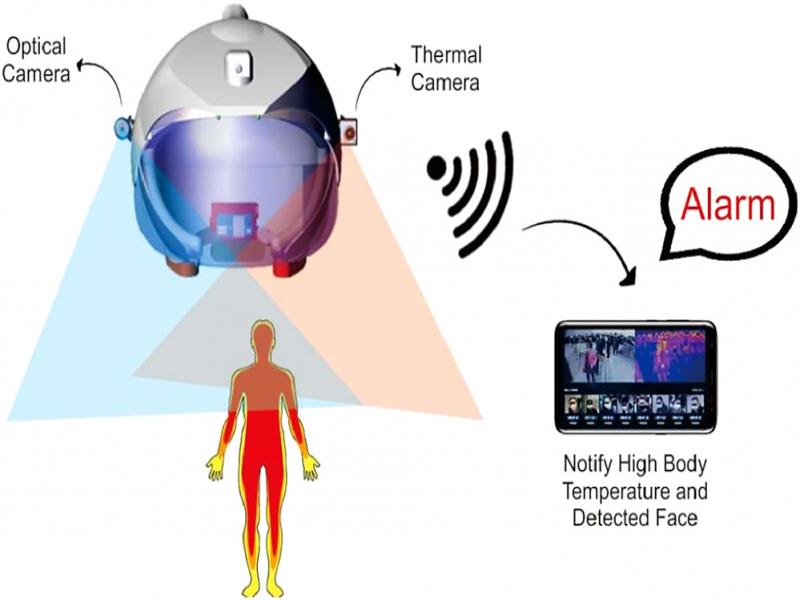
Figure 18:
Smart Helmet captures temperature by the thermal optical camera (Triaxtec, 2019).
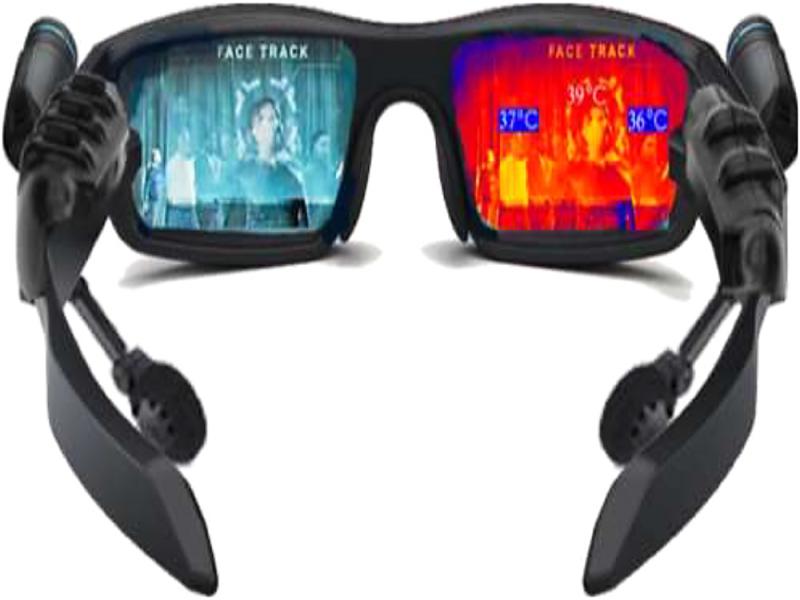
Figure 19:
Smart glasses temperature capturing (Mohammed et al., 2020).
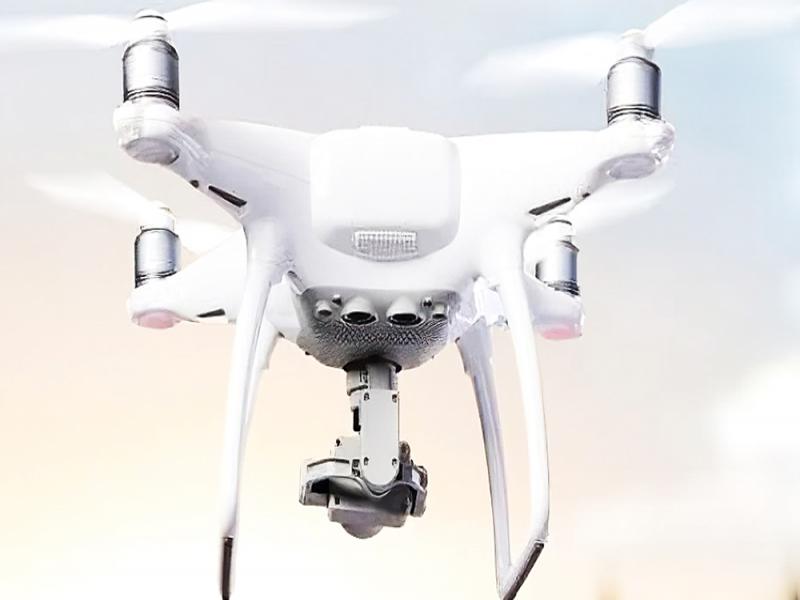
Figure 20:
Thermal imaging drone (Hitconsultant, 2019).
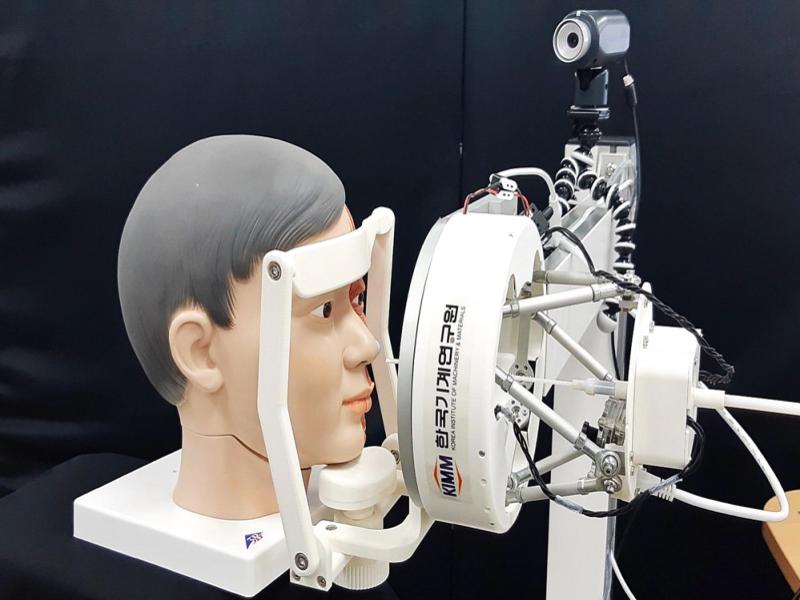
Figure 21:
Autonomous swab test robots (South Korean Institute of Machinery and Material, 2019).
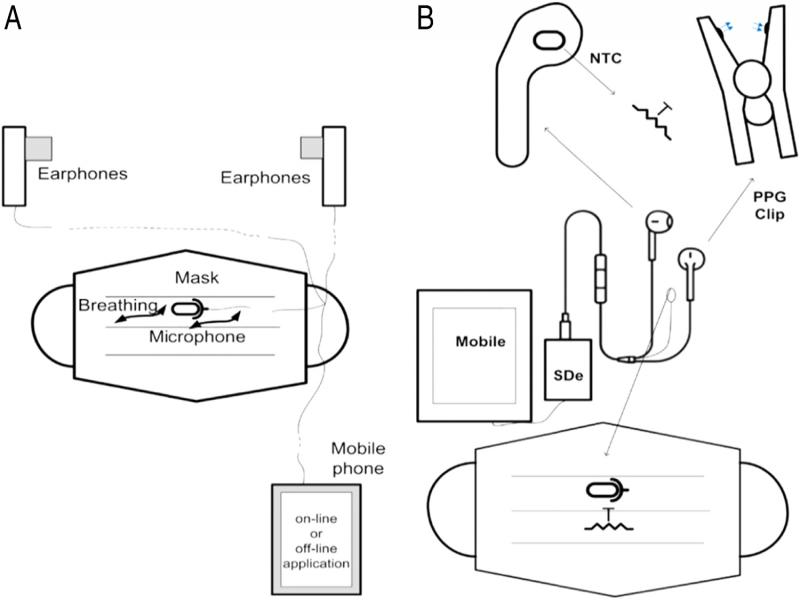
Figure 22:
The configuration of the headset’s microphone for the respiration rate and breathing detection, (a) configuration of the heart rate, temperature, and respiration rate detection using NTC thermistor, microphone, and PPG sensor, (b) (Stojanović et al., 2020).
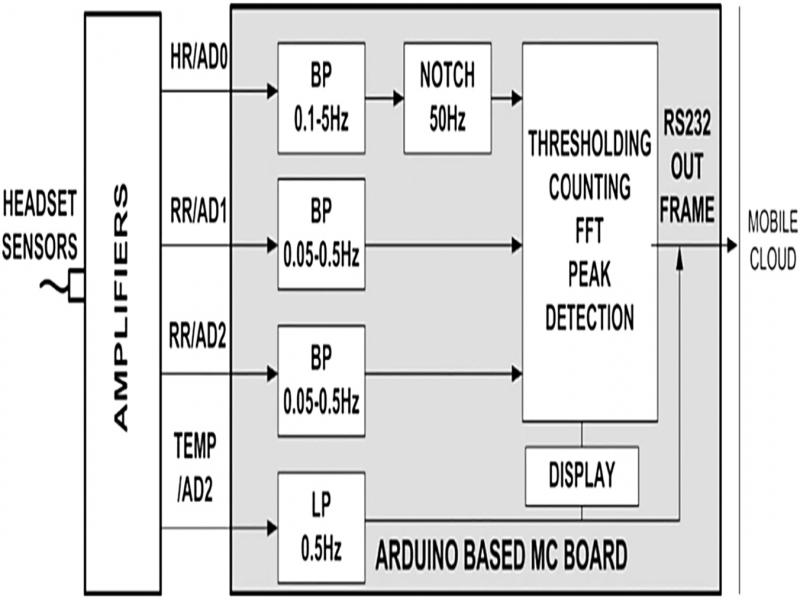
Figure 23:
Block diagram of the Arduino based interface for processing vital signs (Stojanović et al., 2020).
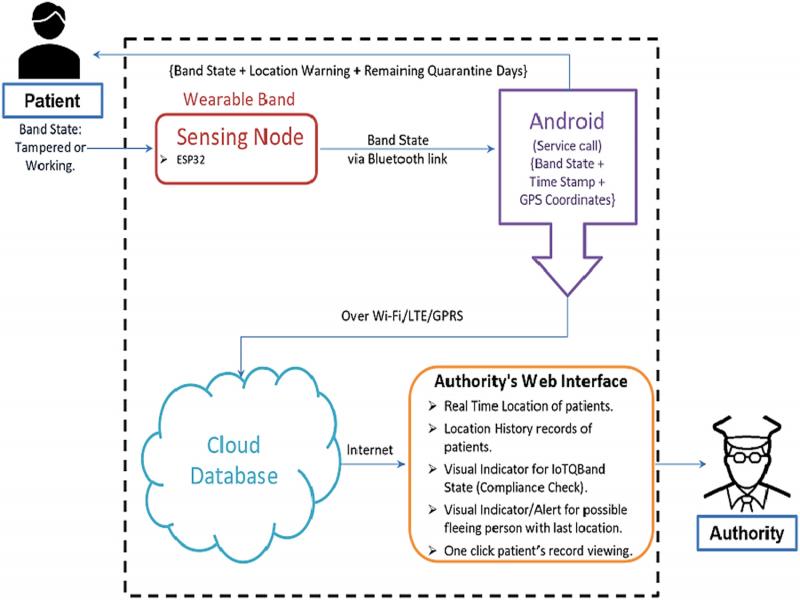
Figure 24:
The system architecture of the IoT-Q-Band system (Singh et al., 2020).
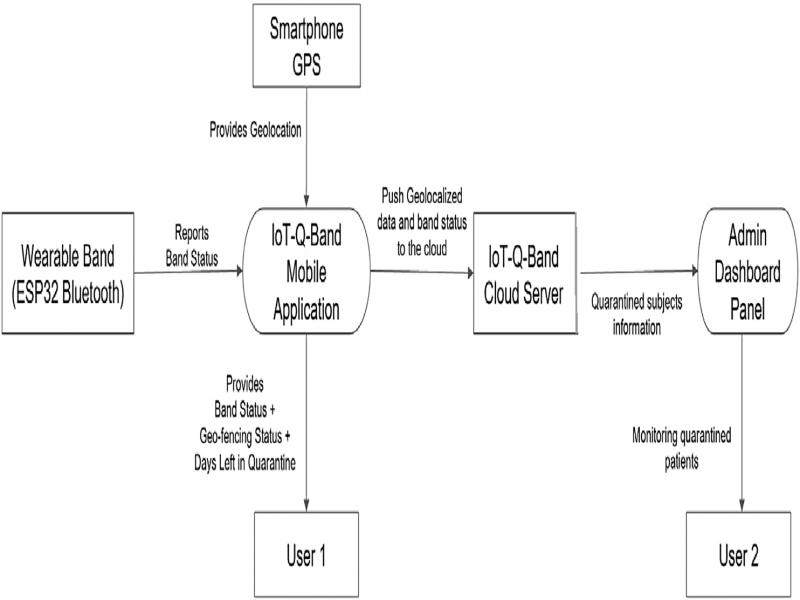
Figure 25:
Data flow diagram of the IoT-Q-Band system (Singh et al., 2020).
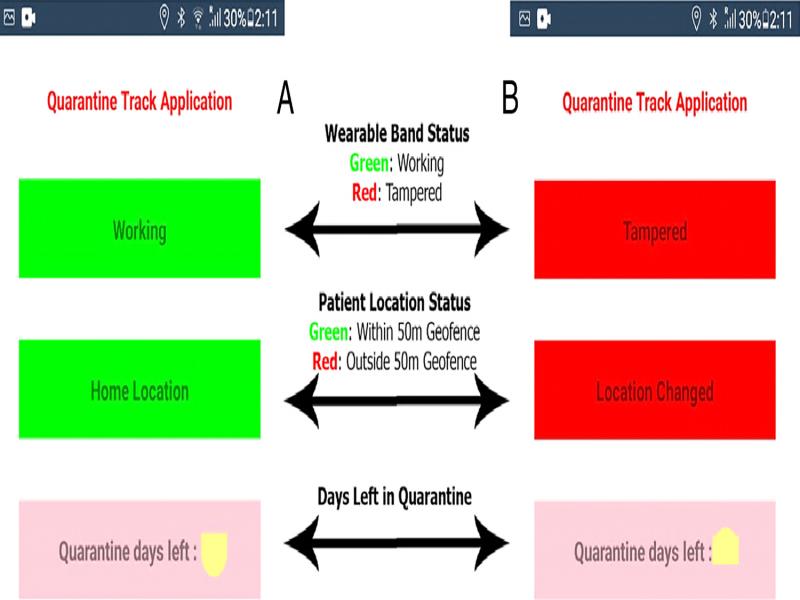
Figure 26:
Mobile application screens of the IoT-Q-Band system showing the cases: (a) when the band is connected, and the subject is within 50 meters of registered quarantine Geo-location, and (b) when the wearable tampered, and the patient is outside the 50 meters of the registered quarantine Geo-location (Singh et al., 2020).
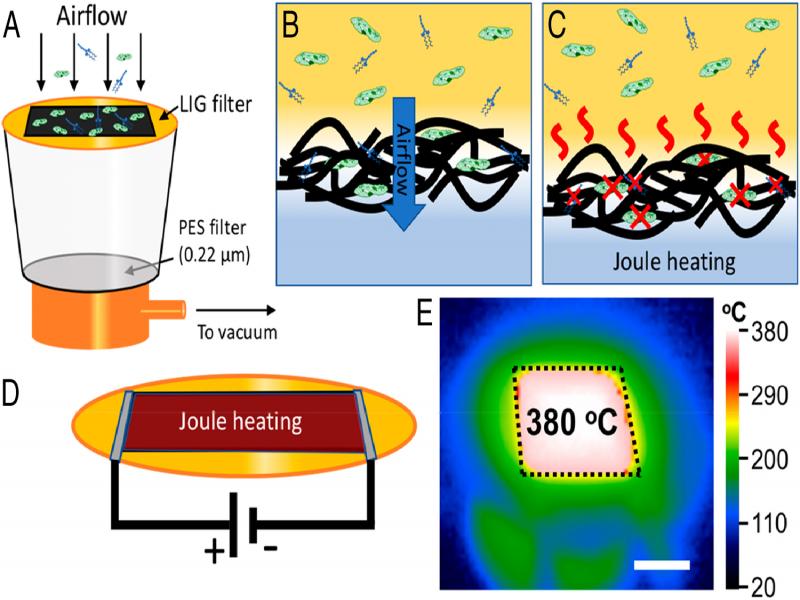
Figure 27:
Representation of filter testing setup and the working principle for self-sterilization of the filter (Stanford et al., 2019).
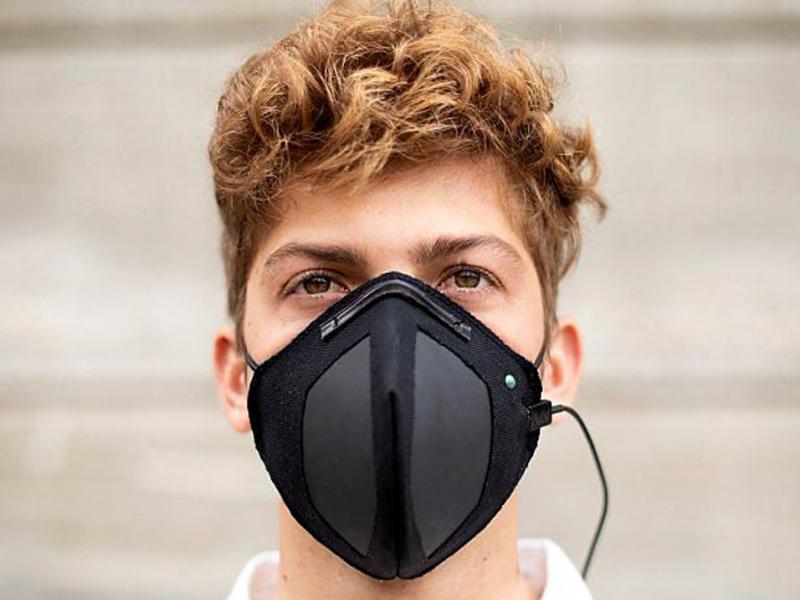
Figure 28:
Example of the Guardian G-Volt mask application (Dezeen, 2019).
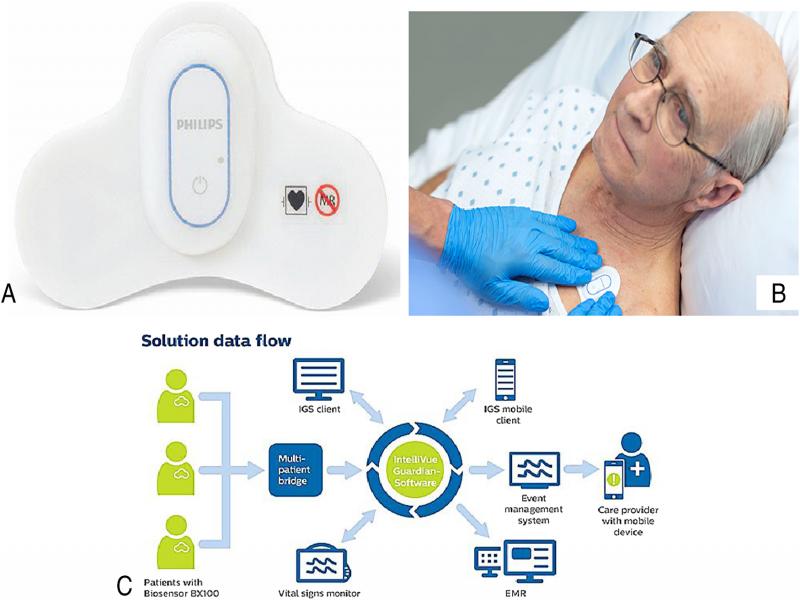
Figure 29:
BX100 Philips Biosensor (Philips, 2019): front view of the device (a), and its application on a patient (b), the graphical scheme of the health monitoring system (c).
Table 3.
Comparison between the scientific works reported in the second section, in terms of the detection technology, target species, LOD, detection time, application scenario and scalability.
| Scientific work | Detection mechanism | Target species | LOD | Detection time | Application scenario | Scalability |
|---|---|---|---|---|---|---|
| Wu et al. (2020) | GMR | H1N1 virus H3N2 virus | 15 ng/mL 125 TCID50/ml | 10 min | Virus screening | Low |
| Orlov et al. (2016) | MPS | BoNT A, B and E | 0.22, 0.11, 0.32 ng/mL | 25 min | Food quality | Medium |
| Zhang et al. (2013) | MPS | ssDNA | 400 pM | 10 sec | DNA analysis | Medium |
| Lei et al. (2015) | NMR | CuSO4 | 0.2 µM | 1 min | cell isolation, cell culture, DNA amplification | Medium |
| Zhao et al. (2021) | electrochemical | SARS-CoV-2 virus | 200 copies/mL | 10 sec | Virus screening | High |
| Vadlamani et al. (2020) | electrochemical | SARS-CoV-2 virus | 14 nM | 30 sec | Virus screening | High |
| Chin et al. (2017) | electrochemical | JEV virus | 5–20 ng/mL | 20 min | Virus screening | High |
| Seo et al. (2020) | FET-based | SARS-CoV-2 virus | 1.7 fM | 20 sec | Virus screening | High |
| Moitra et al. (2020) | LSPR | SARS-CoV-2 | 0.18 ng/µL | 10 min | Virus screening | Low |