
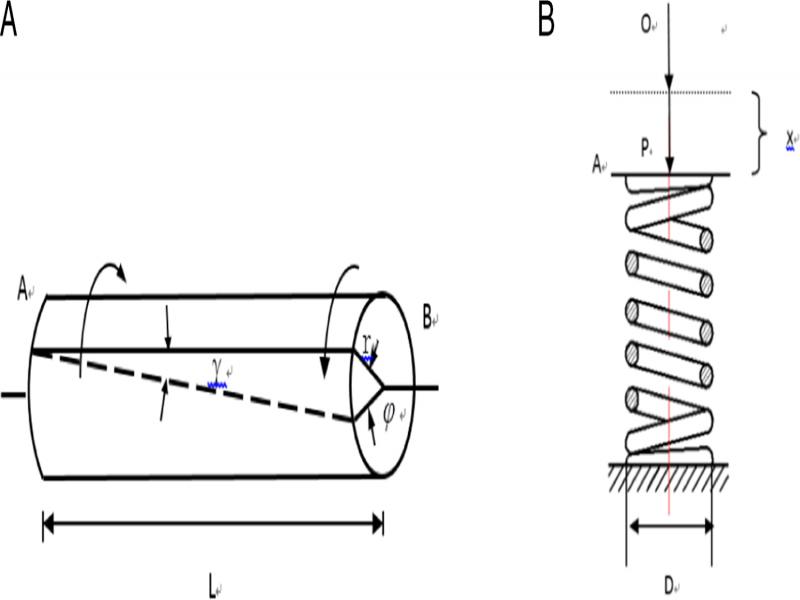
Figure 1:
(A) SMA rod under torsion; (B) SMA spring under deformation.
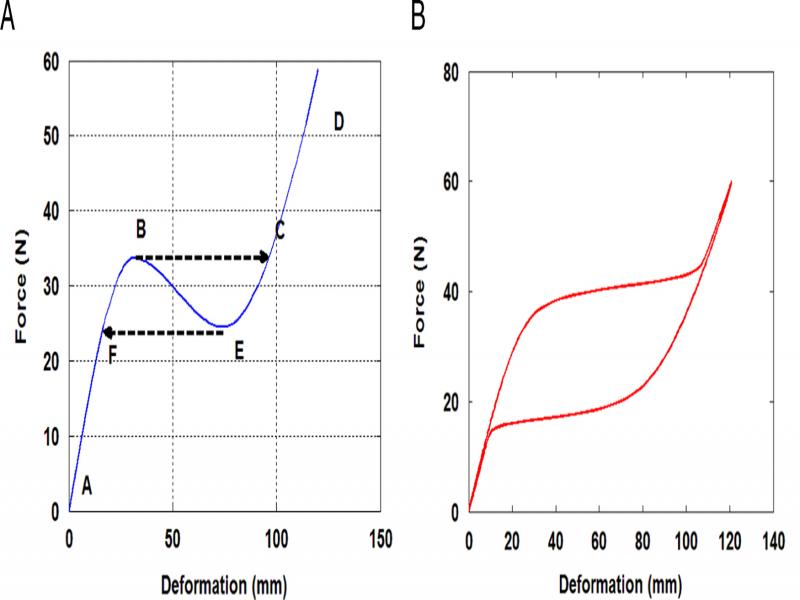
Figure 2:
(A) Recovery force of SMA spring; (B) observed hysteresis in simulation results.
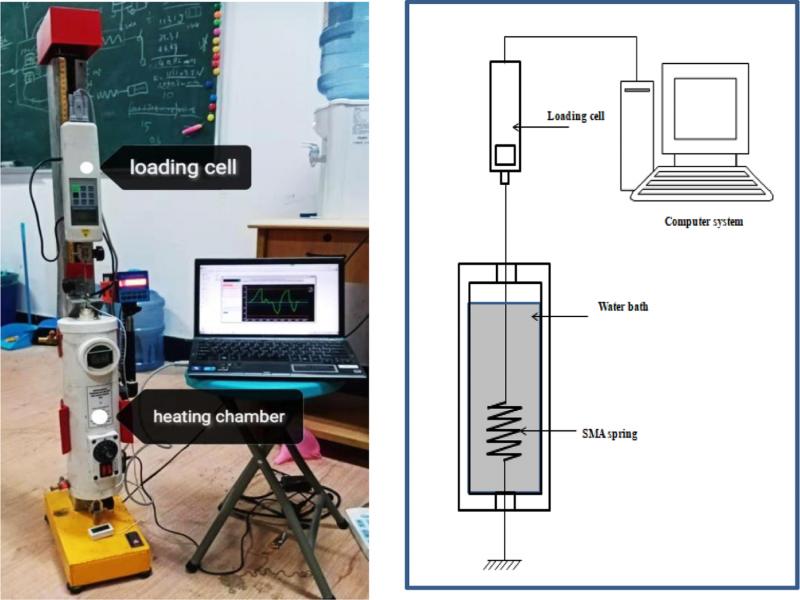
Figure 3:
The experimental setup for testing SMA spring.
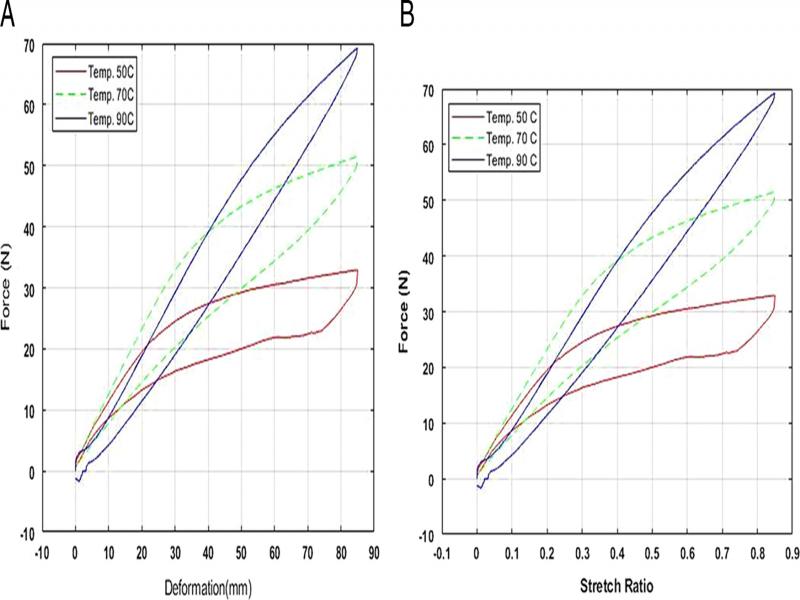
Figure 4:
Loadings and unloading at different temperatures and constant loading rate (A) before rescaling; (B) after rescaling.
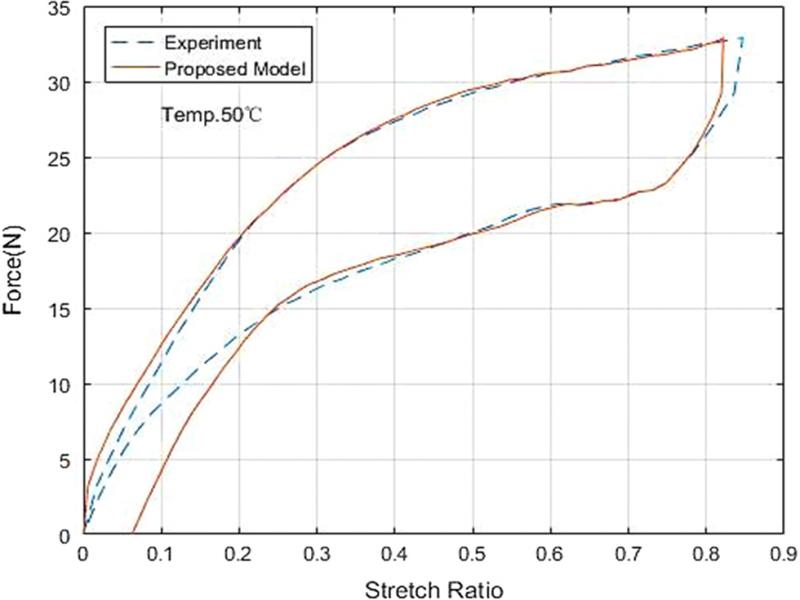
Figure 5:
Comparison of numerical and experimental SMA spring responses at 50°C.
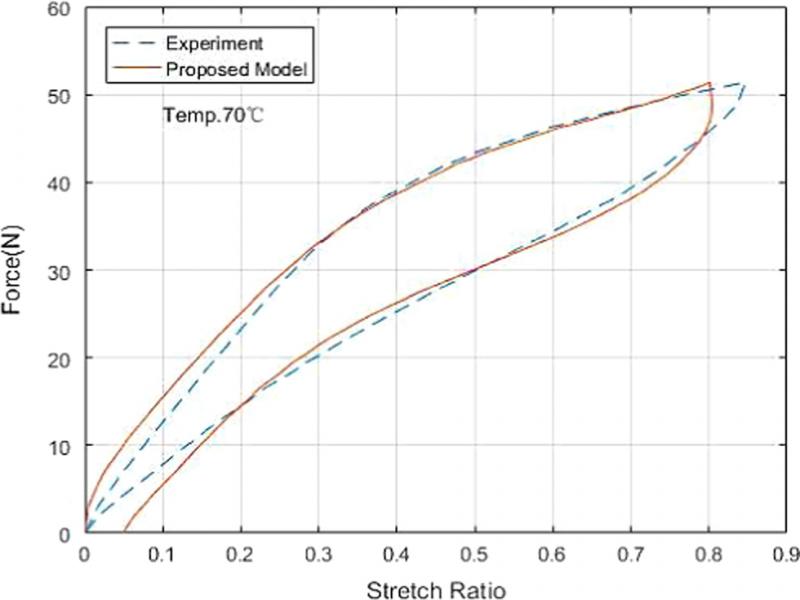
Figure 6:
Comparison of numerical and experimental SMA spring responses at (70°C).
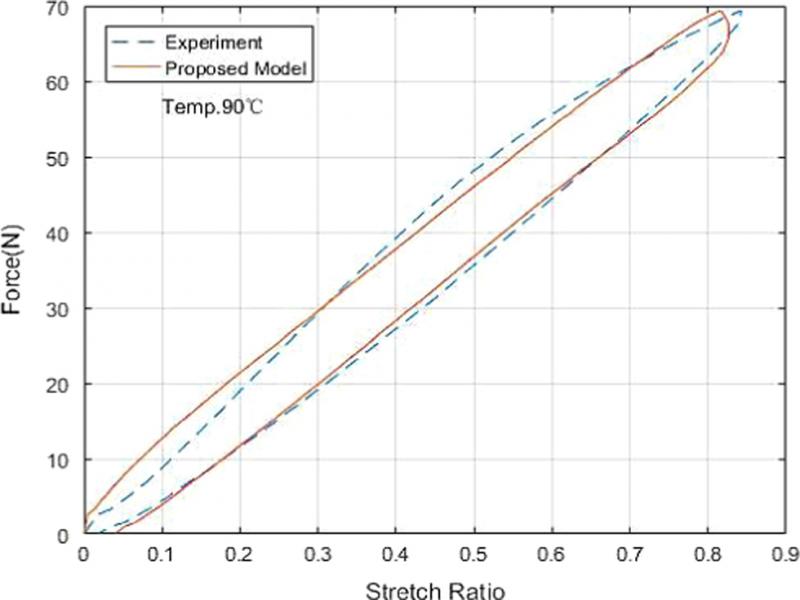
Figure 7:
Comparison of numerical and experimental SMA spring responses at 90°C.
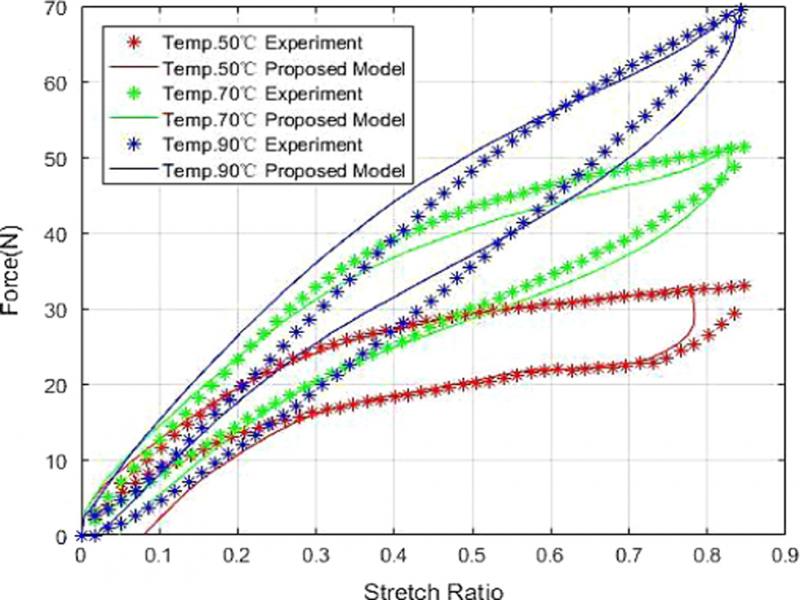
Figure 8:
Comparison of numerical and experimental SMA spring responses.
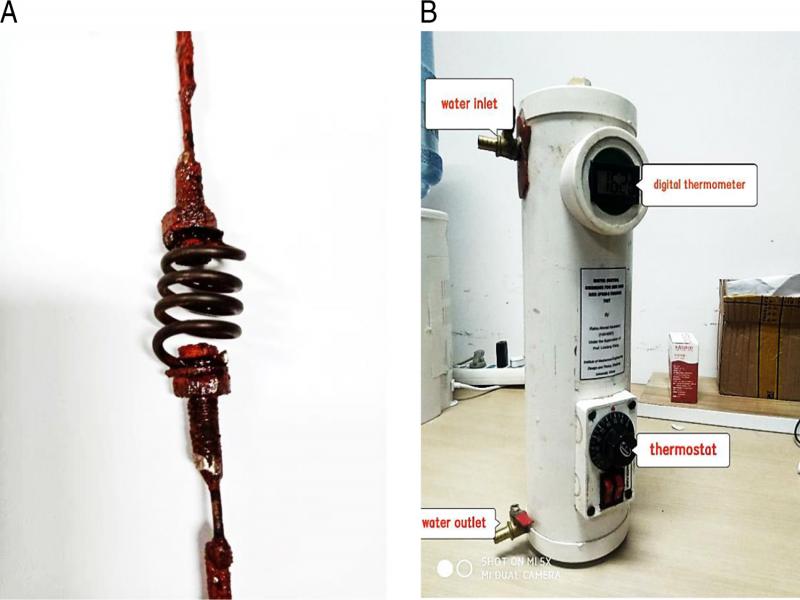
Figure A1:
(A) the SMA spring sample; (B) the SMA spring heating chamber.