Falls are the leading cause of injury, activity limitation and injury-related death in older adults (Black et al., 2008; Barry et al., 2014). The risk of falling increases with age. Approximately one-third of individuals over the age of 65 fall each year (Ivers et al., 1998; Zhang et al., 2015). This number increases to one half of those over the age of 85 (Zhang et al., 2015).
Balance and posture are complex, requiring information from the vestibular, somatosensory and visual systems. Poor balance and falls can be caused by degraded input from any one of these systems. Aging is associated with increased reliance on the visual system to compensate for age-related deterioration of the somatosensory and vestibular systems (Woollacott, 2000; Black et al., 2008). Changes in visual function are also associated with age. They are often progressive and slow, causing older individuals to overlook the role that their vision plays in balance (Ivers et al., 1998; Coleman et al., 2004; Zhang et al., 2015). Research has shown that individuals with vision impairment experience reduced balance (Ivers et al., 1998; Harwood, 2001; Legood et al., 2002; Klein et al., 2003; de Boer et al., 2004; Turano et al., 2004; Freeman et al., 2007; Black et al., 2008; Kuang et al., 2008; Wood et al., 2009, W2011; Lord et al., 2010; Patino et al., 2010; Salonen and Kivela, 2012; Napier-Dovorany and Graham, 2013; Reed-Jones et al., 2013; Willis et al., 2013; Fong et al., 2014; Hong et al., 2014; Agostini et al., 2015).
Central vision loss, such as that occurring in Age-related Macular Degeneration (AMD), is significantly associated with an increased incidence of falling (Elliott et al., 1995; Szabo et al., 2008, 2010; Popescu et al., 2011; Wood et al., 2011; Zetterlund et al., 2016; Chatard et al., 2017; Chung et al., 2017; Zetterlund et al., 2018). It affects several components of visual function that can contribute to poor balance (Turano et al., 1996; Lord and Menz, 2000; Lord and Dayhew, 2001; Coleman et al., 2004, 2007; de Boer et al., 2004; Turano et al., 2005; Lord, 2006; Wood et al., 2009; Lamoureux et al., 2010; Timmis and Pardhan, 2012). Reduced visual acuity has been associated with increased fall rate. Individuals with poor visual acuity were found to be 1.7 times more likely to fall than those with good visual acuity and 1.9 times more likely to fall multiple times over a 12-month period (Legood et al., 2002). Reductions in stereopsis and visual field have also been identified as factors contributing to reduced balance (Anand et al., 2003; Young and Mark Williams, 2015). Although these components are associated with falls, none of them have been shown to be great predictors of fall risk (de Boer et al., 2004).
Contrast sensitivity appears to be the strongest visual component predicting postural sway and falls (Elliott et al., 1995; de Boer et al., 2004; Wood et al., 2009, 2011). The ability to navigate the environment and avoid trip hazards requires visual information over a wide range of spatial frequencies. Poor contrast sensitivity has been associated with postural instability, slower walking velocity, increased step width and decreased stride length (Wood et al., 2009, 2011).
One visual component that has had little attention in the study of balance and falls is fixation stability. Although fixation is frequently targeted and trained in vision rehabilitation for central vision loss, it has yet to be investigated as a contributing factor in fall avoidance. When focusing on a target, the eyes are not completely static. Eye movements such as saccades, drift and tremors keep the eye in motion to avoid perceptual adaptation (Macedo et al., 2011). For those with normal vision, these eye movements are small in magnitude (<0.1 visual degrees in angle), which allows the fovea to be kept fixated on target (Crossland et al., 2009). The fovea is responsible for sharp, central vision and is important for daily tasks such as object recognition, reading and mobility (Tarita-Nistor et al., 2011). Some visual impairments cause disease in this region of the eye. In order to compensate for the loss of a functioning fovea, those affected recruit their remaining functional peripheral retina to accomplish daily tasks, with varying degrees of success. This results in the formation of eccentric, sometimes stable, but often unstable, non-central fixation points or preferred retinal loci (PRLs) (Schuchard, 2005; Seiple et al., 2005). Individuals with central vision loss have to use PRLs to acquire visual information directly in front of them, but they have no clues as to which retinal location they used to identify a perceived object. This severely diminishes their control over the localization of their path and any obstacles in it. Attempts to look again and reinforce perceived information is often time-consuming and frustrating.
The purpose of this study was to determine if there is a measurable (and significant) difference in balance between visually impaired people with stable fixation and those with unstable fixation. This study used the Mirametrix S2 Eyetracker to categorize participants as having stable fixation or unstable fixation. Balance performance was measured with traditional physical therapy tests such as the Berg Balance Scale and the Timed Up-and-Go and compared between the two groups. The Activities-specific Balance Confidence Scale was included to evaluate an individuals’ confidence in their balance abilities.
Method
Participants
Participants were recruited from the Ophthalmology Department of the Sir Mortimer B. Davis Jewish General Hospital in Montreal, Canada. The study protocol was approved by Le Comité d'éthique de la recherche en santé at the Université de Montréal and followed the tenets of the Declaration of Helsinki. Participants were required to be at least 45 years of age and have a retinal disorder affecting their macula such their visual acuity could not reach 20/20 with refraction. Diagnosis and macular involvement was confirmed by an ophthalmologist. For safety reasons, individuals with a best corrected visual acuity (BCVA) of 20/400 or better in the worse eye were excluded. Individuals with self-reported vestibular problems, hearing loss and artificial limbs were also excluded.
Protocol
Testing began with participants answering a questionnaire about their general health, medications and history of falls. BCVA was measured binocularly using pinhole acuity on the Early Treatment of Diabetic Retinopathy charts at a distance of 2 metres. Fixation stability was assessed using the Mirametrix S2 Eye Tracker. The desktop eye tracker was binocular and used infrared technology to track the movement of eyes across a computer screen. Based on bivariate contour ellipse areas over a nine-point calibration screen, participants were categorized as either stable or unstable fixators.
Balance was assessed using the Activities-specific Balance Confidence (ABC) Scale (Powell and Myers, 1995), the Timed Up-and-Go (TUG) (Podsiadlo and Richardson, 1991; Shumway-Cook et al., 2000) and the Berg Balance Scale (BBS) (Berg et al., 1995). The ABC scale is a questionnaire that asks individuals to indicate their level of confidence in doing an activity without losing their balance or becoming unsteady by choosing one of the percentage points on the scale from 0 to 100%. These activities included tasks such as getting into/out of a vehicle, reaching for something or walking over ice. It was designed to target community-dwelling older adults and cover a wide range of activity difficulty, and has good test-retest reliability (ICC = 0.91) and internal validity (Cronbach’s α = 0.95) (Powell and Myers, 1995).
Global mobility was measured using the TUG (Podsiadlo and Richardson, 1991), which asks the individual to rise from a seated position in a chair, walk at their usual pace to a marked spot a short distance away, turn, walk back to their seat and sit down. Participants are instructed to practice the task before completing test trials. Three test trials are timed and the final score is the average of these times. This test is reliable (ICC = 0.55–0.97, Cronbach’s α = 0.74) and has been used to assess mobility in populations with vision impairment (Popescu et al., 2011; Macedo et al., 2012; Donoghue et al., 2014). Clinically, the TUG is used to predict an individual’s ability to go outside alone safely (Podsiadlo and Richardson, 1991). It is quick and requires no specialized equipment, making it ideal to use in this battery of tests. The BBS measures static and dynamic balance abilities through 14 simple tasks including standing on one foot, standing with eyes closed and reaching forward. Each task is scored on a four-point scale and the final result is the sum of all tasks. This test has shown good internal consistency (Cronbach’s α = 0.83 and good inter-rater reliability (ICC = 0.83) and intra-rater reliability (ICC = 0.97) (Berg et al., 1995).
Data analysis
Student’s t-tests were used to compare dependent measures between participants classified as stable fixators and those classified as unstable fixators by the Mirametrix. The Mann–Whitney U-test was used when data were not normally distributed. Based on an expected effect of 0.8, power of 0.8 and an α level of 0.05, G*POWER (Erdfelder et al., 1996) analysis recommended a minimum of 21 participants per group. Balance measures were administered by physiotherapy students completing their M.Sc degree. Individuals measuring balance were masked to the fixation status of the participant.
Results
A total of 44 participants (23 males, 21 females) ranging in age from 47 to 91 years of age (mean: 68.10 years) participated in this study. All participants were diagnosed with a retinal condition affecting the macula and causing central vision loss (Figure 1). These diagnoses included Age-related Macular Degeneration, Diabetic Retinopathy, Macular hole/Pucker, Retinal Detachment and others (Metamorphopsia, Vitreous haemorrhage, Pseudohole). Binocular visual acuity ranged from 0.1 to 1.22 logMAR, mean = 0.34 logMAR. The questionnaire on fall history showed that 33 individuals (75%) of the sample had fallen before, with 20 (45%) of them reported having fallen within the last 12 months.
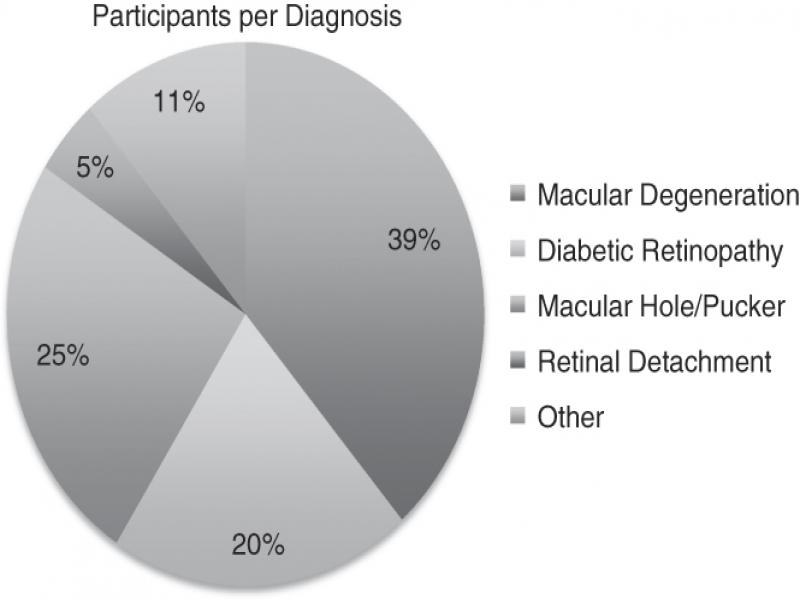
Figure 1:
Participant diagnoses. Note: Participants (n = 44) were diagnosed by their ophthalmologist as having a retinal disorder affecting the macula.
For the group as a whole, there was a significant positive correlation between age and performance on the TUG (r = 0.42, p = 0.005) and a significant negative correlation between age and BBS score (r = −0.44, p = 0.003), but no significant relationship between age and the ABC scale. This is in agreement with previous studies. Binocular visual acuity (logMAR) was significantly correlated with all three measures of balance; there was a positive correlation between acuity and TUG time (r = 0.46, p = 0.002) and negative correlation between acuity and ABC Scale (r = −0.50, p < 0.001) and BBS scores (r = −0.55, p < 0.001). The number of falls reported in the last year was significantly correlated with binocular visual acuity (r = 0.38, p = 0.011) and all measures of balance (TUG: r = 0.40, p = 0.008; ABC: r = −0.39, p = 0.009; BBS: r = −0.53, p<0.001), but not with age.
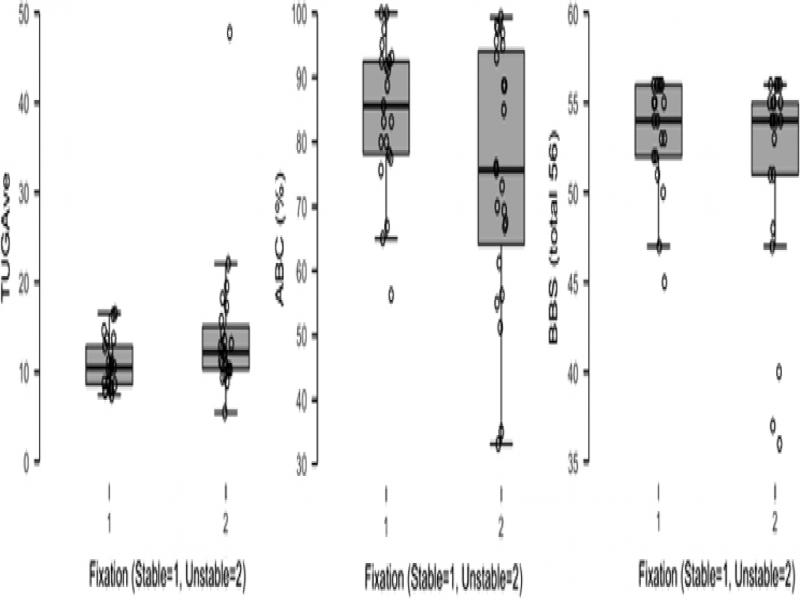
The Mirametrix S2 Eye Tracker categorized participants as having stable fixation (N = 23) or unstable fixation (N = 21). (See Table 1 for descriptive statistics and Figure 2 for graphs.) The average age in the stable fixation group was 66.8 years, which was not significantly different from the unstable fixation group, which was 69.6 years. Binocular visual acuity did not significantly differ between groups either, U = 243.50, p = 0.523. More falls were reported by the unstable fixators, but the difference failed to reach significance, U = 255.00, p = 0.644.
Table 1.
Descriptive statistics for fixation groups.
| Stable (Mean ± SD) | Unstable (Mean ± SD) | t-test ( p-value) | |
|---|---|---|---|
| Number | 23 | 21 | |
| Gender | 13 males, 10 females | 10 males, 11 females | |
| Age (years) | 66.48 ± 11.98 | 69.64 ± 9.40 | t(42) = −0.965 (p = 0.170) |
| Fallen before (n) | 16 | 17 | |
| Fallen in the last year (n) | 11 | 9 | |
| Number of falls last year | 0.57 ± 0.60 | 0.70 ± 1.11 | U = 255.00 ( p = 0.644) |
| Visual Acuity OU (logMAR) | 0.33 ± 0.23 | 0.34 ± 0.20 | U = 243.50 ( p = 0.523) |
| BBS (total score/56) | 53.43 ± 3.08 | 51.65 ± 6.07 | U = 268.00 ( p = 0.741) |
| ABC Scale (%) | 84.47 ± 11.80 | 75.17 ± 19.99 | t(42) = 1.86 ( p = 0.965) |
| TUG (seconds) | 10.70 ± 2.78 | 14.30 ± 8.22 | U = 160.50 ( p = 0.029) |