
Deciding the appropriate type and amount of service to recommend for each student is acknowledged to be a major challenge for teachers of students with vision impairment (TVIs) and orientation and mobility (O&M) specialists. This challenge has been a long-documented struggle for practitioners in school settings, with constraints on time caused by the myriad responsibilities of a service provider and the intricacies of student scheduling and personnel availability (Correa-Torres and Howell, 2004; Beadles, 2007; AER Division 16, 2010; Bina et al. 2010; Cmar et al. 2015).
For O&M in particular, issues with determining the appropriate service type and time recommendations are further exacerbated by the scarcity of trained O&M specialists, which, along with growing caseload numbers, might reduce the frequency of instruction provided to individual students. That is, the larger the caseload, the less frequent the services to students (Mason et al. 2000; Bina et al. 2010). Wall Emerson and Corn (2006) warned that, “At a time of a severe shortage of personnel, O&M specialists must often determine which students’ needs are greatest or who would benefit the most from instruction. Years of making such decisions might affect instructors’ view of which services should be provided” (p. 332). This dilemma is problematic because, according to Wall Emerson and Anderson (2014): “Lack of consistency in determining the appropriate level of service for a given child can lead to inflated caseload sizes and ineffective services” (p. 151). According to Wolffe and Kelly (2011), a significant link exists between receipt of O&M instruction in high school and employment or enrollment in postsecondary school within two years of graduation. Riley (2000) added that the acquisition of O&M skills is “of great importance to the social and economic independence of blind and visually impaired persons” (p. 36590). This finding highlights the necessity of carefully selected service objectives designed to meet the students’ actual needs and ensuring adequate service time (Sapp and Hatlen, 2010). This finding also supports the hypothesis that O&M services generate positive outcomes for students who are vision impaired (Wolffe and Kelly, 2011).
Best practices require service frequency and duration to be based on students’ needs rather than instructor availability (Bina et al. 2010). Cmar et al. (2015) suggested that “Instructional decisions should be based on students’ goals and needs … not solely on external factors or availability of resources” (p. 5). Yet, as admitted by Wall Emerson and Anderson (2014) actual service levels might be determined based, at least in part, on the size of the O&M specialist’s caseload. Wall Emerson and Anderson (2014) also reported that 60% of the respondents to their O&M survey indicated having used either the Orientation and Mobility Severity Rating Scale (OMSRS) or the Orientation and Mobility Severity Rating Scale Plus (OMSRS+) to influence caseload size.
The authors who developed the Orientation & Mobility Visual Impairment Scale of Service Intensity of Texas (O&M VISSIT) believe that to bring about real change in the O&M profession and in the lives of students with vision impairment, these external factors like Cmar et al.’s (2015) example of availability of resources, should not be involved in determining intensity of services. Rather, this decision should be drawn solely from the student evaluation data. These data should also address aspects of the expanded core curriculum (ECC) (Hatlen, 1996) such as independent living skills, self-determination and sensory efficiency. Data collected from an O&M evaluation should inform high-stake decisions, and therefore must be thorough and accurate, affecting the resulting appropriateness, frequency, and duration of O&M service provision (Fazzi and Naimy, 2010). Every student should be given the opportunity to succeed. Successful student outcomes appear dependent on provision of a personalized blend of direct individualized instruction from the O&M specialist and appropriate support provided to all of the student’s educational team including the child’s parents/family, teachers, paraeducators, and other service providers (Huebner et al. 2004; Pogrund, 2008; Silberman and Sacks, 2007; Spungin and Ferrell, 2007; Cmar et al. 2015).
Background
United States federal law mandates that educational goals for students with disabilities include a summary of the child’s present level of academic achievement and functional performance, along with a description of the impact that his or her disability (e.g., vision impairment) has on ability to be involved and make gains in the general education curriculum (US Department of Education, 2004 (section 300.320(a)(1)). O&M services were first named as an important component of individualized programming in the 1997 reauthorisation of the Individuals with Disabilities Education Act (IDEA) (US Department of Education, 2004). According to former Secretary of Education, Richard Riley (2000), it is crucial that children who are blind/vision impaired receive O&M instruction early and are provided necessary services at appropriate times, which
… increases the likelihood that they can participate meaningfully in a variety of aspects of their schooling, including academic, nonacademic, and extracurricular activities. Once these individuals are no longer in school, their use of acquired [O&M] skills should greatly enhance their ability to move around independently in a variety of educational, employment, and community settings. These skills should enhance the ability of blind and visually impaired students to obtain employment, retain their jobs, and participate more fully in family and community life. (36586-36587).
In 2013, the Service Intensity Subcommittee of the Texas Action Committee for the Education of Students with Visual Impairments (a Texas Education Agency-endorsed stakeholder group tasked with ensuring appropriate educational services for students who are blind/vision impaired) carefully examined available service determination tools (Toelle and Blankenship, 2008; Durkel and Miller, 2009; Michigan Department of Education, 2017) and found these tools lacked the guidance needed to determine service type, time, and intensity recommendations. The tools either did not address all skill areas related to individual needs or included aspects unrelated to student need (e.g., practitioner’s workload, material preparation, and travel). The subcommittee determined the analysed models did not effectively devote attention to student needs in the ECC (Hatlen, 1996; Huebner et al. 2004; Lohmeier, Blankenship, and Hatlen, 2009; Sapp and Hatlen, 2010; Wolffe and Kelly, 2011).
Therefore, the subcommittee developed a unique tool, basing programming decisions on evaluation in each area of the ECC, known as the Visual Impairment Scale of Service Intensity of Texas (VISSIT), now published for use by itinerant TVIs to determine service type and intensity for students with vision impairment (VISSIT, 2014; Pogrund et al. 2015). A national validation study on the VISSIT for TVIs was completed in May 2015, revealing that consequential validity, social validity, and content validity were all significantly valid. The internal consistency reliability proved significantly reliable.
Following the success of the VISSIT, the subcommittee received numerous requests for an equivalent tool for O&M specialists. These requests called for a tool that uses complete evaluation of student strengths and needs across the O&M spectrum to provide quantifiable, data-driven support for decision making related to O&M service type and intensity. Having such a tool would assist to establish consistent methods and guidelines to combat variations in service recommendations. A solution for the pervasive service discrepancies throughout the profession of O&M was a motivator for this project. Only a handful of tools are available to assist O&M practitioners in determining service type and intensity, and selecting the right level of service for a particular student’s needs is largely left to professional judgment (Wall Emerson and Anderson, 2014). Orientation and Mobility specialists should prioritize student need to determine adequate service frequency and duration so that each student can develop and practice skills and make substantial, timely progress.
The Service Intensity Subcommittee reconvened in February 2015 and began analysing available tools and methods for O&M service determination to identify limitations of each tool. This undertaking revealed that certain tools, even those widely adopted, lacked the ideals and focus considered essential by subcommittee members. Such ideals included focusing primarily on evaluation data to guide service intensity recommendations and recognising the importance of collaborative consultation as a service delivery model component for O&M. Idol et al. (1995) described collaborative consultation as “an interactive process that enables people with diverse expertize to generate creative solutions to mutually defined problems” (p. 329). Other ideals included documentation of collaborative consultation time and maximal direct service times based on student need rather than factors of “how much service [practitioners] have been able to provide to students during their career” (Wall Emerson and Anderson, 2014, p. 156). For example, in both the O&MSRS and the O&MSRS+ (also known as “the Michigan Scales”), the recommended O&M service times were restricted at a maximum limit of 30 to 90 minutes per week for all but the most severe cases. Even as more students qualify for O&M services, practitioners might compensate for their lack of availability by reducing frequencies of lessons. Most available service recommendation tools allow consideration of certain factors which might increase or decrease time recommendations.
The O&M VISSIT tool discussed in this article is designed to be appropriate for any and all students with vision impairment who require O&M services, including infants, toddlers, and those with multiple impairments who are medically fragile or deafblind. Because the O&M VISSIT is based on student performance and ability (gathered from functional vision evaluation/learning media assessment/ECC and O&M evaluation data, Individualized Education Program [IEP] progress monitoring, and observation/collaboration), the need for separate scales for different populations is eliminated. The members of the subcommittee created this scale with the belief that factors such as the student’s amount of vision (which comprise over one-third of the Michigan scales’ severity considerations) should not be used in consideration of service type/intensity, respecting the individuality of student performance irrespective of visual acuity, field, function, or other measurement by an eye medical professional. Though these criteria may be used to qualify for services, they do not necessarily address student needs or abilities at any given time.
Pavey et al. (2003) emphasized that individual differences among children (e.g., the divergent implications of an assortment of visual diagnoses) demand distinct and diverse emphases of support. Thus, there is no ‘blanket’ service delivery structure that will address the needs of a caseload across the board. As stated by Riley (2000) “the extent to which [O&M] services are necessary for an individual child and, if so, the amount and duration of those services that are necessary for a child to receive FAPE [Free and Appropriate Public Education] are decisions for the child’s IEP team” (p.36590) and should be updated or supplemented as often as required depending on individual factors as the student matures.
The primary protocol for the O&M VISSIT was drafted in June 2015, and initial field testing was completed in September 2015. Revisions occurred the following month, and pilot testing began in January 2016. The initial validation study was designed in September 2016, and the O&M VISSIT tool and surveys were distributed in January 2017. Data collection was completed in May 2017. The Texas Tech University Institutional Review Board approved this study prior to commencement.
Methods
This study evaluated validity and reliability aspects of the O&M VISSIT using mixed-methods survey research with purposive sampling. Data were collected using a follow-up electronic questionnaire. The questionnaire included Likert scale questions and open-ended response questions to gather both quantitative and qualitative information.
This study took place during one academic semester. Orientation and Mobility specialists used the O&M VISSIT for at least one student on their caseloads who needed or recently had an O&M evaluation (initial or three-year reevaluation).
Recruitment
Participants, having some degree of expertize and experience in the field of O&M were required for this study. Therefore, the purposive sampling method of expert sampling was used by obtaining the opinions/evaluation of highly knowledgeable individuals with particular expertize (Singh, 2007). For this study, experts were defined as certified O&M specialists who met the following criteria: (i) completed all coursework and internship requirements of a university O&M training program along with passage of the national Academy for Certification of Vision Rehabilitation & Education Professionals (ACVREP) O&M certification examination, (ii) currently working with children as an itinerant O&M specialist, (iii) having more than three years’ experience as an O&M specialist, (iv) participating in current O&M professional development, and (v) demonstrating quality teaching based on expert observation. Additional preferred criteria included receipt of an outstanding teaching/service award and service as a mentor to new O&M specialists.
A selection of regional and statewide leadership personnel in O&M, including regional Education Service Center (ESC) vision impairment/O&M consultants and specialists working in the Outreach Department of the Texas School for the Blind and Visually Impaired (TSBVI), assisted in recruiting O&M specialists in Texas who met the sampling criteria. Via email, nominees were instructed to respond directly to the researchers indicating their willingness to use the O&M VISSIT with a student (which served as consent for participation in this study) and to provide electronic survey feedback afterward. The O&M VISSIT scale was originally sent to 34 O&M specialists, nominated by leaders in 10 of the 20 ESC regions in Texas.
Participants
Fifty-Six O&M VISSITs were submitted by 24 participants who completed the follow-up electronic survey evaluating the tool’s use. Participants represented eight ESCs, with experience as an O&M specialist ranging from three to 32 years working in urban, suburban, and rural settings. Demographic reports revealed that students with whom the O&M VISSIT was used ranged in age from 2 to 18 years, 50% females and 50% males, with varying degrees of vision impairment, from a range of placement settings, literacy media, and additional disabilities/eligibilities.
Procedure
Researchers emailed recruitment letters in spring, 2017 to the regional ESC vision/O&M consultants in Texas and to TSBVI Outreach specialists, with instructions to forward a separate recruitment letter to O&M specialists in their respective geographic locations who met the criteria for participation. Upon receiving responses from selected practitioners, researchers electronically disseminated a copy of the O&M VISSIT to all who agreed to participate (Fig. 1).
Each participant selected at least one student from his or her caseload and conducted an O&M evaluation and/or reviewed all current evaluation results for the student(s). The O&M specialist then used the O&M VISSIT to determine recommended service time for each student based on the results of the evaluation data. Each participant used evaluations they deemed appropriate and used those assessments to evaluate each student’s present level of performance in every skill area of the scale. After completing the O&M VISSIT on at least one student, each participant mailed their completed protocol (removing all identifying student information) to the researchers. When the researchers received the completed protocols, they sent an email to the corresponding participant, linking an anonymous electronic survey designed to gather information about the O&M VISSIT and its use.
Survey data was collected using Qualtrics, an internet-based survey generator. The surveys featured Likert scale quantitative questions (formulated to garner information about the scale’s reliability and validity) as well as qualitative questions (formulated from free-response opportunities to gather user’s perceptions about the O&M VISSIT format, completion time, and suggestions for revision). Data collection was completed in May 2017, after which data analysis commenced.
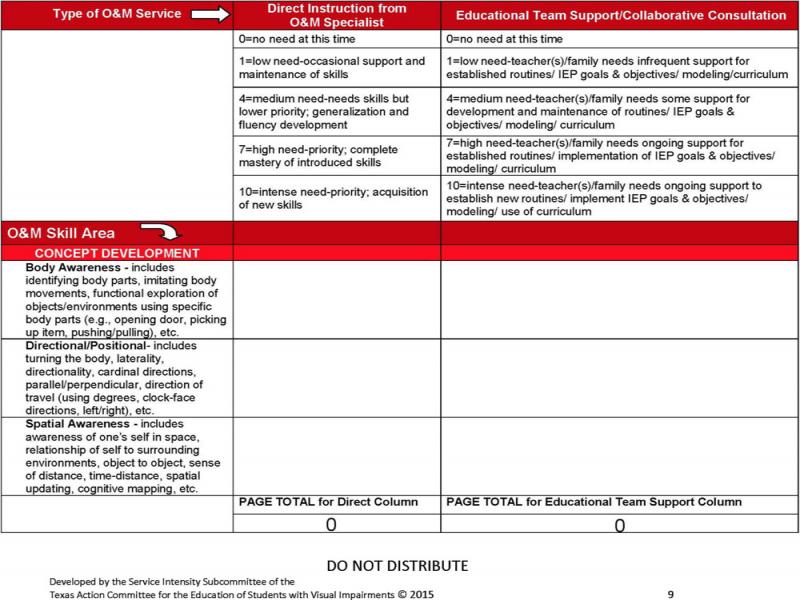
Figure 1
Selected sample page of the O&M VISSIT.
Results
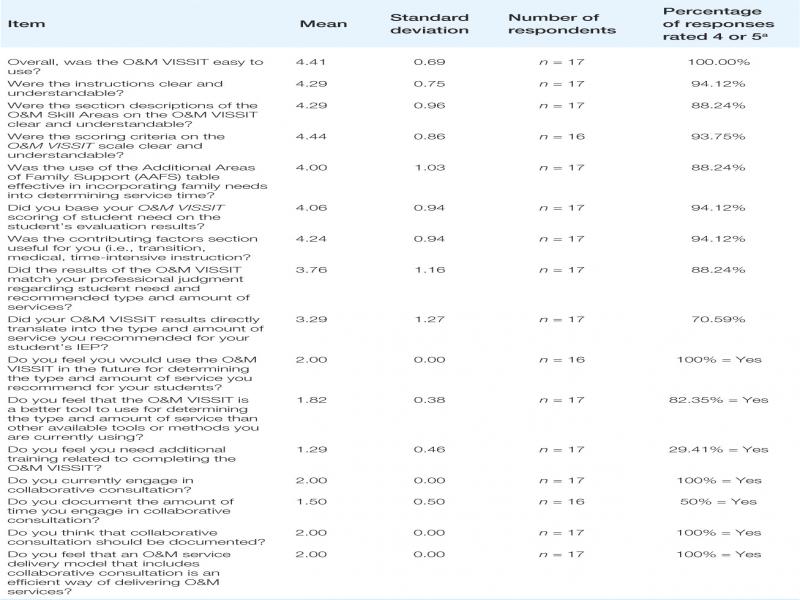
Means and standard deviations for each quantitative question in the survey were determined using descriptive statistics. For eight electronic survey questions, participants were instructed to score opinions on a five-point Likert scale. One additional question asked participants to rate the relevance of each of the 36 distinct O&M VISSIT items on a four-point scale. Higher numbers indicate the highest ratings, with the number 1 being the lowest. Seven questions were yes/no, with “yes” represented by a value of 2, and “no” represented by a value of 1. For those questions, means closer to 2 indicated more affirmative responses. Table 1 lists the Likert scale questions, their means, standard deviations, and the number of respondents for each survey question.
Analysis of the survey data indicated that the version of the O&M VISSIT used in this study was moderately valid in consequential validity and significantly valid in social and content validity (both content validity ratio (CVR) and content validity index (CVI)). The internal consistency reliability was found to be moderately reliable.
Messick (1989) described consequential validity as a measure of participants’ opinions of a tool’s intended and unintended consequences in interpretation and use. The O&M VISSIT was intended for use by O&M specialists, with intended consequence of providing guidance in determining appropriate type/amount of O&M services needed by an individual student, based on evaluated need in comprehensive areas. Consequential validity of the O&M VISSIT was moderately supported in the data by 76% of participants stating that results obtained using this tool for recommendations of student service needs matched their professional judgment. Fifty-three percent of participants agreed that results relating to type/amount of service matched what they would recommend. The intended consequence of using the O&M VISSIT is supported by the participants’ responses, which, in turn, support its consequential validity.
Table 1
Likert scale questions regarding use of the O&M VISSIT.
| Item | Mean | Standard deviation | Number of respondents | Percentage of responses rated 4 or 5a |
|---|---|---|---|---|
| Overall, was the O&M VISSIT easy to use? | 4.41 | 0.69 | n = 17 | 100.00% |
| Were the instructions clear and understandable? | 4.29 | 0.75 | n = 17 | 94.12% |
| Were the section descriptions of the O&M Skill Areas on the O&M VISSIT clear and understandable? | 4.29 | 0.96 | n = 17 | 88.24% |
| Were the scoring criteria on the O&M VISSIT scale clear and understandable? | 4.44 | 0.86 | n = 16 | 93.75% |
| Was the use of the Additional Areas of Family Support (AAFS) table effective in incorporating family needs into determining service time? | 4.00 | 1.03 | n = 17 | 88.24% |
| Did you base your O&M VISSIT scoring of student need on the student’s evaluation results? | 4.06 | 0.94 | n = 17 | 94.12% |
| Was the contributing factors section useful for you (i.e., transition, medical, time-intensive instruction? | 4.24 | 0.94 | n = 17 | 94.12% |
| Did the results of the O&M VISSIT match your professional judgment regarding student need and recommended type and amount of services? | 3.76 | 1.16 | n = 17 | 88.24% |
| Did your O&M VISSIT results directly translate into the type and amount of service you recommended for your student’s IEP? | 3.29 | 1.27 | n = 17 | 70.59% |
| Do you feel you would use the O&M VISSIT in the future for determining the type and amount of service you recommend for your students? | 2.00 | 0.00 | n = 16 | 100% = Yes |
| Do you feel that the O&M VISSIT is a better tool to use for determining the type and amount of service than other available tools or methods you are currently using? | 1.82 | 0.38 | n = 17 | 82.35% = Yes |
| Do you feel you need additional training related to completing the O&M VISSIT? | 1.29 | 0.46 | n = 17 | 29.41% = Yes |
| Do you currently engage in collaborative consultation? | 2.00 | 0.00 | n = 17 | 100% = Yes |
| Do you document the amount of time you engage in collaborative consultation? | 1.50 | 0.50 | n = 16 | 50% = Yes |
| Do you think that collaborative consultation should be documented? | 2.00 | 0.00 | n = 17 | 100% = Yes |
| Do you feel that an O&M service delivery model that includes collaborative consultation is an efficient way of delivering O&M services? | 2.00 | 0.00 | n = 17 | 100% = Yes |