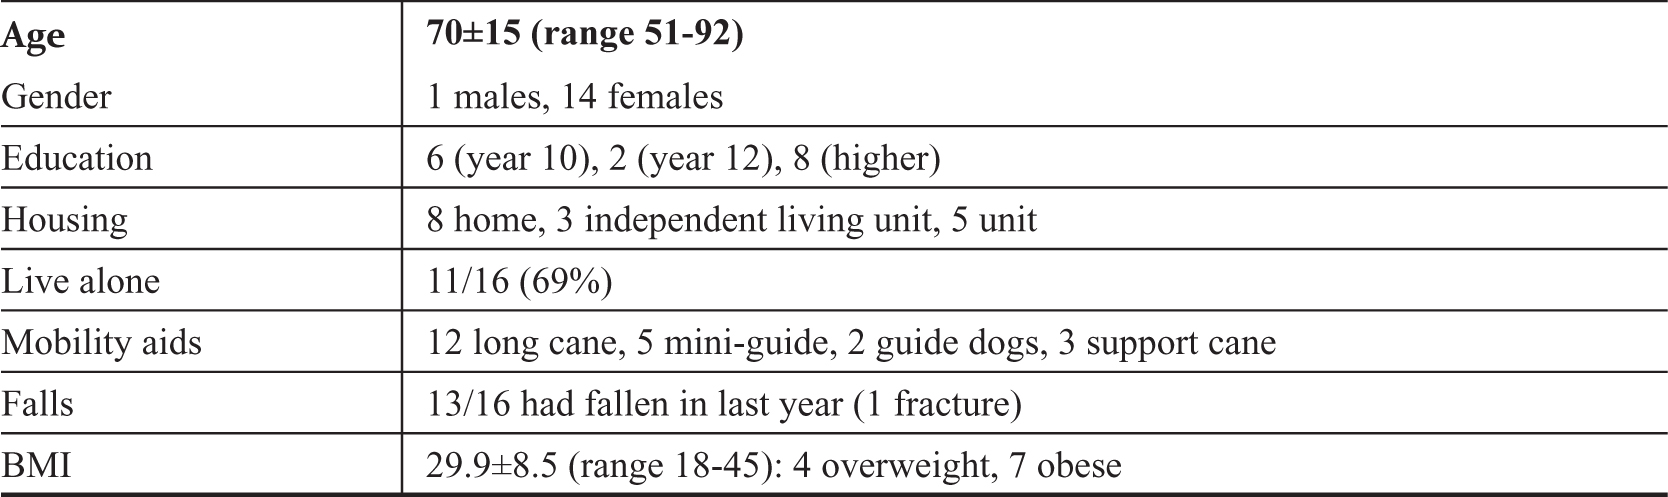
Table 1.
Characteristics of the study population.
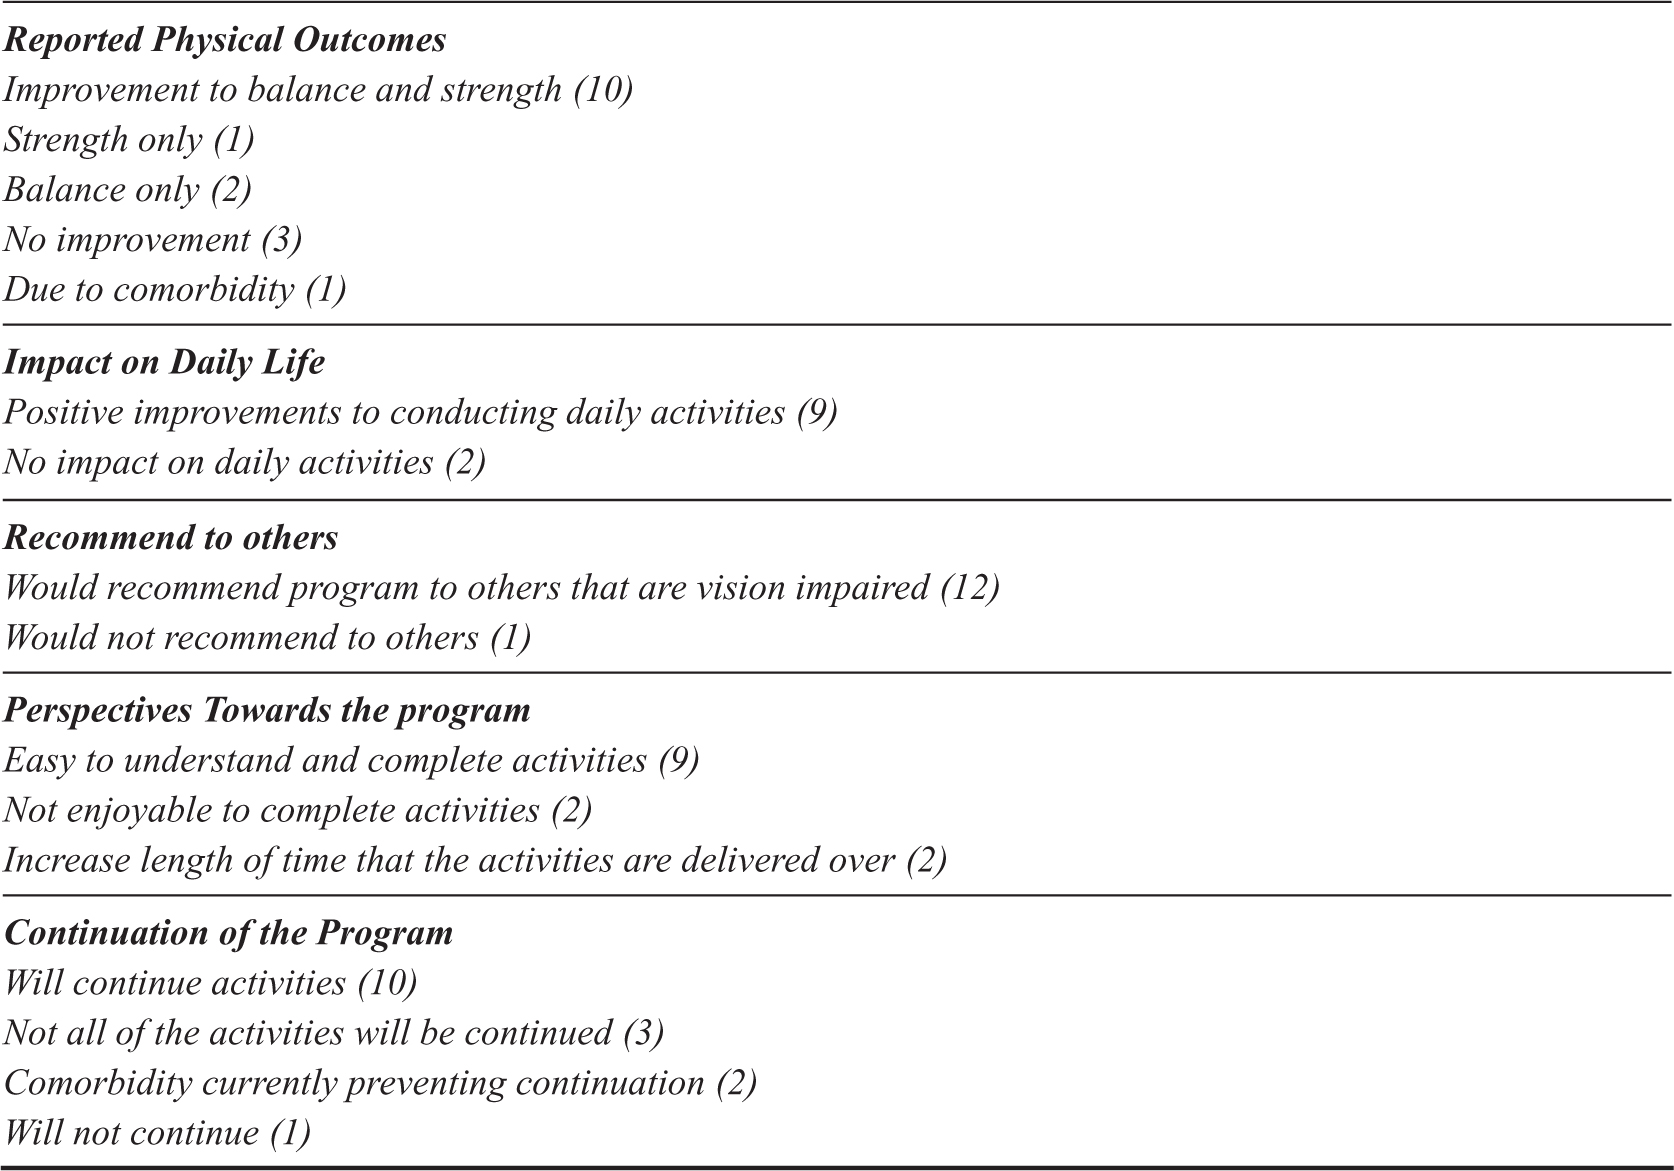
Table 2.
Outcomes from Post-Intervention Interview (n=13 ).
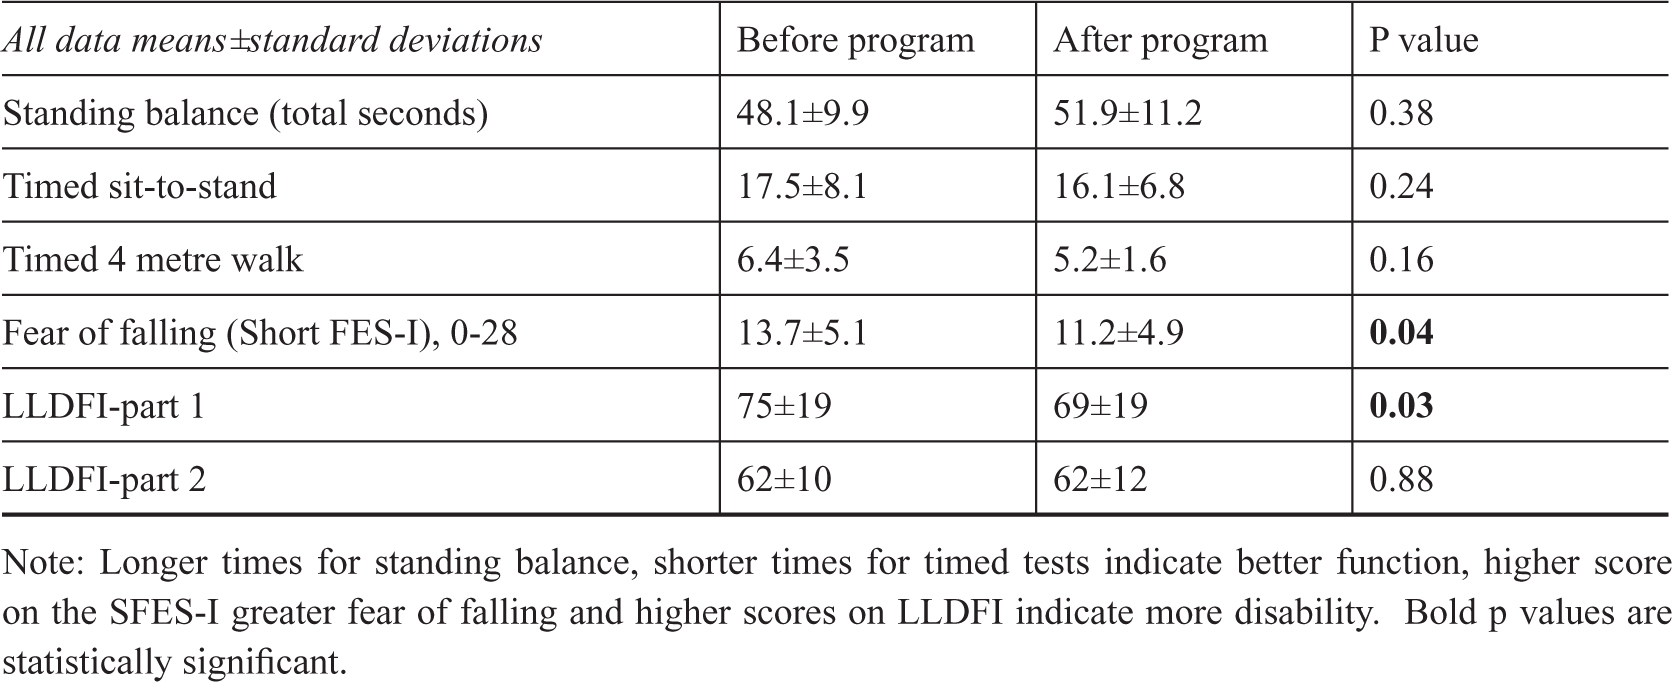
Table 3.
Changes in physical function after completing LiFE program paired t-test (n=15).

© 2017 Lisa Keay, Freya Saich, Lindy Clemson, Lisa Middlemiss, Jacqueline Johnson, Haley Tumanik, Jessica Taylor, Joanne Munro, Ewa Borkowski, Frances Tinsley, published by Guide Dogs NSW/ACT
This work is licensed under the Creative Commons Attribution-NonCommercial-NoDerivatives 4.0 License.