

Table 1.
The way respondents (N=121) learned about teleintervention.

Table 2.
Frequency of EI services to young children with vision impairment (N=121).
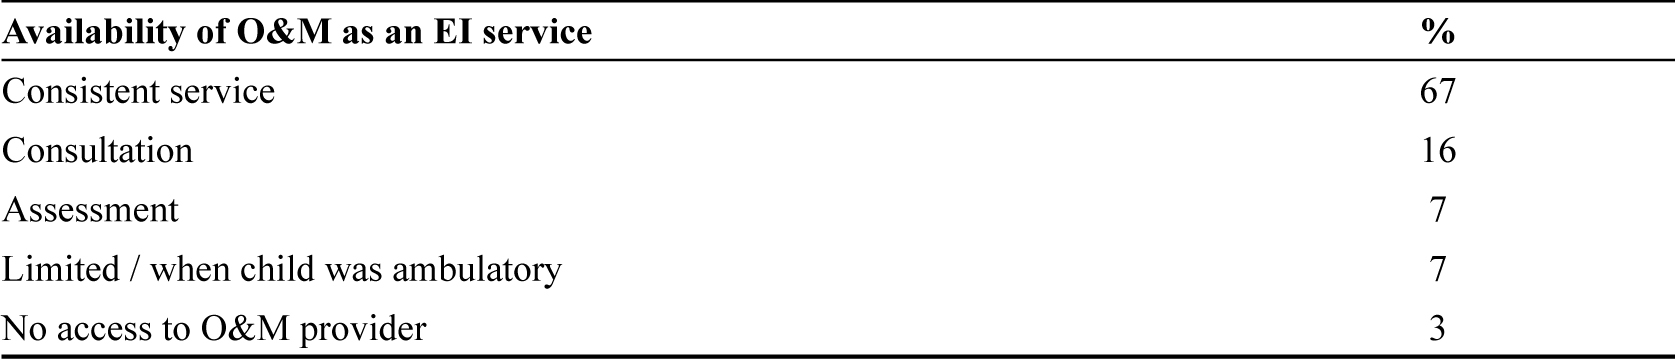
Table 3.
Availability of O&M services as an early intervention service for young children with vision impairment in provider’s service area (N=121).
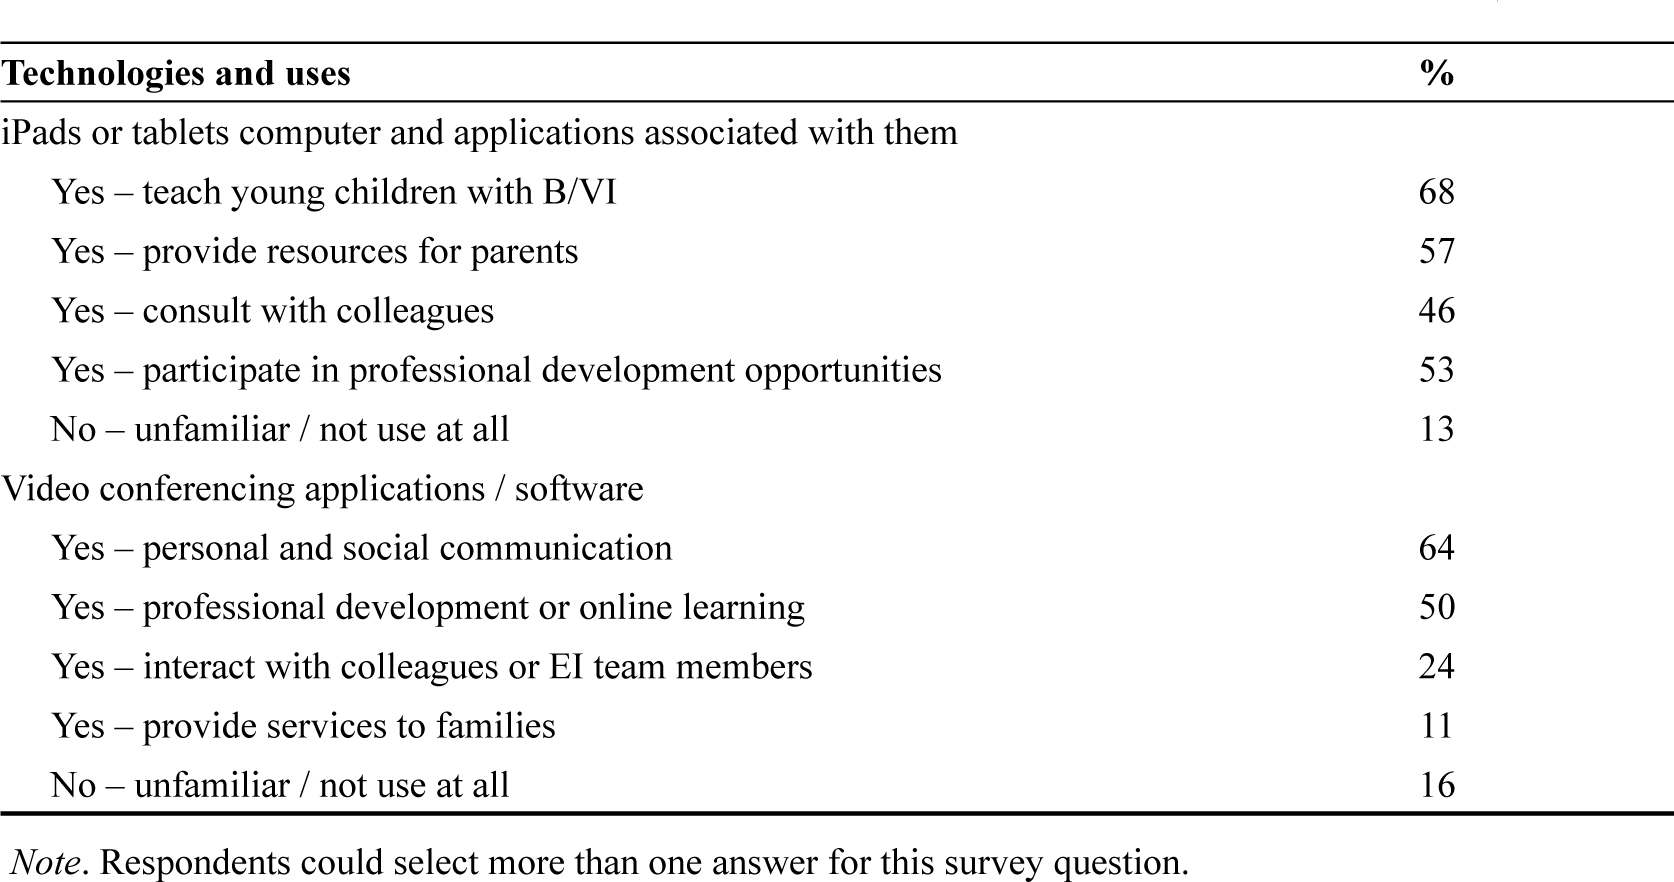
Table 4.
Familiarity with technologies associated with teleintervention practice and uses (N=121).