
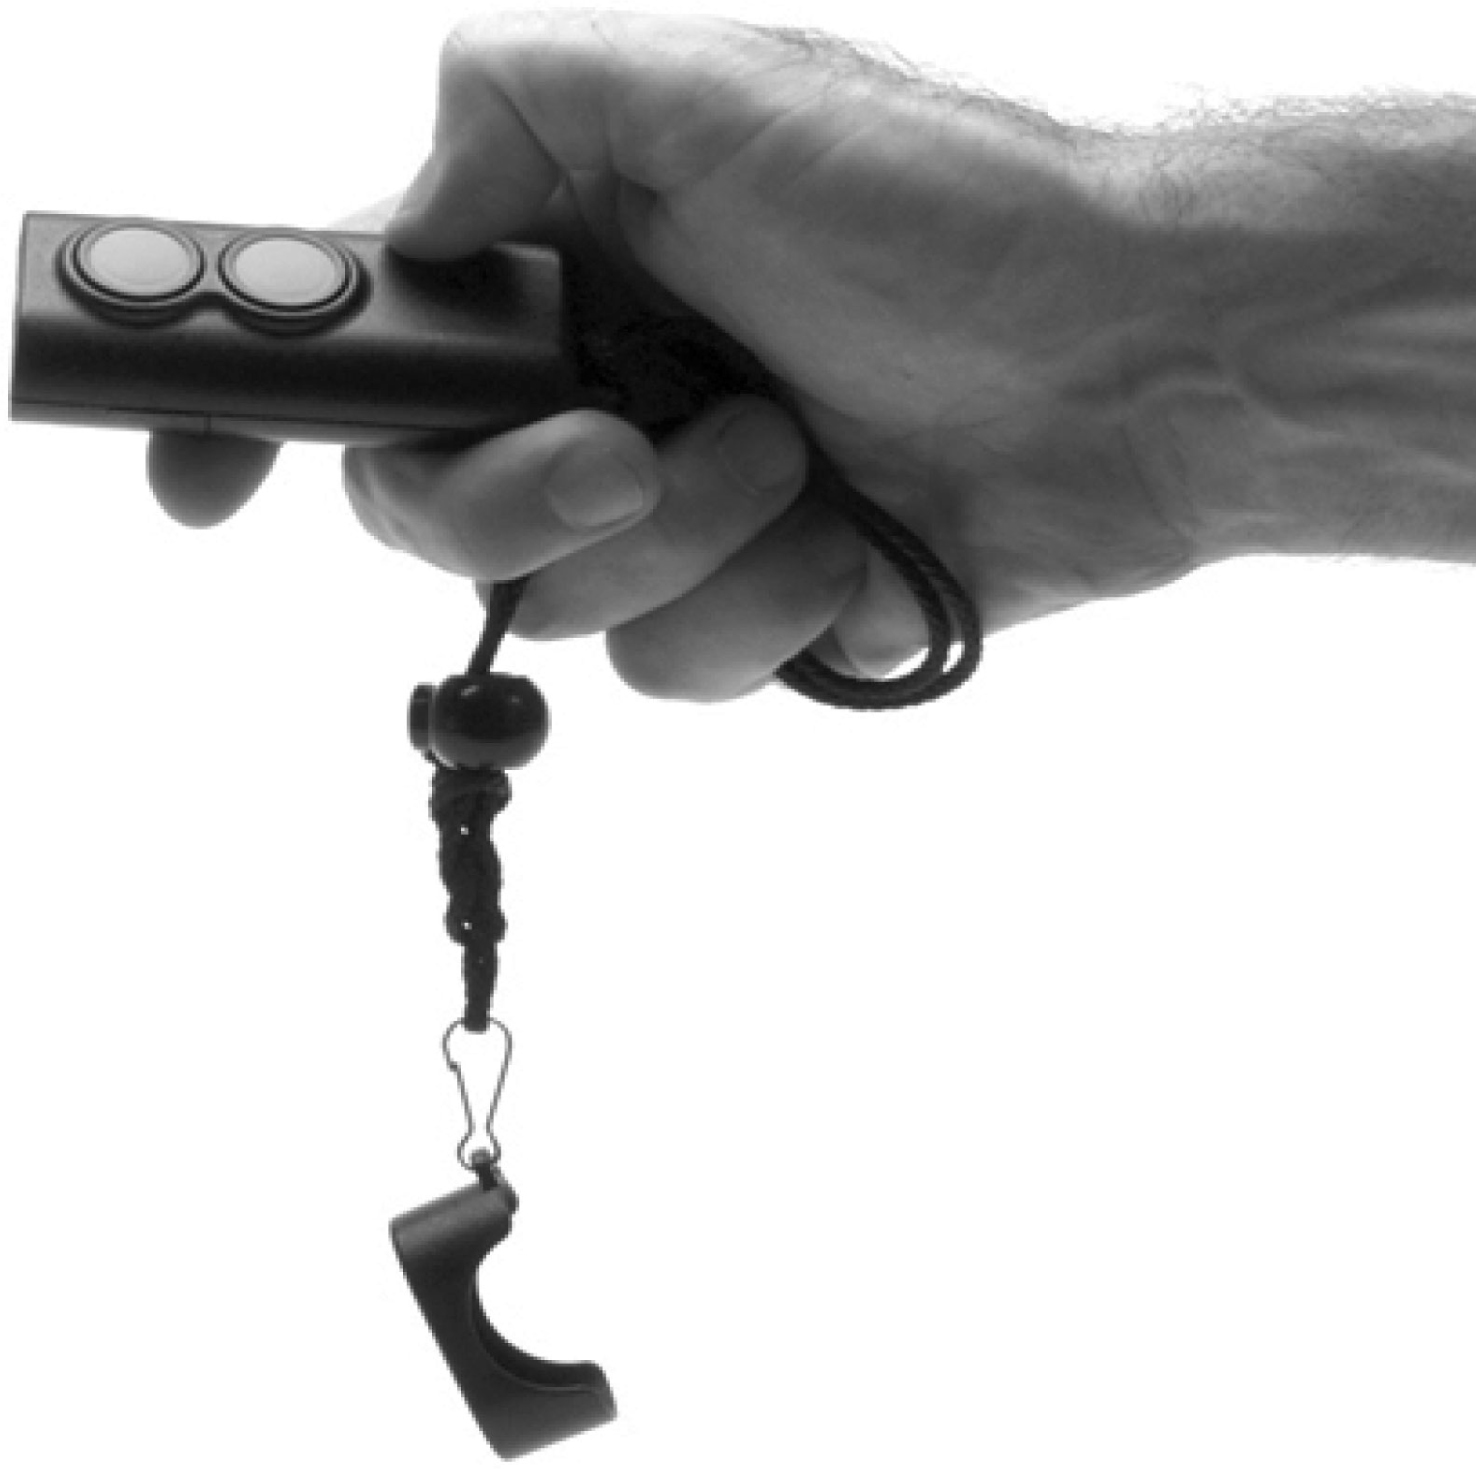
Figure 1.
Miniguide US™.
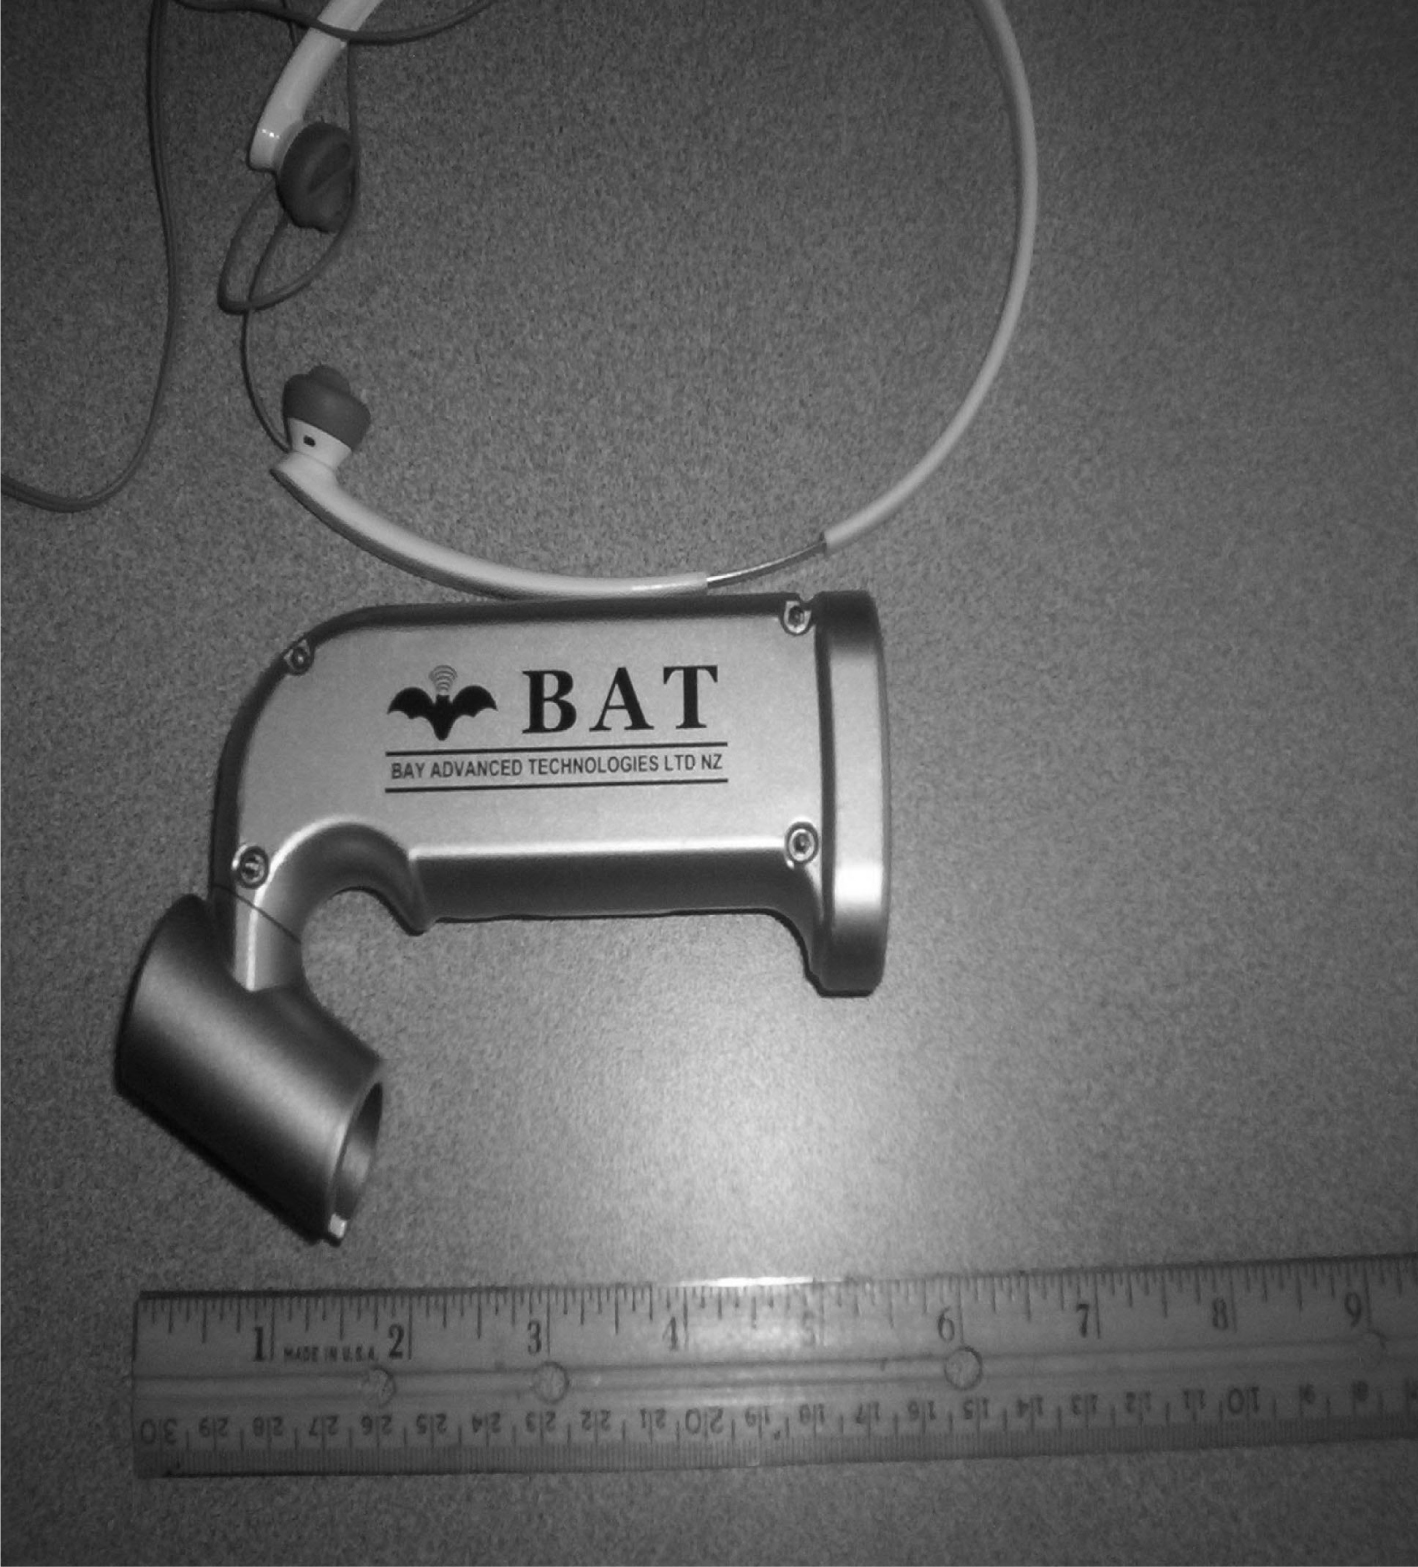
Figure 2.
‘K’ Sonar™ * Device.
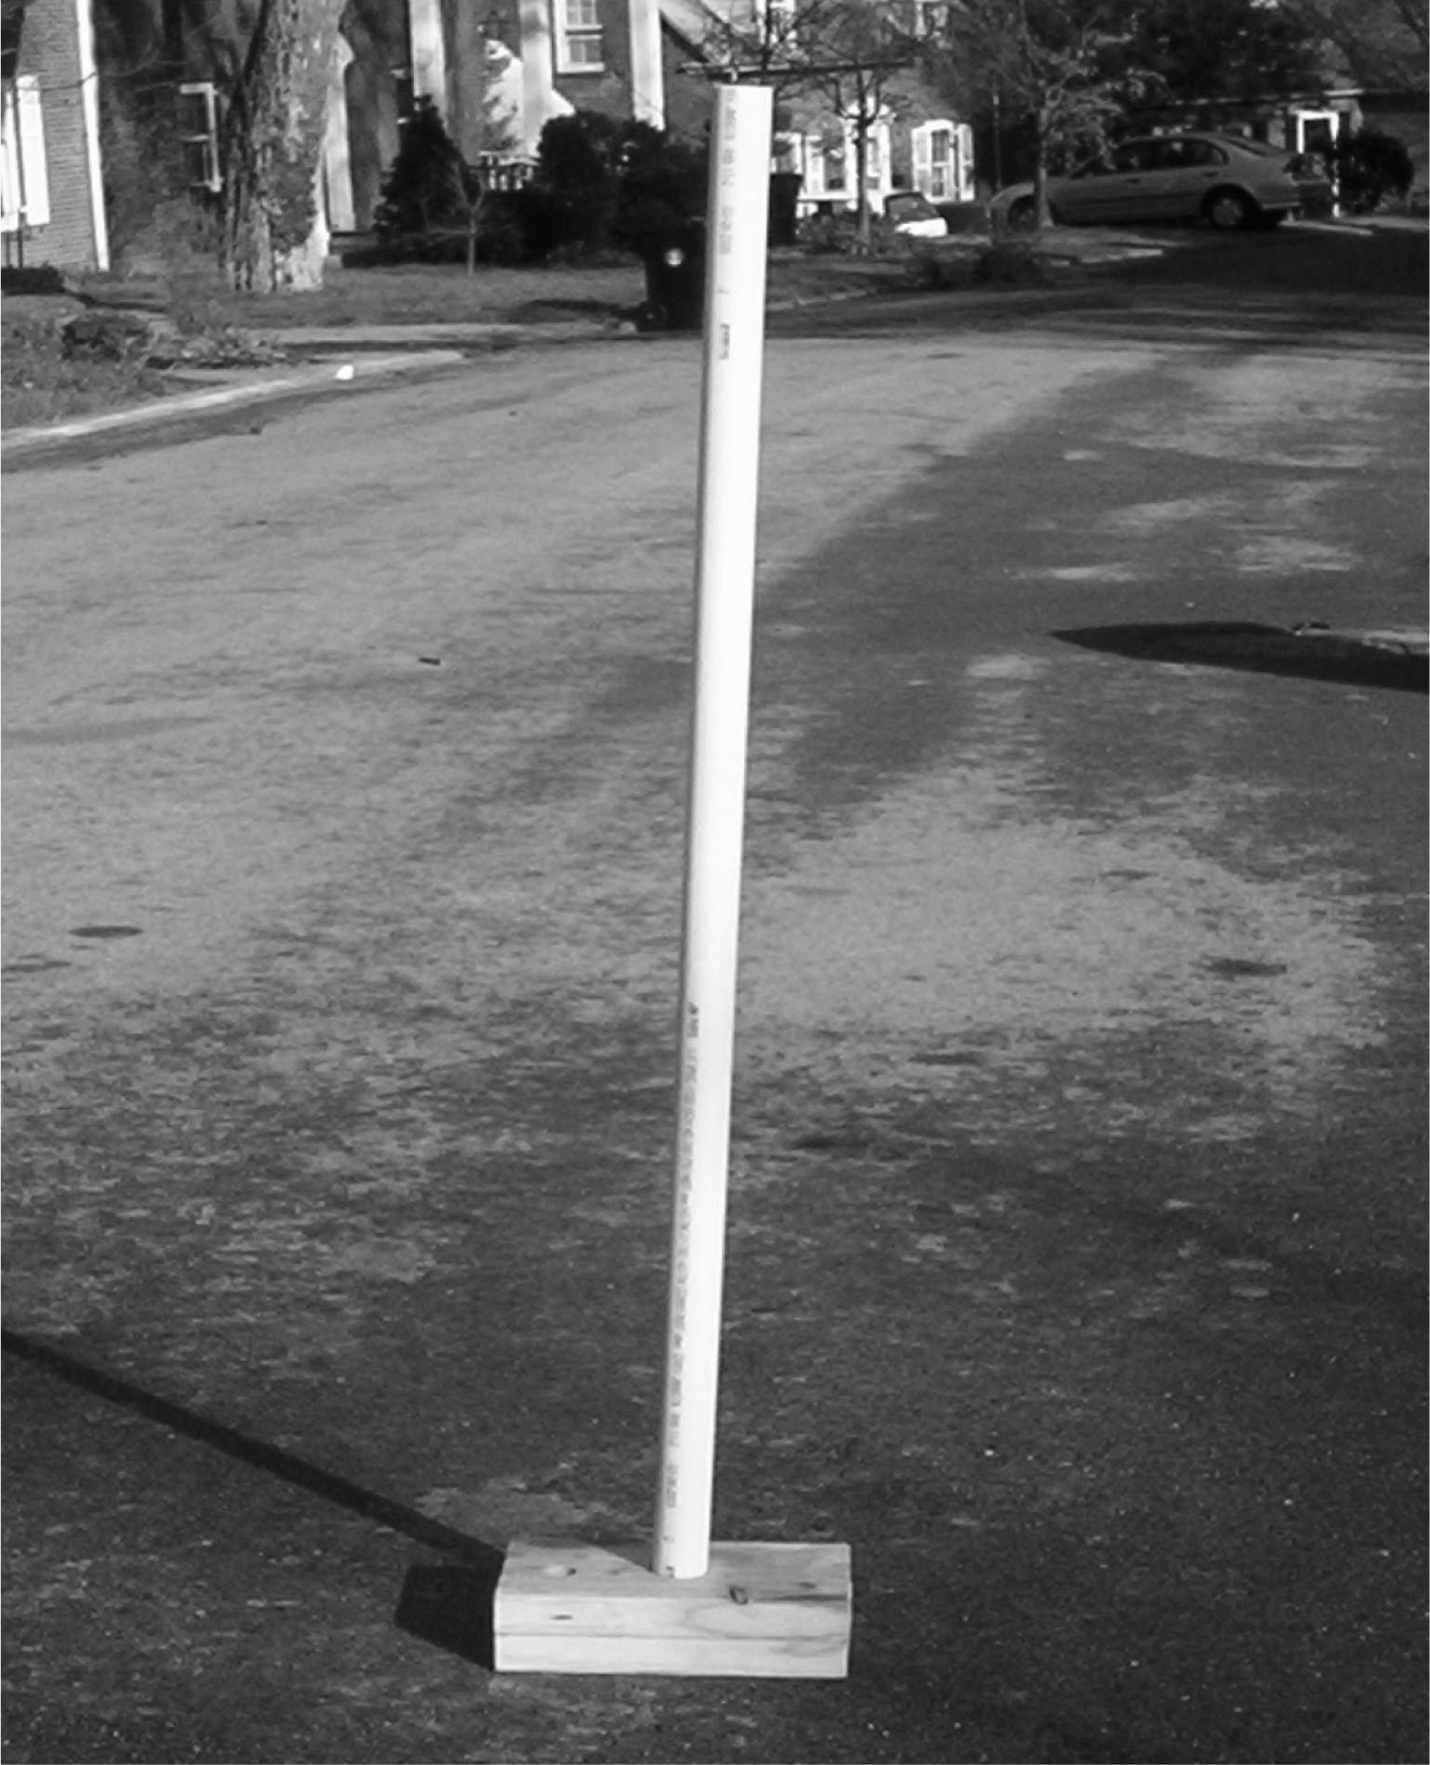
Figure 3.
Man-made vertical obstacle.
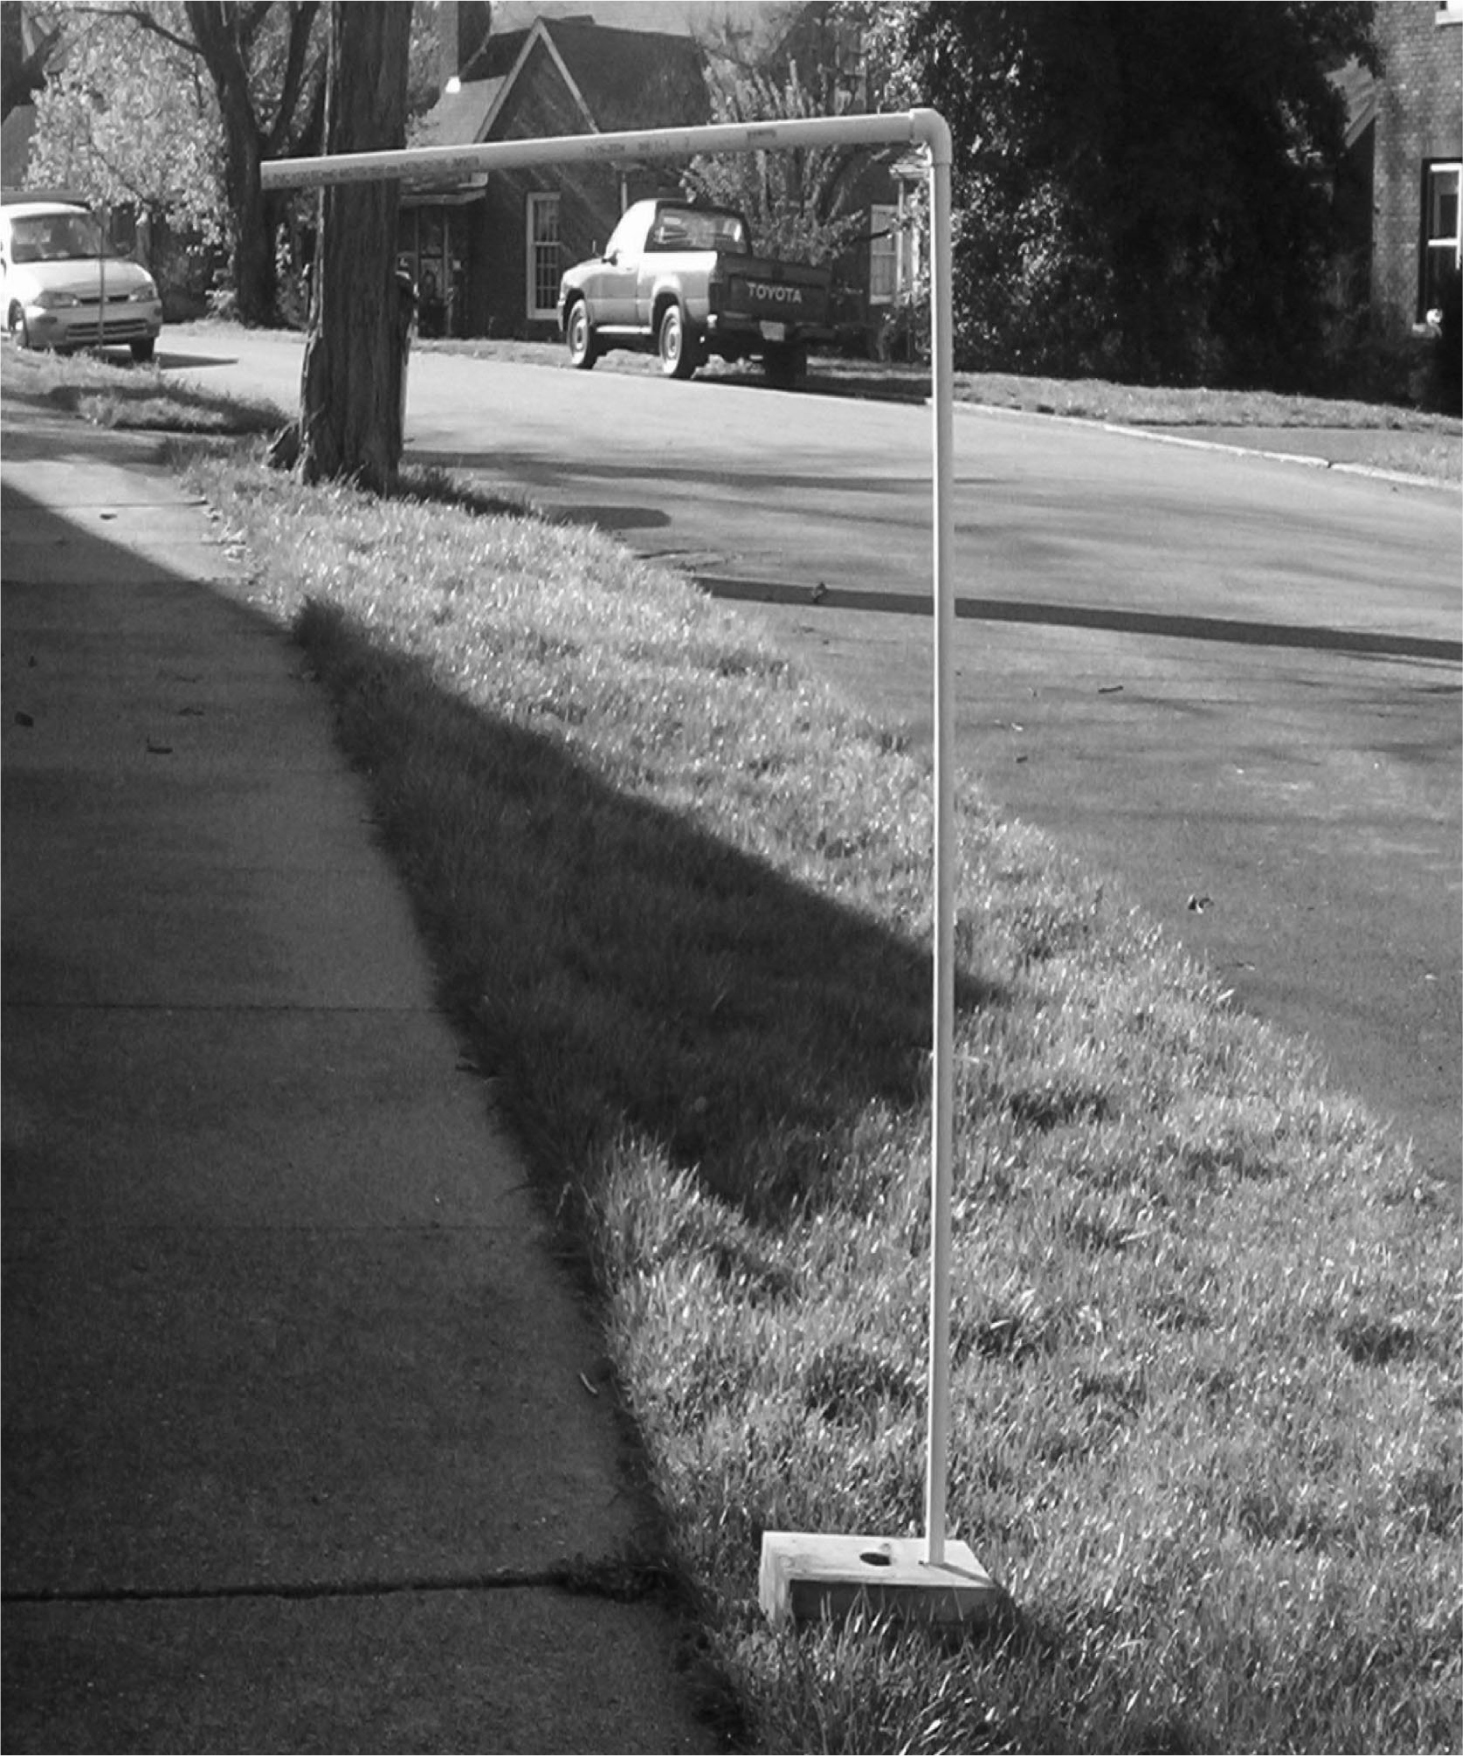
Figure 4.
Man-made horizontal obstacle.
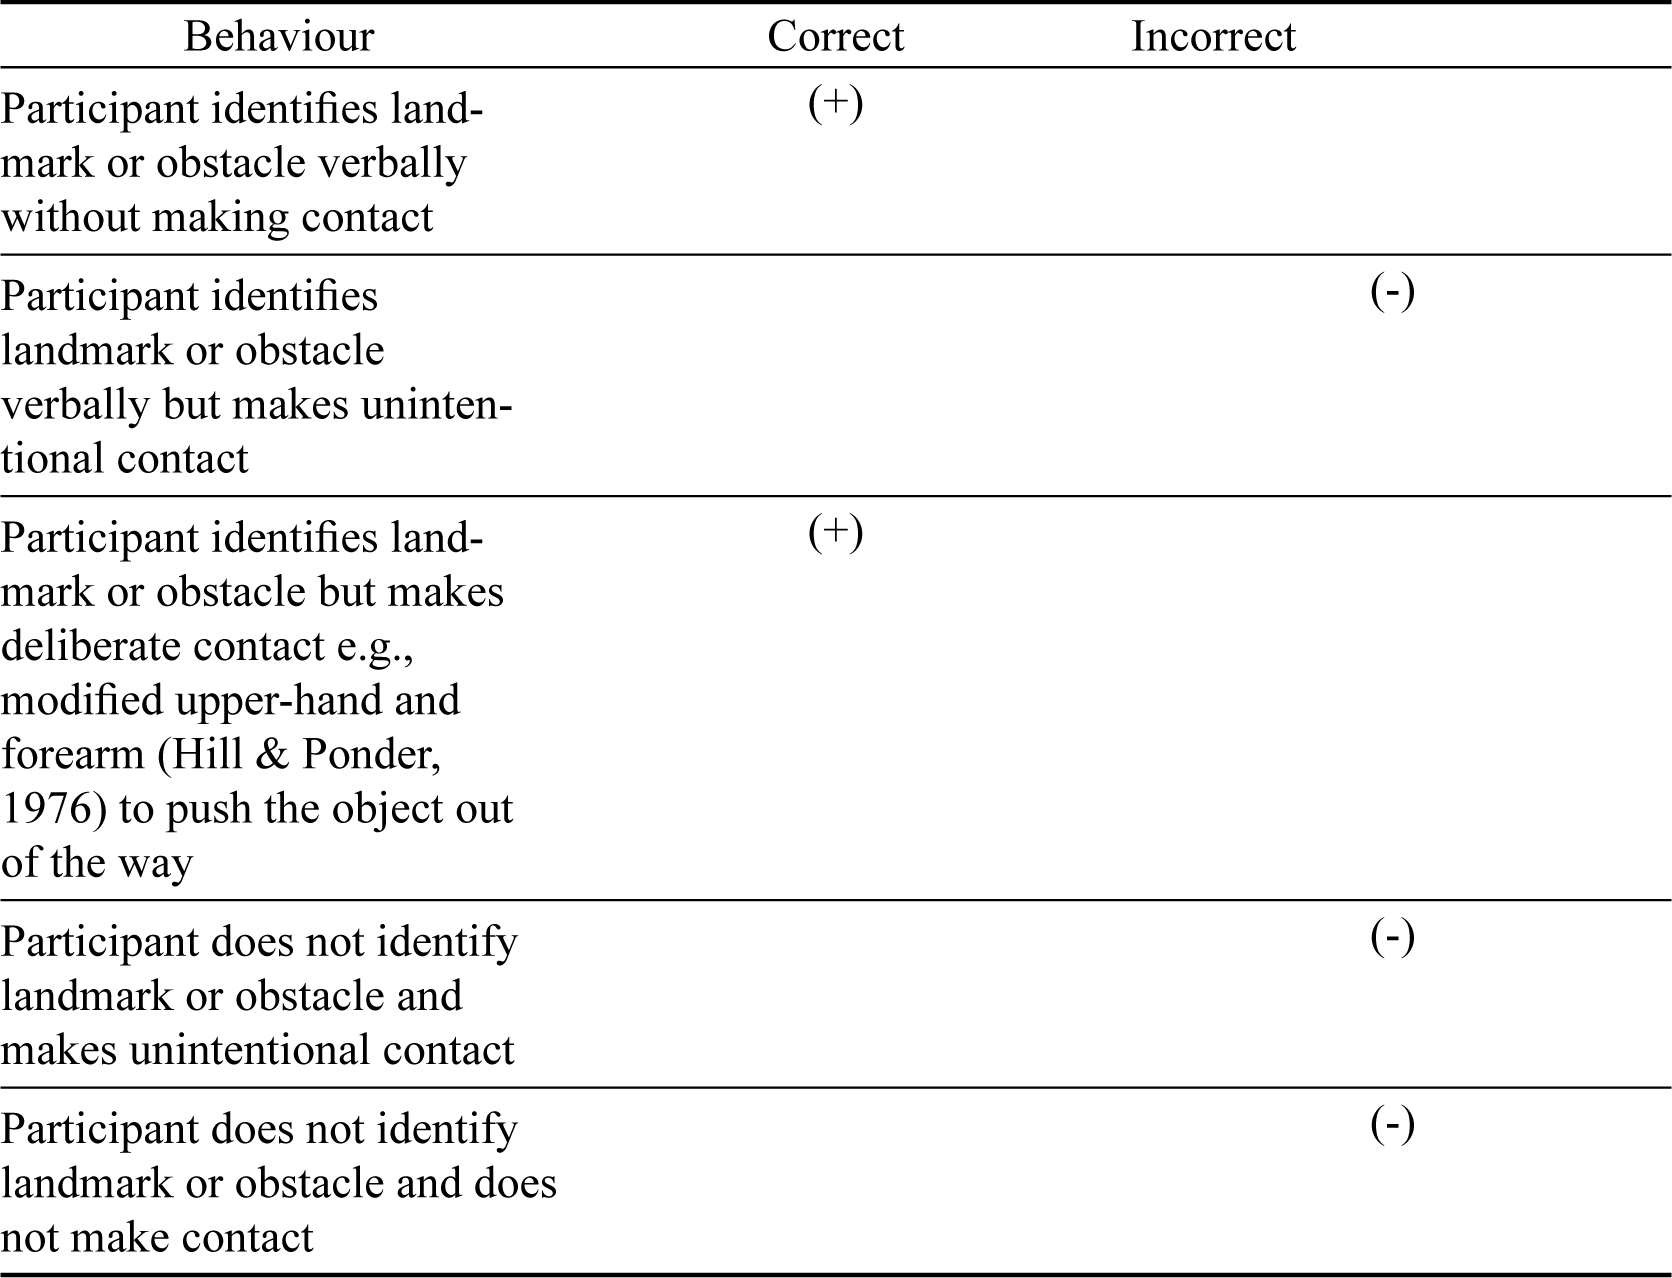
Table 1.
Scoring of correct and incorrect responses.
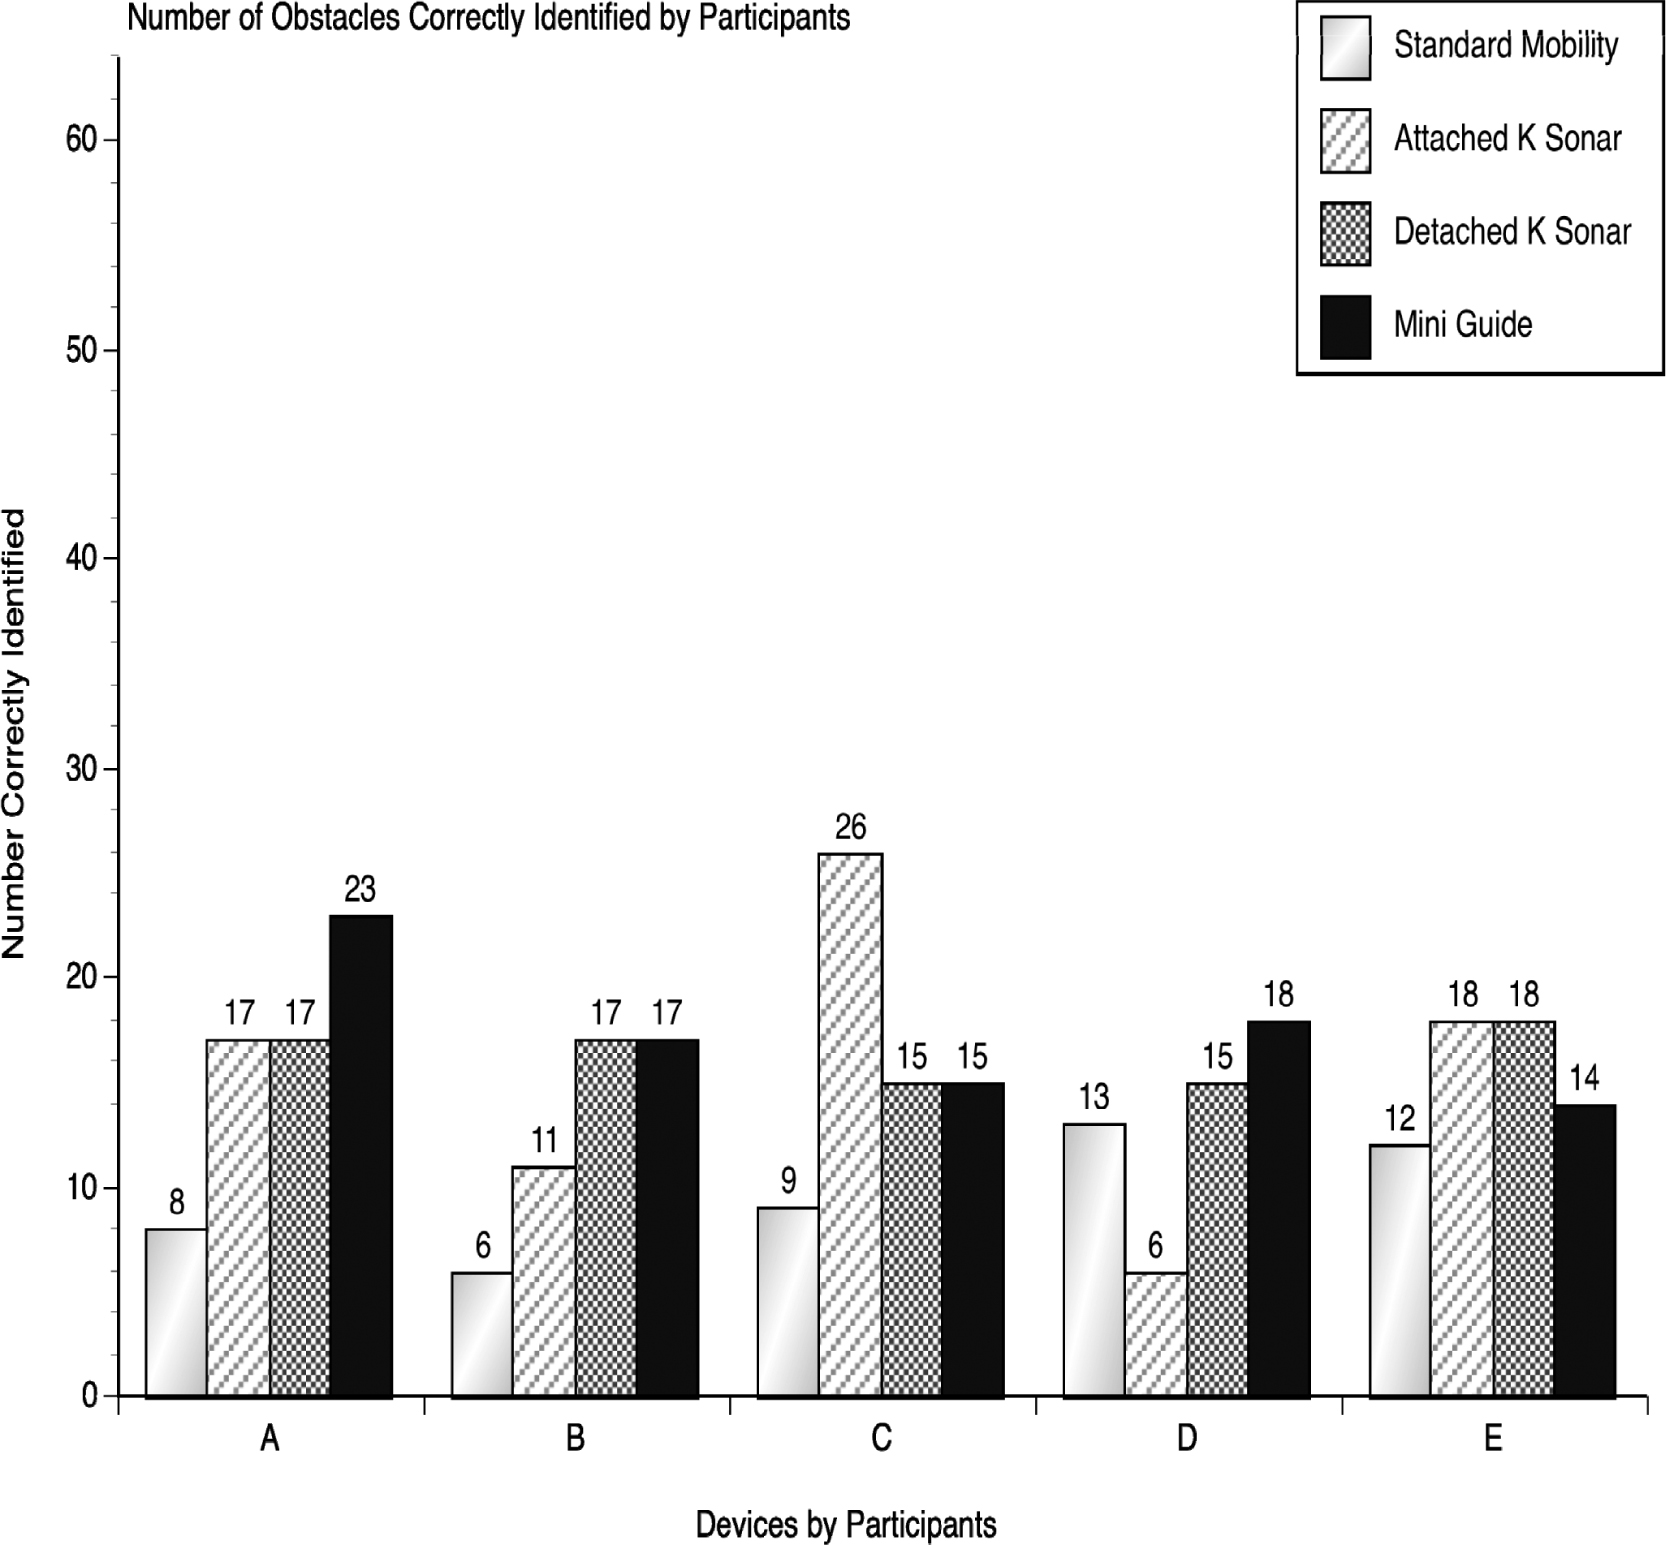
Figure 5.
Subject A through E: Number of obstacles correctly identified.
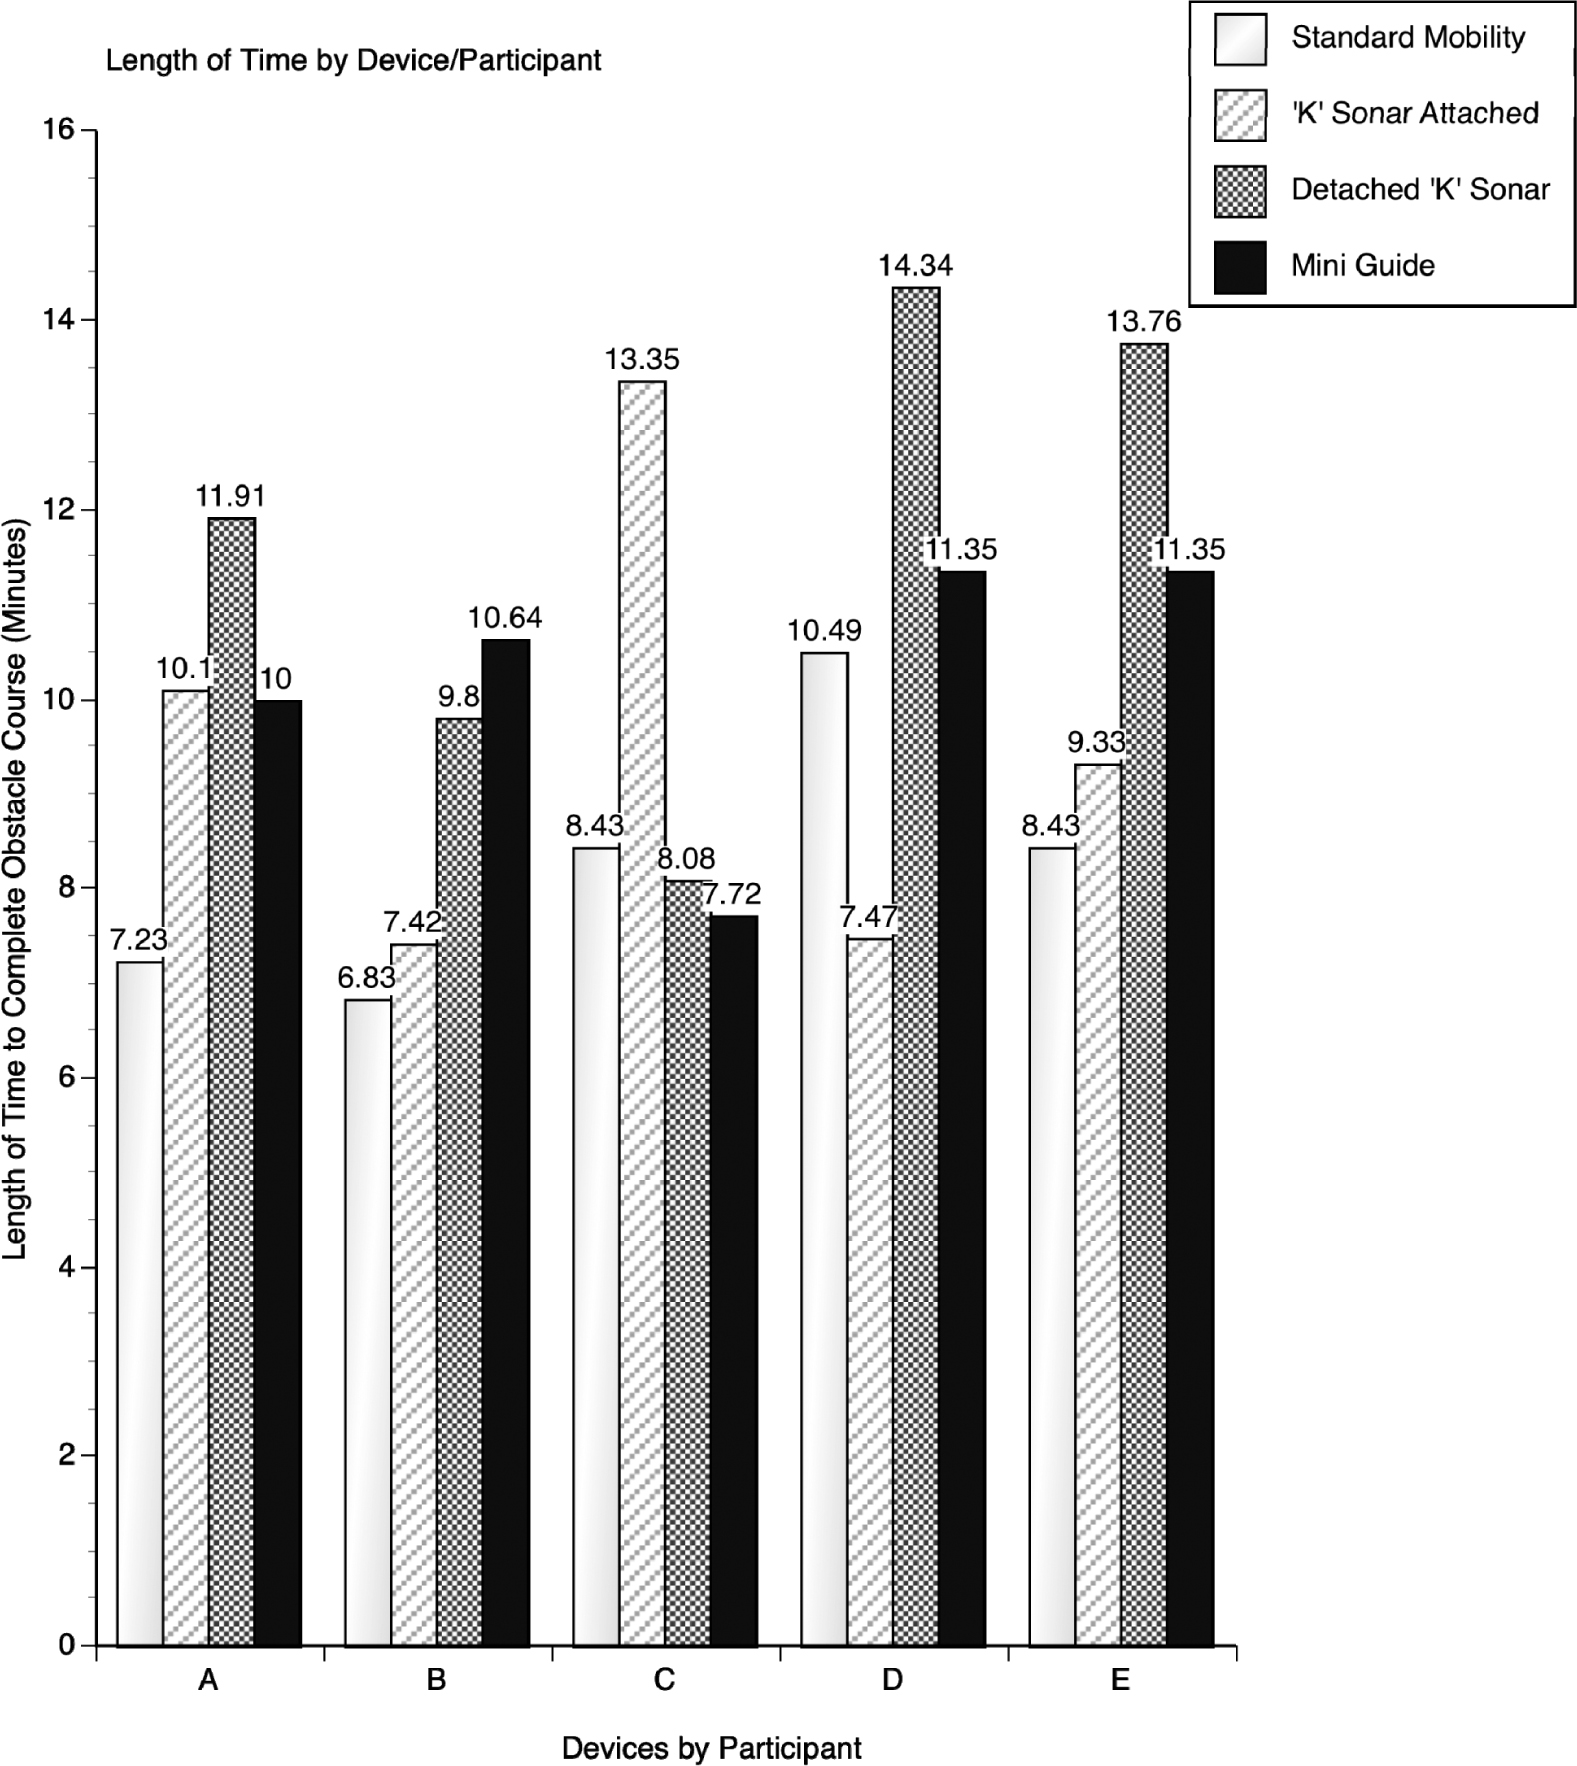
Figure 6.
Subject A through E: Length of time by device/participant.
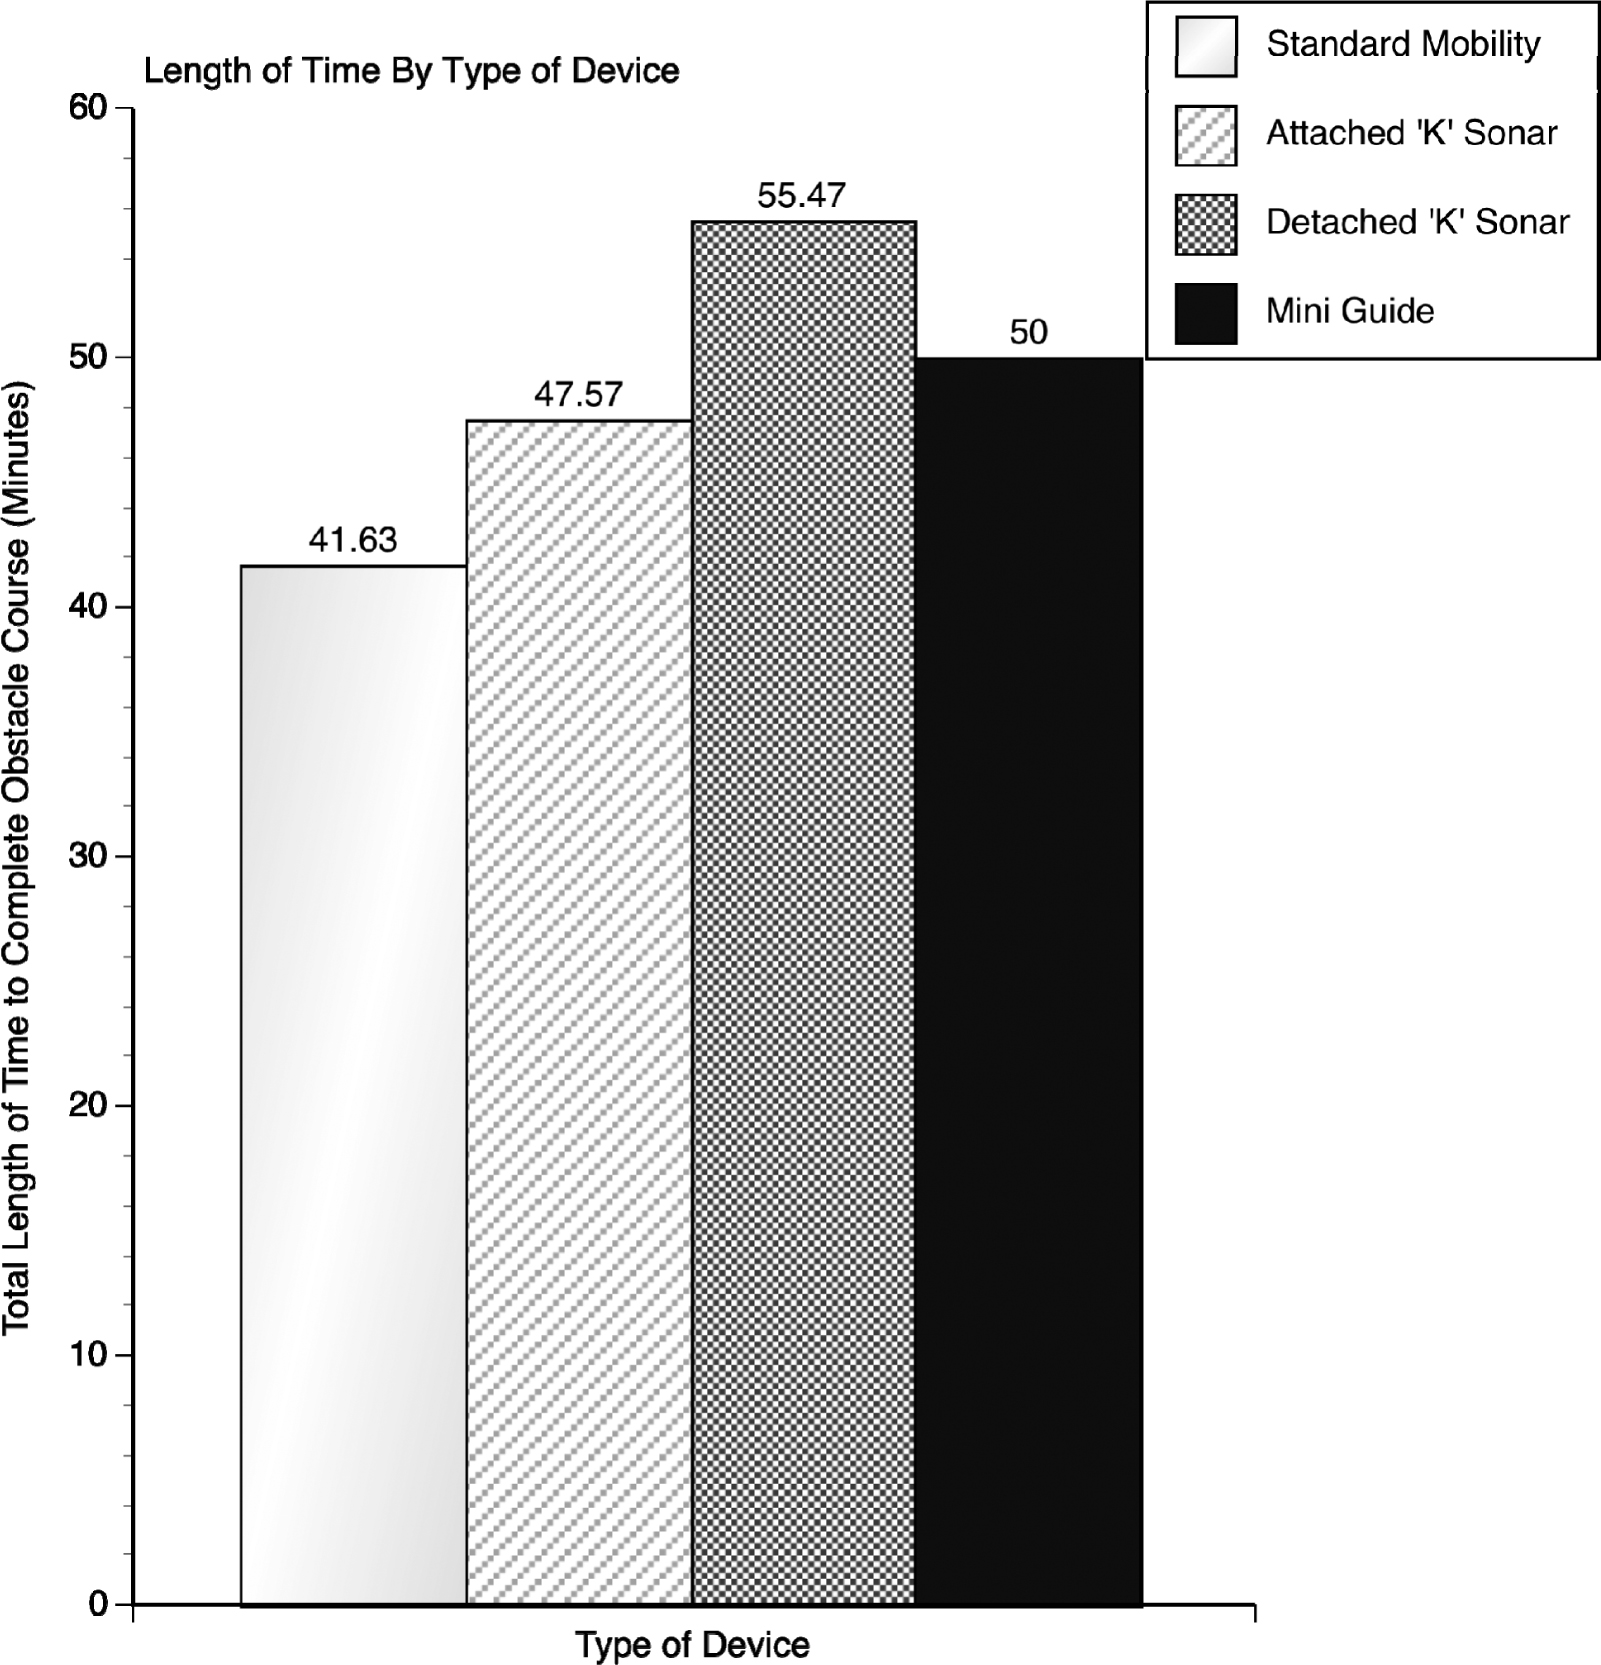
Figure 7.
Length of time by type of device.
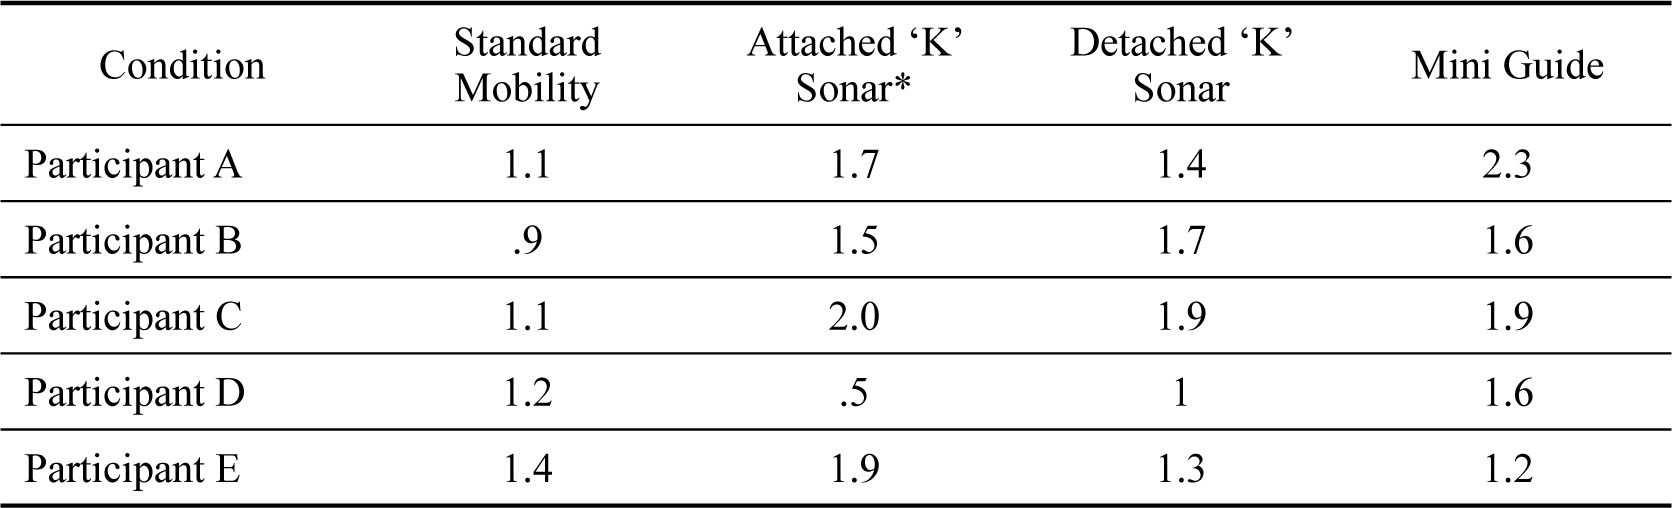
Table 2.
Average obstacles identified per minute.