Table 1.
Table 2.
Table 3.
Table 4.
Table 5.
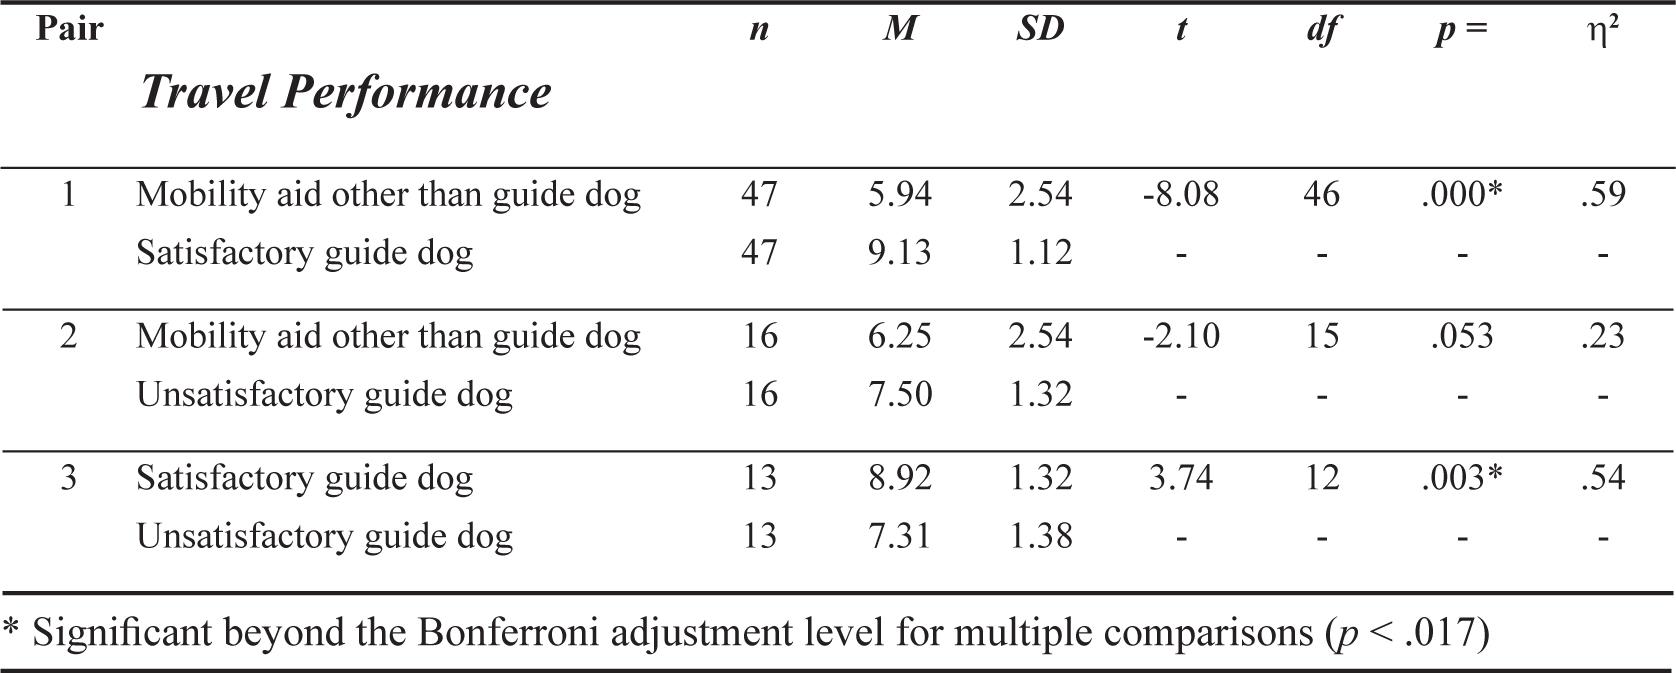
Figure 1.
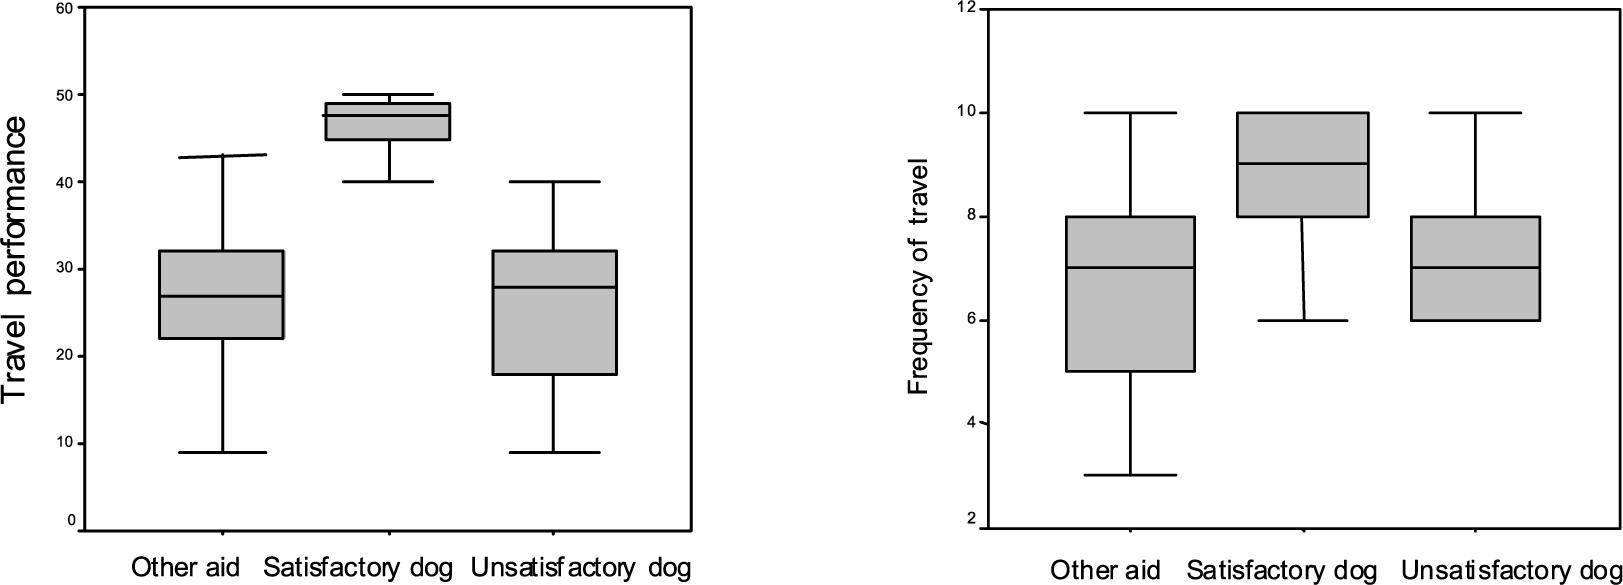
Figure 2.
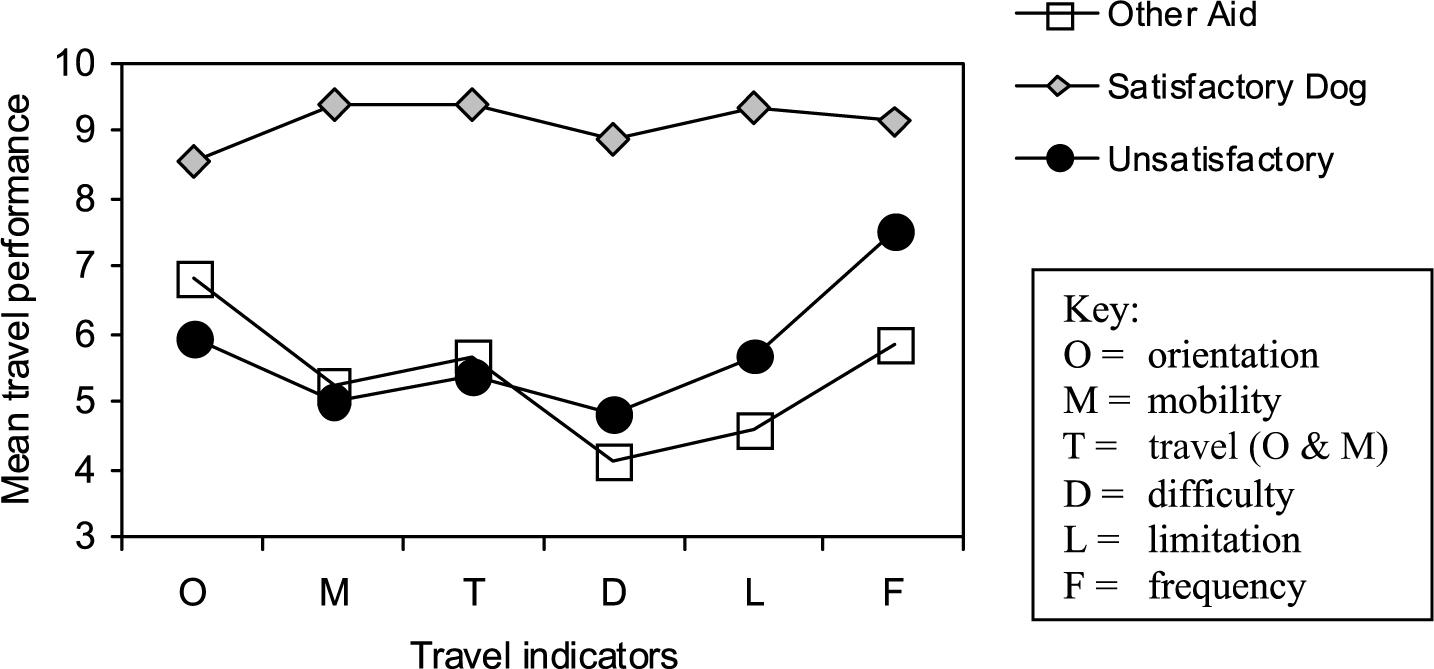
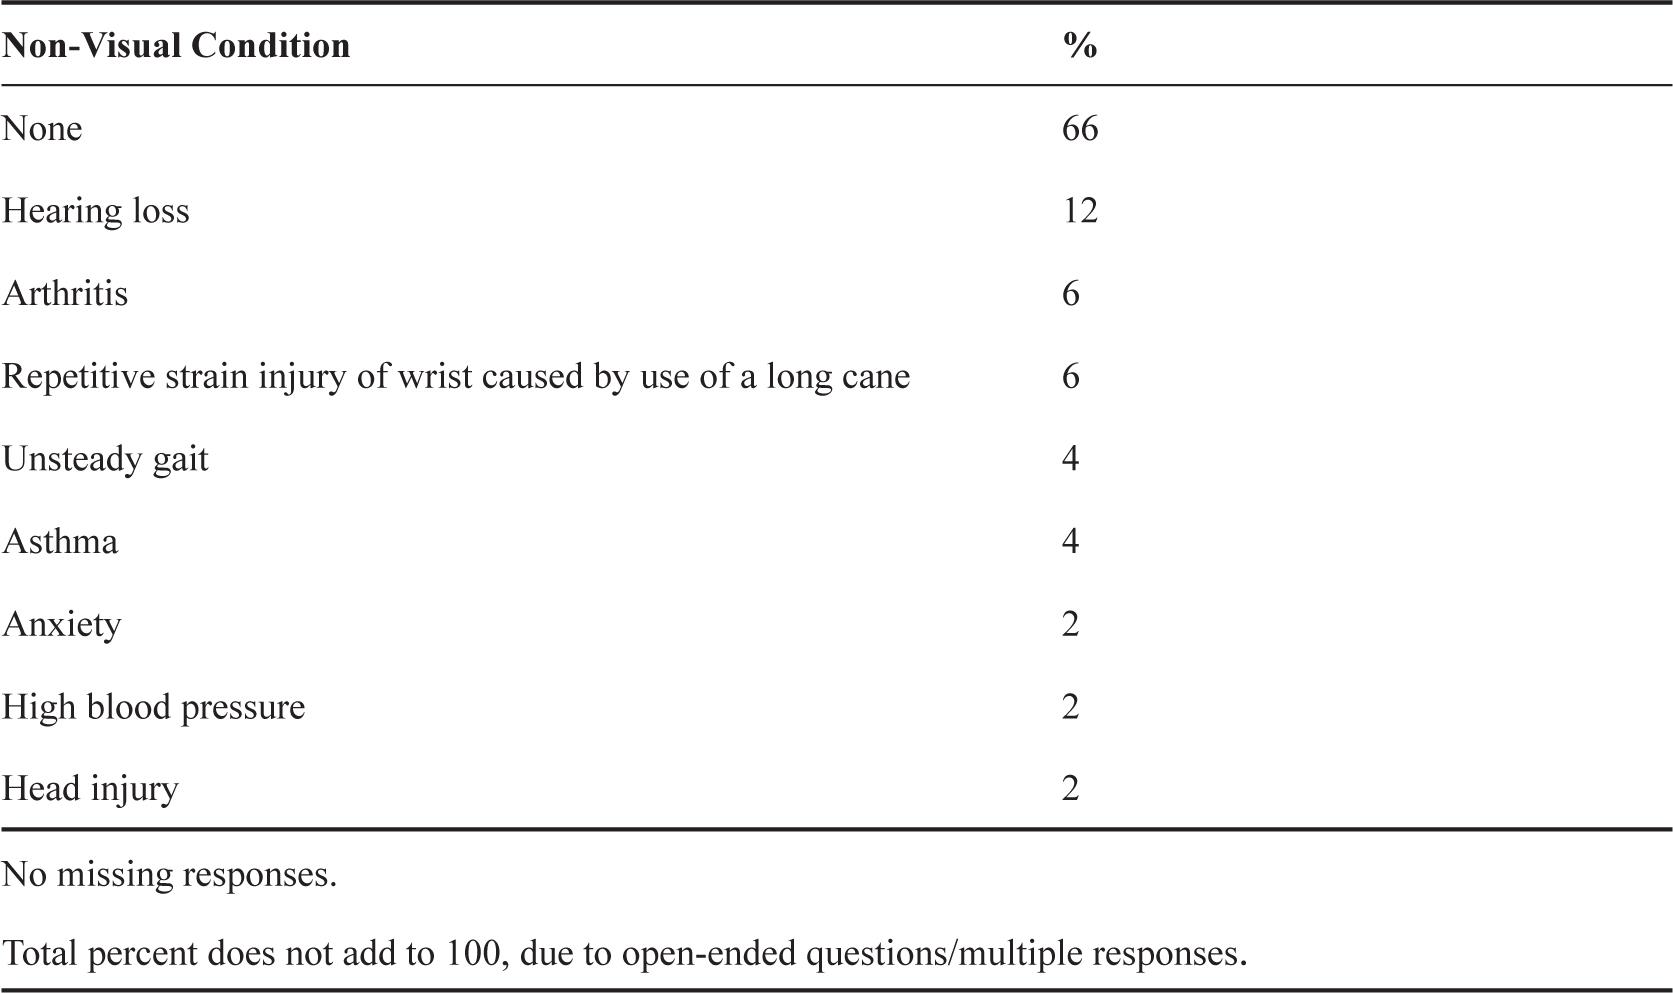
Table 6.

© 2008 Janice K.F. Lloyd, Steven La Grow, Kevin J. Stafford, R. Claire Budge, published by Guide Dogs NSW/ACT
This work is licensed under the Creative Commons Attribution-NonCommercial-NoDerivatives 4.0 License.