
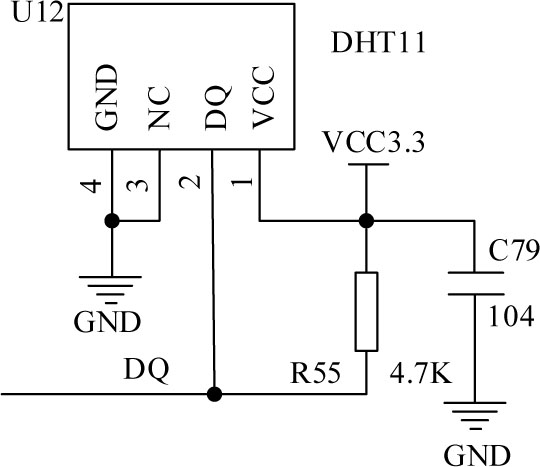
Figure 1
Circuit design of DHT11 module
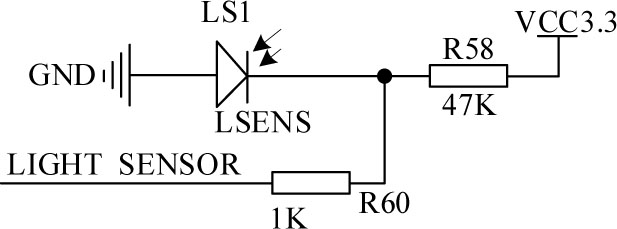
Figure 2
Schematic diagram of optical intensity module
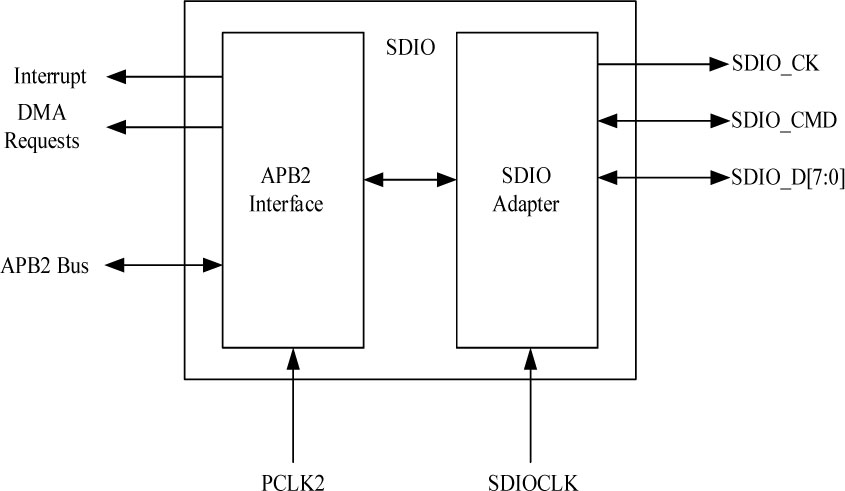
Figure 3
Circuit diagram of light source module
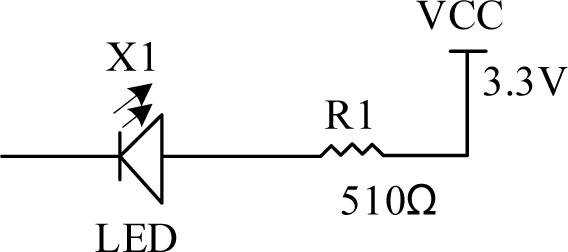
Figure 4
Light source module circuit diagram
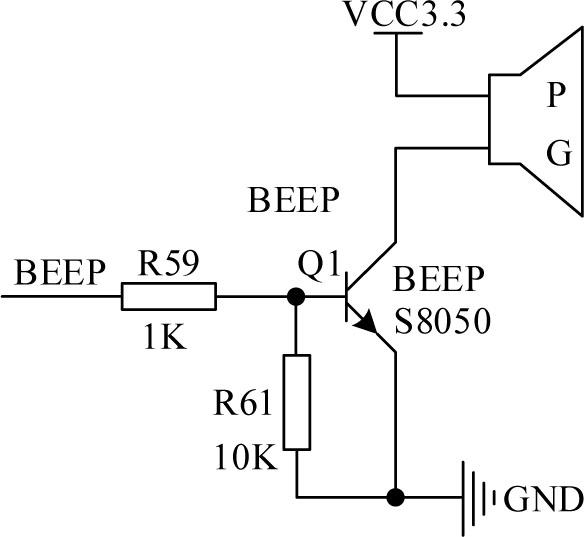
Figure 5
Schematic diagram of buzzer alarm module
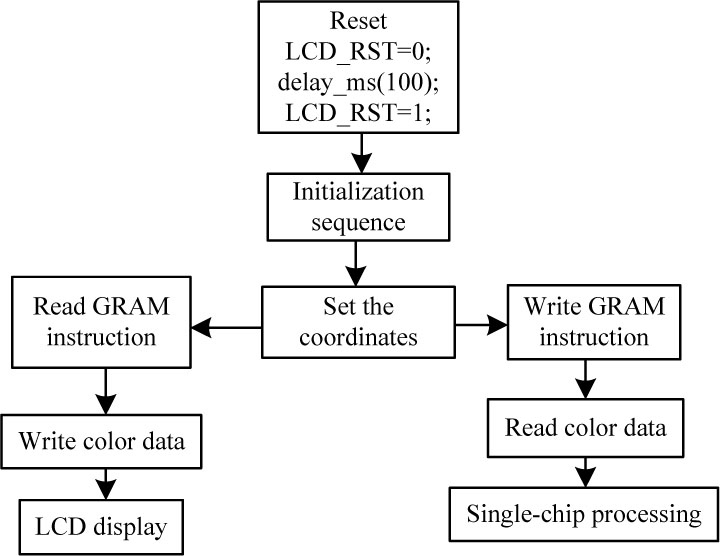
Figure 6
LCD usage flow chart
Table I
STA and TCP client configuration
| Instructions | Functions |
|---|---|
| AT+CWMODE=1 | Set the WiFi module to STA mode |
| AT+RST | Restart the WiFi module to take effect |
| AT+CWJAP="xx", "xxxxxxx" | Add a WiFi hot spot: xx, the password is xxxxxxxx |
| AT+CIPMUX=0 | Enabling single connection |
| AT+CIPSTART="TCP","192.168.1.XXX",8000 | Establish a TCP connection to 192.168.1.xxx,8000 |
| AT+CIPMODE=1 | Enable transparent transmission |
| AT+CIPSEND | Begin to transport |
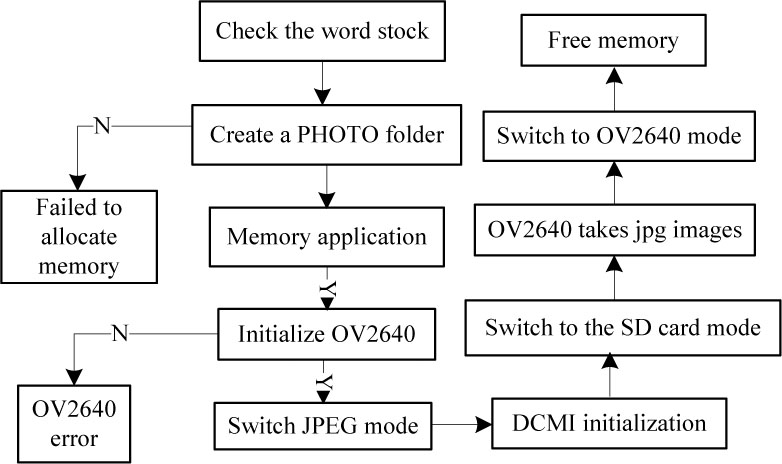
Figure 7
Flowchart of program realization of capture
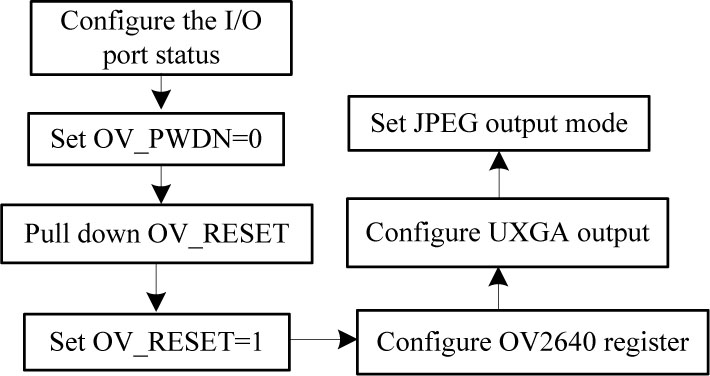
Figure 8
OV2640 initial configuration flowchart
Table II
Automatic adjustment of light source
| Light intensity values (adcx) | Comparing values (ledpwm val) |
|---|---|
| adcx>50 | 0 |
| 30<adcx⩽50 | 100 |
| 20<adcx⩽30 | 300 |
| adcx⩽20 | 500 |
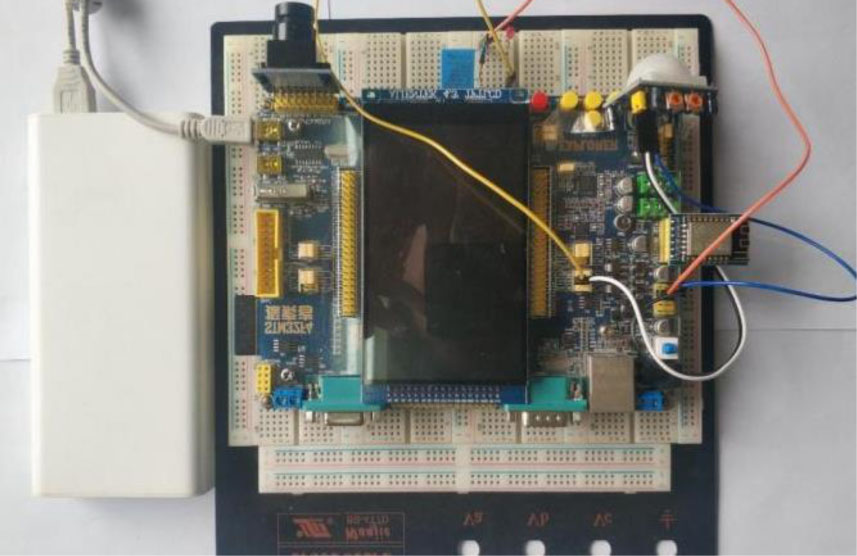
Figure 9
System physical drawing
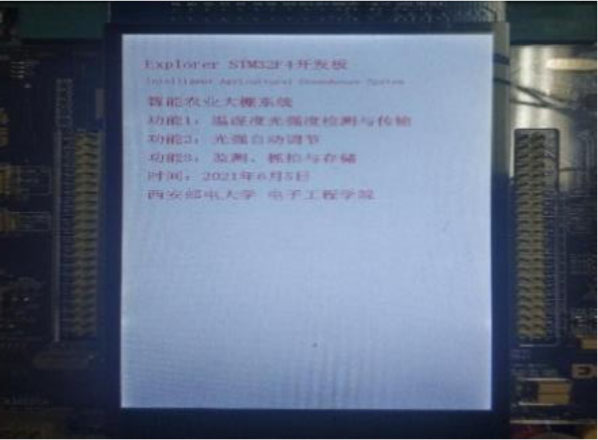
Figure 10
System startup interface
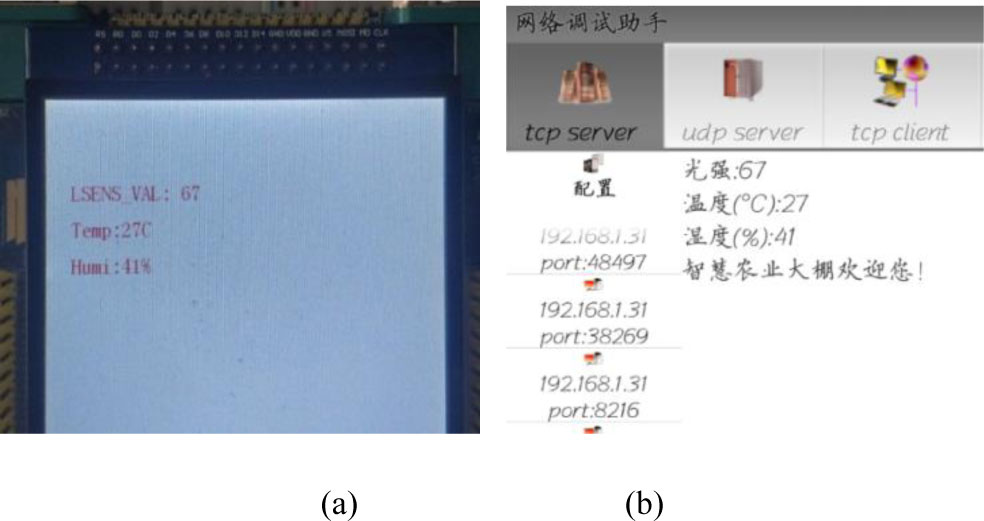
Figure 11
(a) Screen display at 8:00, (b) Upper computer display at 8:00
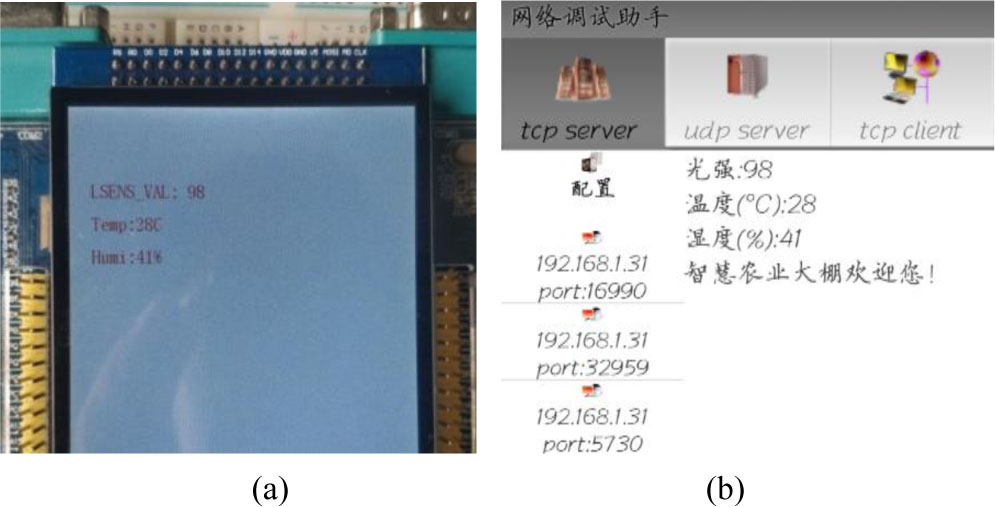
Figure 12
(a) Screen display at 13:00; (b) Display of upper computer at 13:00
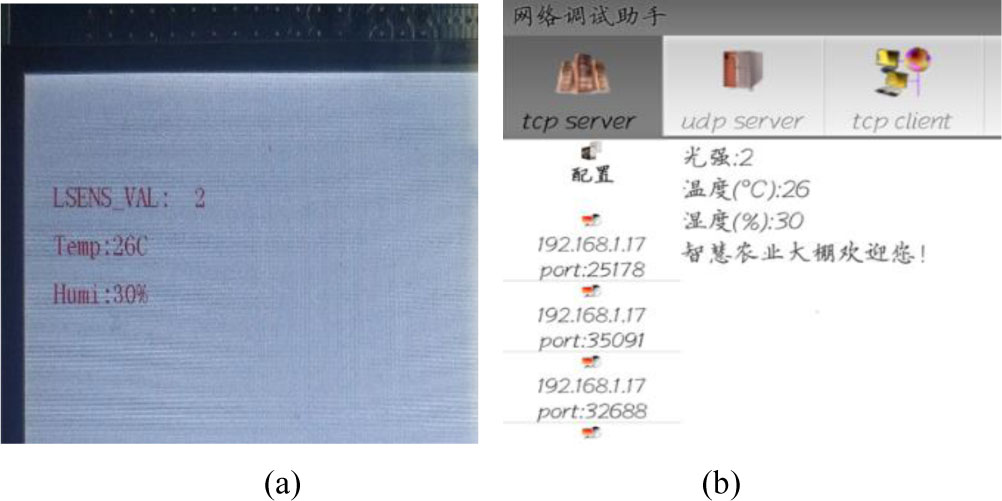
Figure 13
(a) Screen display at 20:00; (b) Upper computer display at 20:00
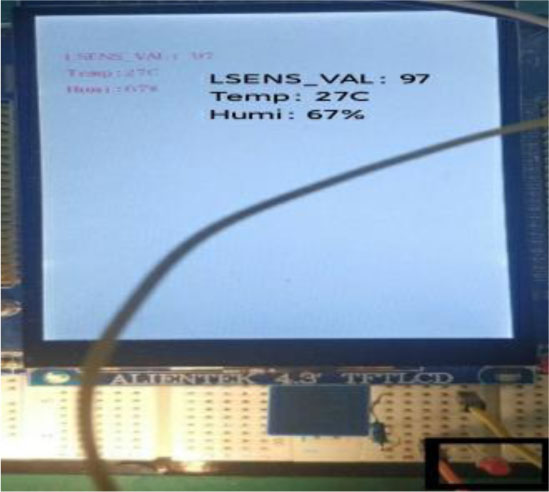
Figure 14
The first group of auto-adjusting light source
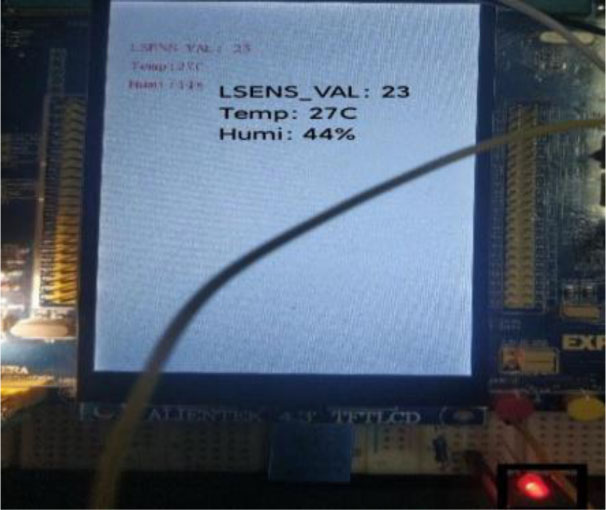
Figure 15
The second group of test pictures of automatic adjusting light source
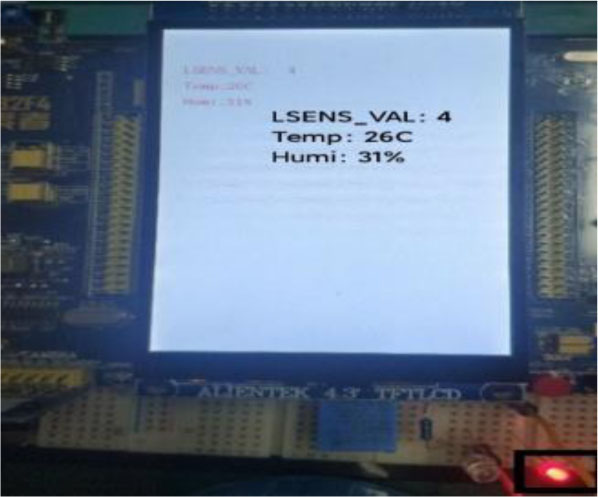
Figure 16
The third group of test pictures of automatic adjusting light source
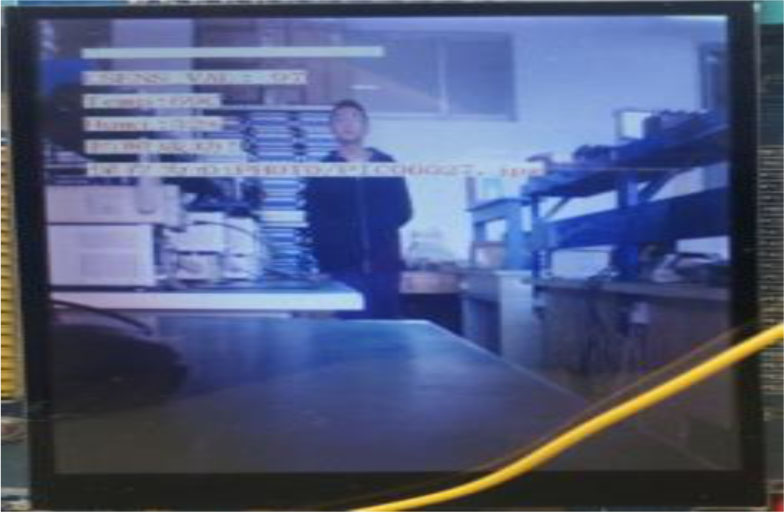
Figure 17
Capture group 1 (1)
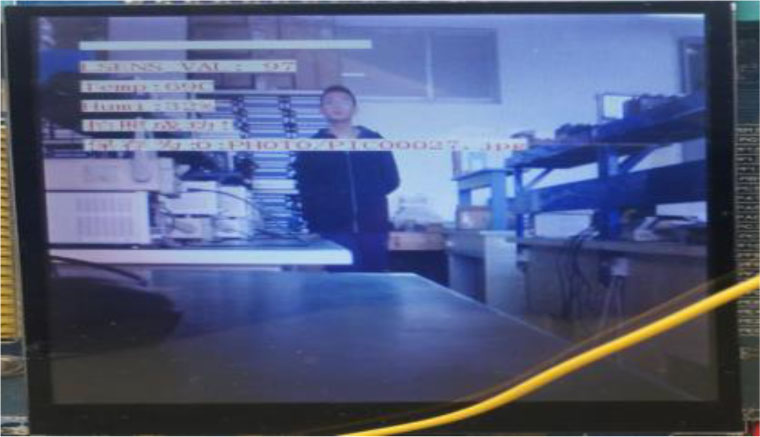
Figure 18
Capture group 1 (2)
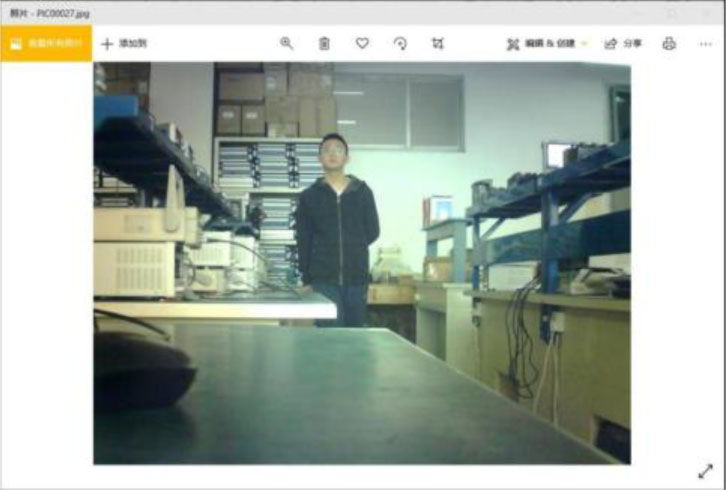
Figure 19
Capture group 1 (3)
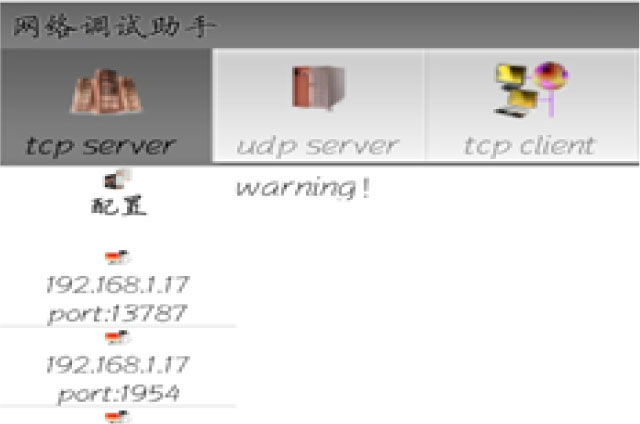
Figure 20
Capture group 1 (4)
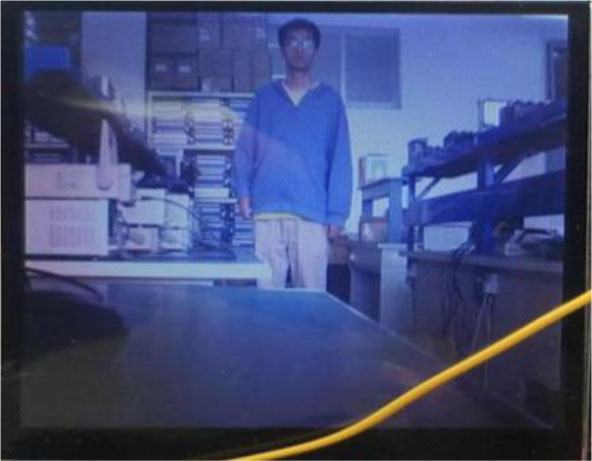
Figure 21
Capture group 2 (1)
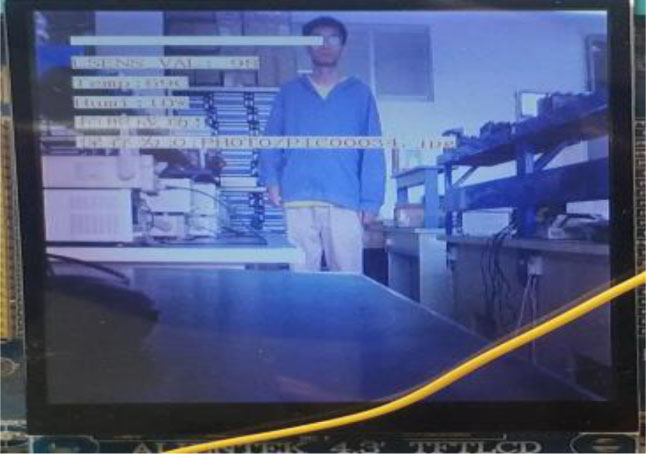
Figure 22
Capture group 2 (2)
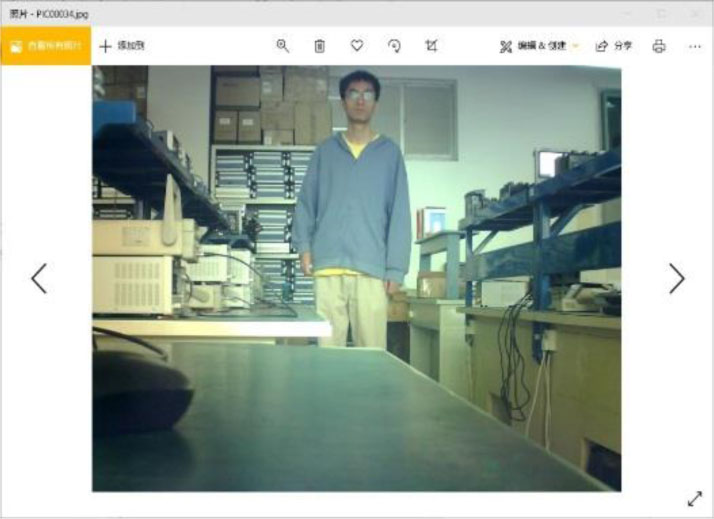
Figure 23
Capture group 2 (3)
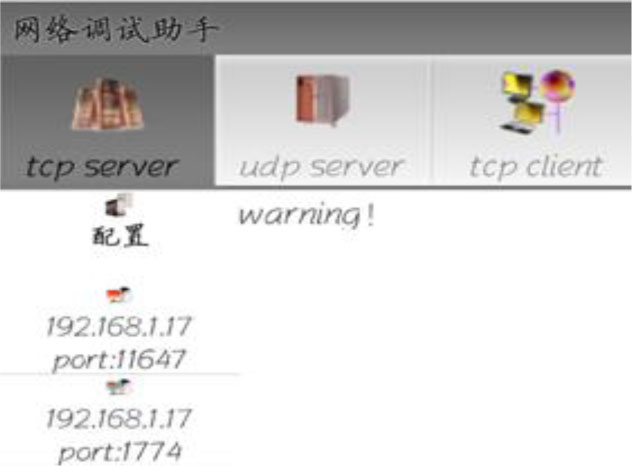
Figure 24
Capture group 2 (4)