
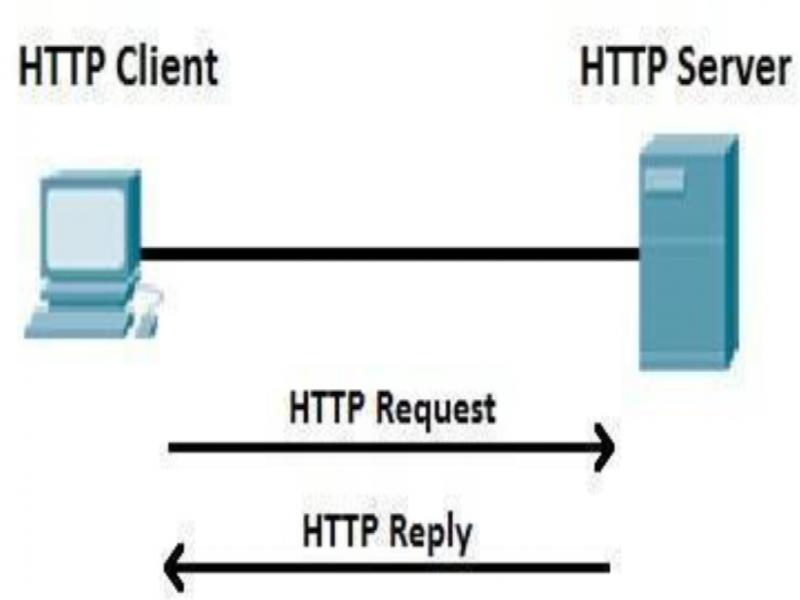
Figure 1.
HTTP protocol transmission process.
TABLE I.
list of test websites
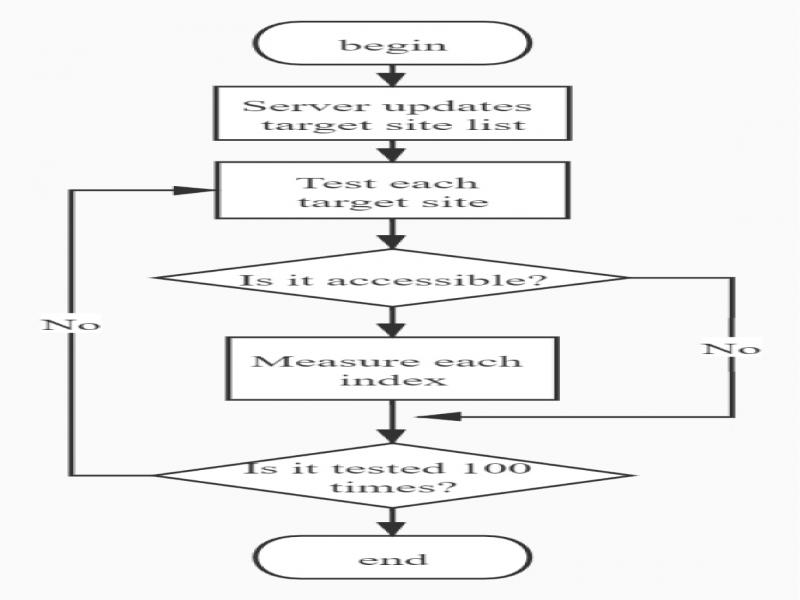
Figure 2.
Flow chart of index measurement.
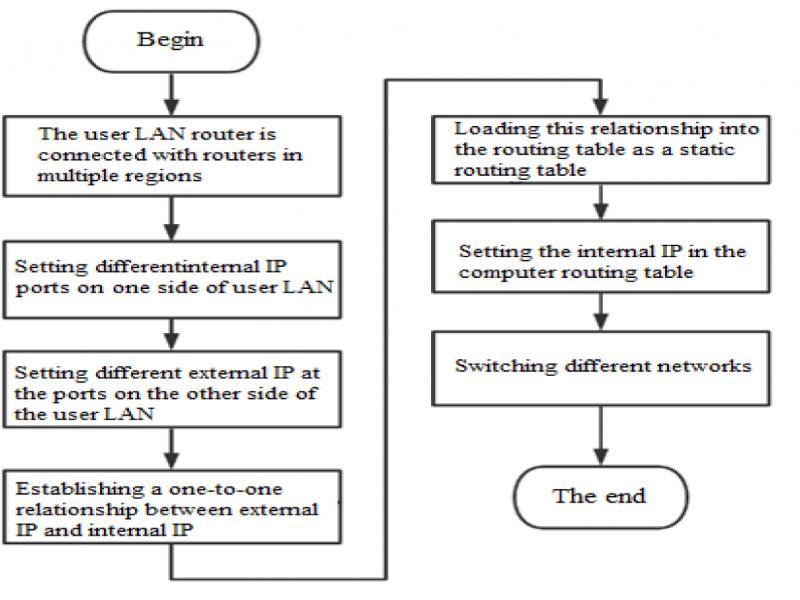
Figure 3.
Flow chart of user’s dynamic selection of network.
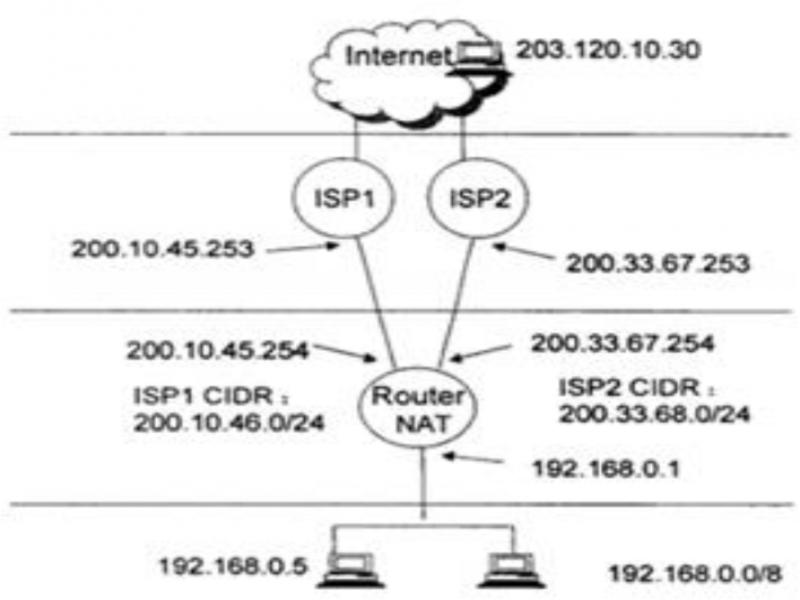
Figure 4.
Connection diagram for users to dynamically select ISPs to access the Internet.
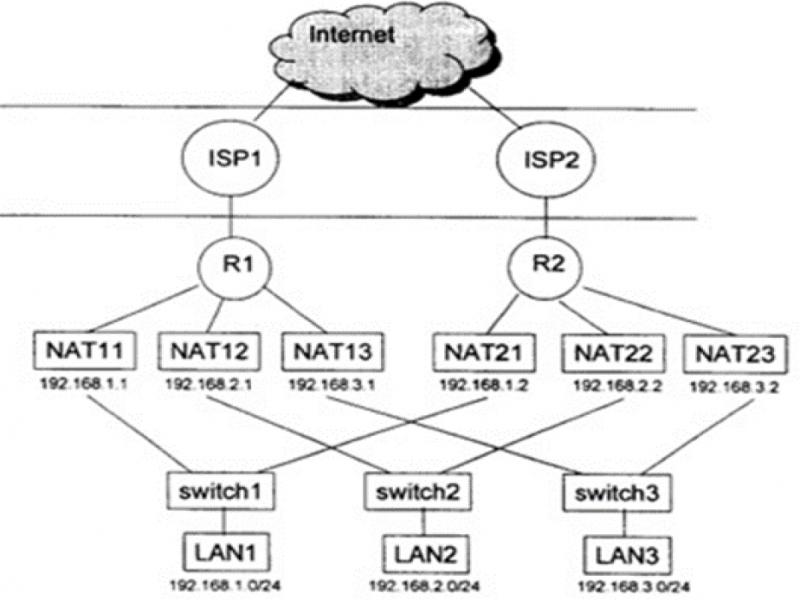
Figure 5.
an application example in many users.