
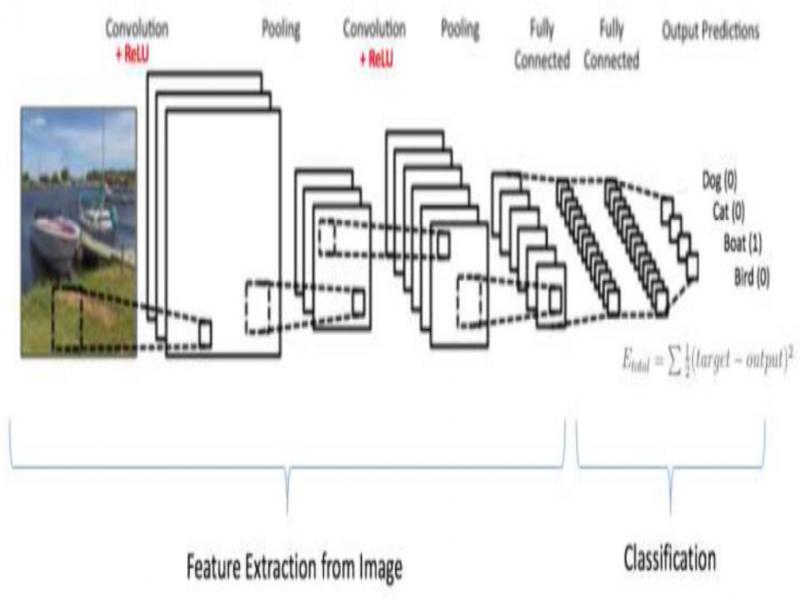
Figure 1.
An example of CNN architecture [10]
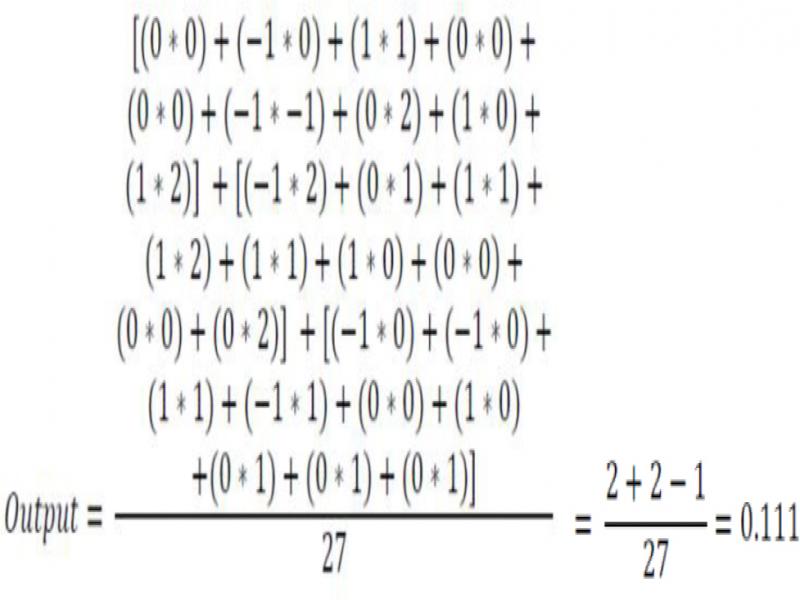
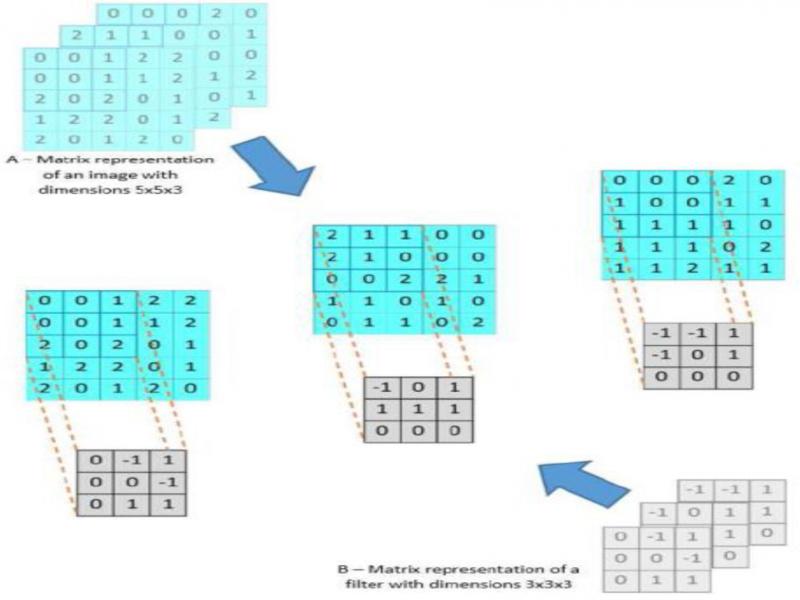
Figure 2.
The process of convolution on the left-hand corner of an image
Figure 3.
Population of three chromosomes
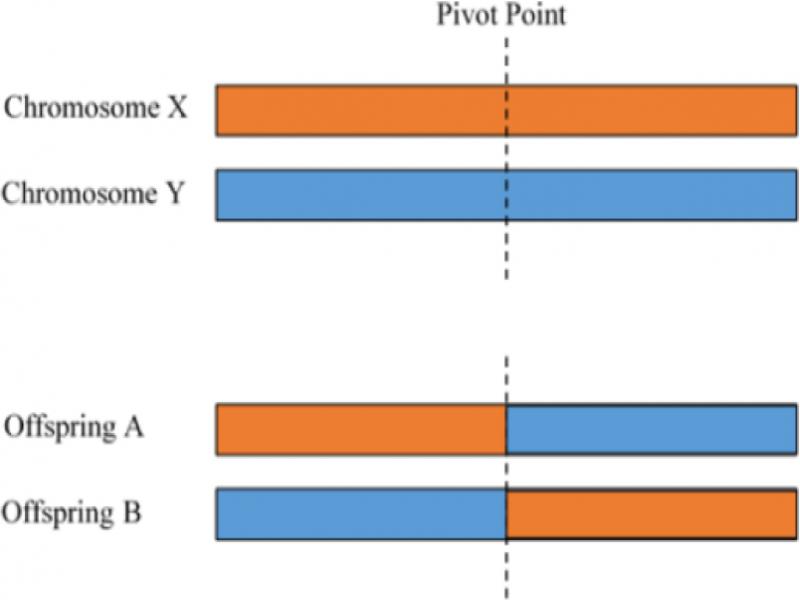
Figure 4.
Single-point crossover
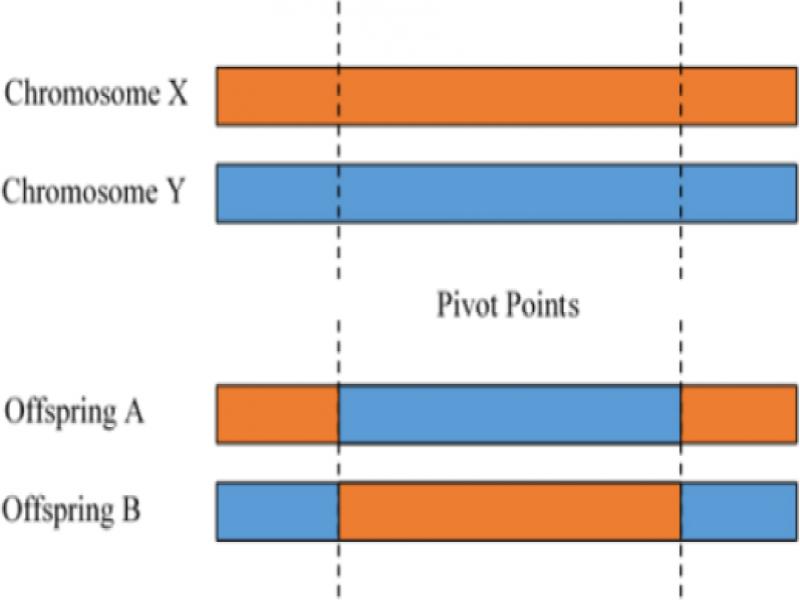
Figure 5.
Two-point crossover
TABLE 1.
The various hyper parameters in CNN with their ranges
| Hyper parameter | Range |
|---|---|
| No. of Epoch | (0 – 127) |
| Batch Size | (0 – 256) |
| No. of Convolution Layers | (0 – 8) |
| No. of Filters at each Convo layer | (0 – 64) |
| Convo Filter Size at each Convo layer | (0 – 8) |
| Activations used at each Convo layer | (sigmoid, tanh, relu, linear) |
| Maxpool layer after each Convo layer | (true, false) |
| Maxpool Pool Size for each Maxpool layer | (0 – 8) |
| No. of Feed-Forward Hidden Layers | (0 – 8) |
| No. of Feed-Forward Hidden Neurons at each layer | (0 – 64) |
| Activations used at each Feed-Forward layer | (sigmoid, tanh, softmax, relu) |
| Optimizer | (Adagrad, Adadelta, RMS, SGD) |
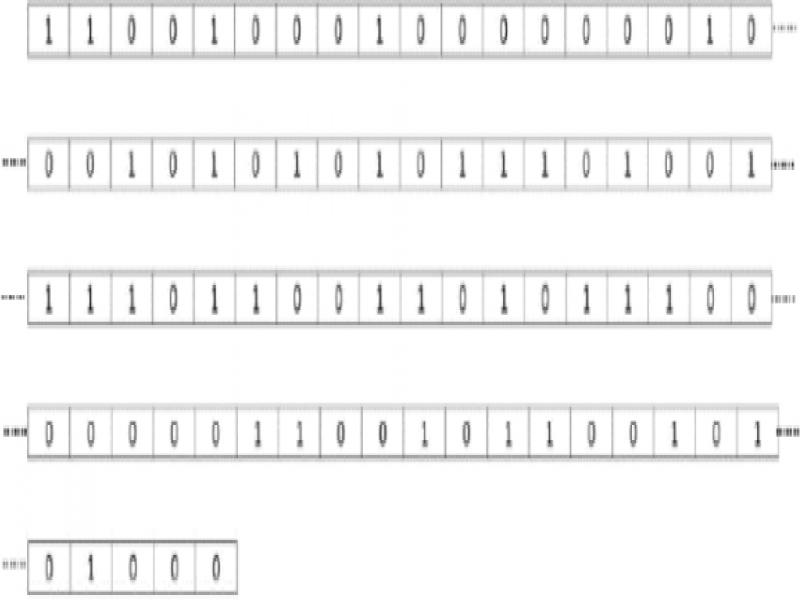
Figure 6.
Representation of a GA chromosome
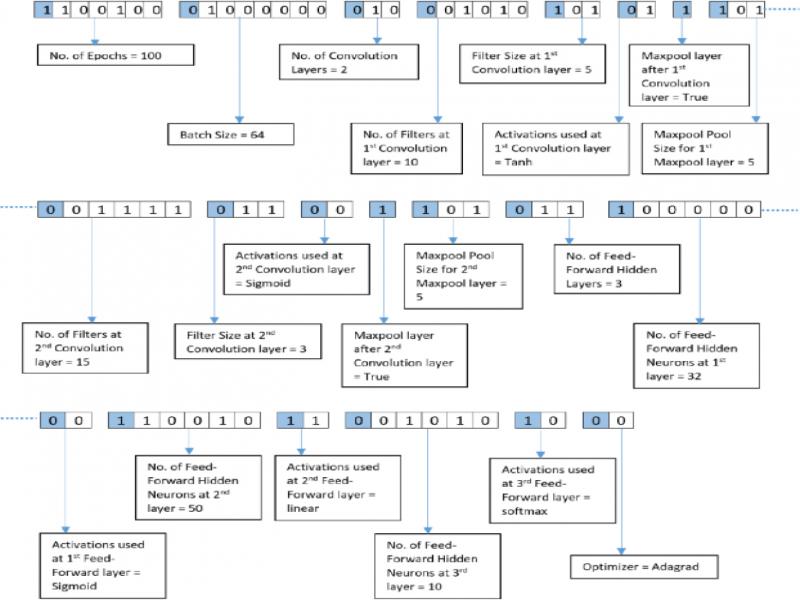
Figure 7.
Representation of the hyper-parameters in binary format
TABLE 2.
Parameters of the genetic operations
| Parameters | Value |
|---|---|
| Tournament selection size | 2 |
| Crossover Probability | 50% |
| Mutation probability | 80% |
| Genes Mutated | 10% |
TABLE 3.
Highest fitness values obtained during each of the 10 experiments
| Exp. No. | Highest Fitness Value |
|---|---|
| 1 | 0.984499992943 |
| 2 | 0.973899998105 |
| 3 | 0.988800008184 |
| 4 | 0.991900001359 |
| 5 | 0.947799991965 |
| 6 | 0.949000005102 |
| 7 | 0.983099997652 |
| 8 | 0.979799999475 |
| 9 | 0.956399999567 |
| 10 | 0.972350000068 |
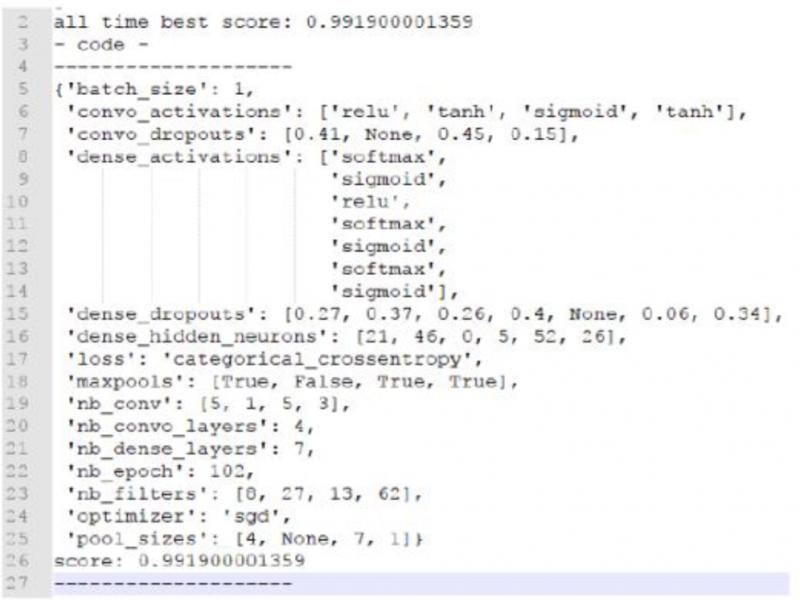
Figure 8.
Generated CNN architecture after GA tuning