
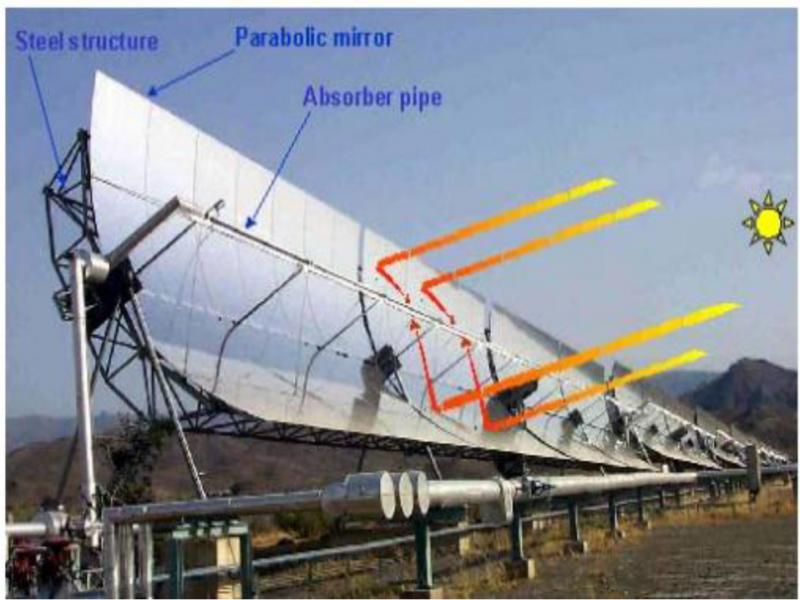
Figure 1.
Principle of parabolic trough solar collector
(Source: “Solar Power – Photovoltaics or Solar Thermal Power Plants?” Oct2001)
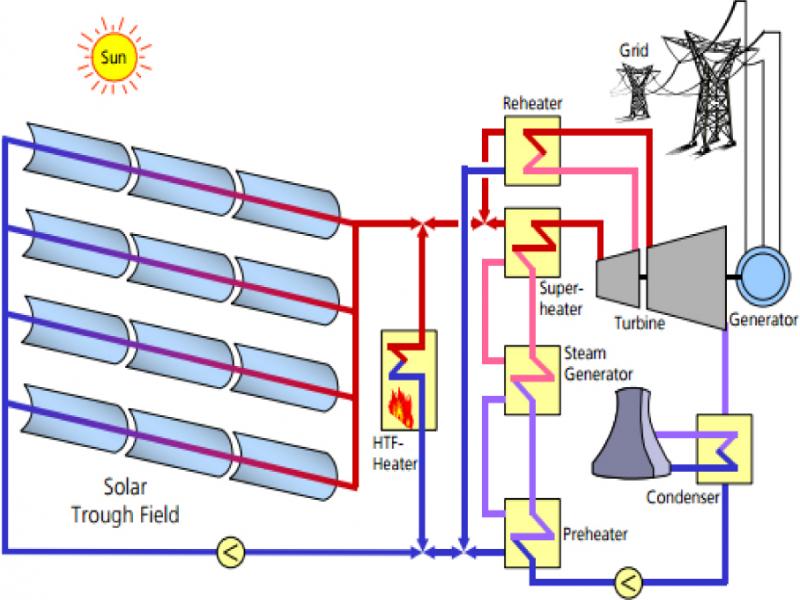
Figure 2.
Principle of parabolic trough solar power plant
(Source: “Solar Power – Photovoltaic or Solar Thermal Power Plants?”, October 2001)
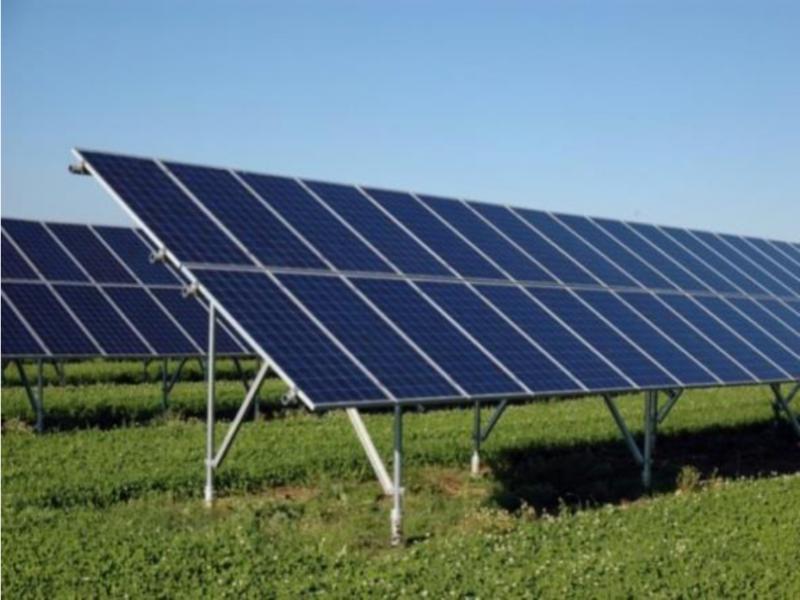
Figure 3.
Solar PV array
Source: (“Energy savings Engineering” http://www.energysavingsengineering.com, March, 2017)
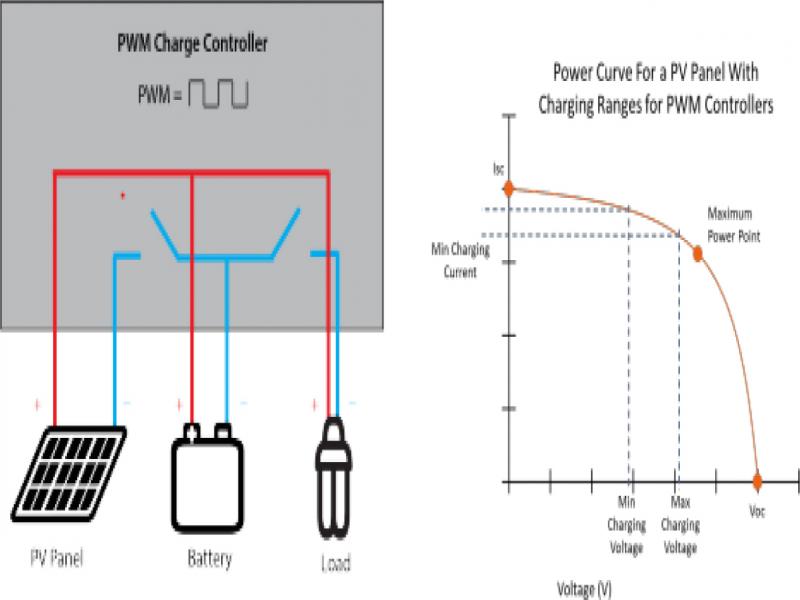
Figure 4.
PWM Charge Controller and PWM Power Curve
(Source: “Comparing PWM & MPPT Charge Controllers”, 2015)
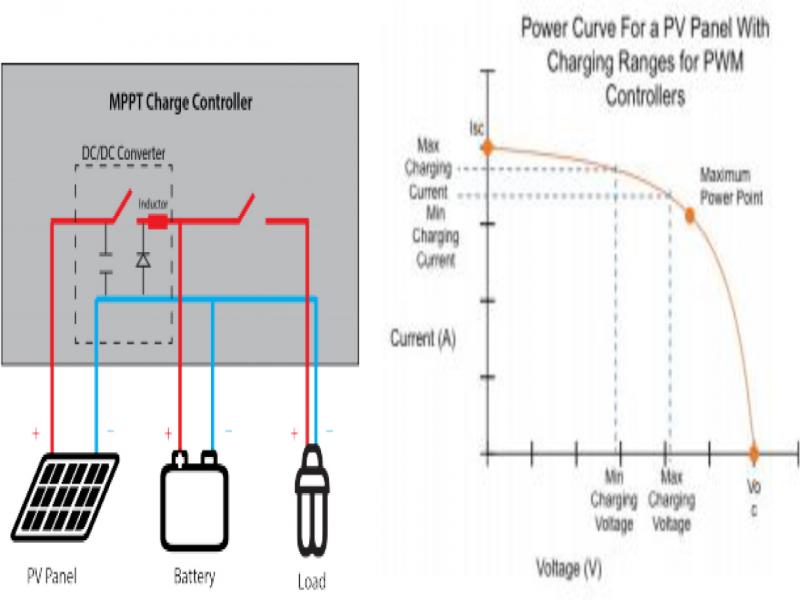
Figure 5.
MPPT Charge Controller and MPPT Power Curve
(Source: “Comparing PWM & MPPT Charge Controllers”, 2015)
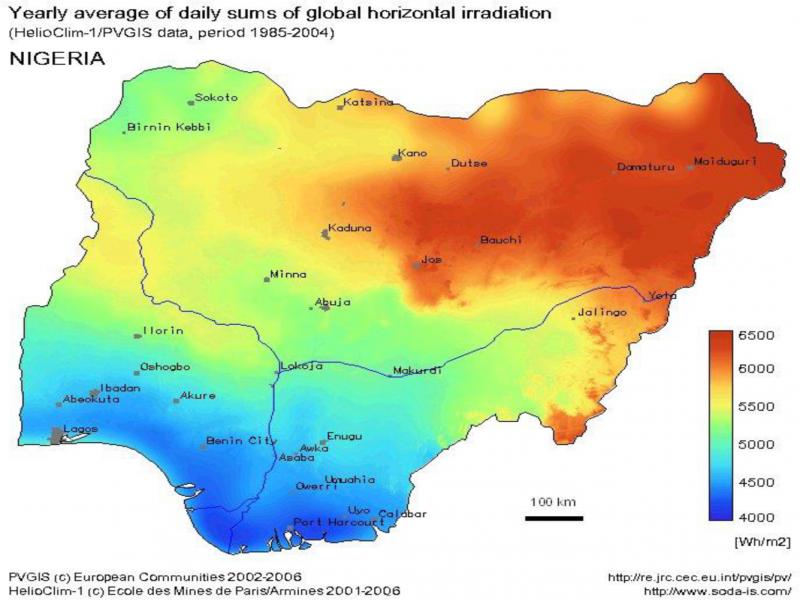
Figure 6.
Yearly Average of Daily Sums of Global Horizontal Irradiation of Nigeria
(Source: “Soda -solar radiation data, Available at http://www.soda-pro.com/maps”, February 2017).
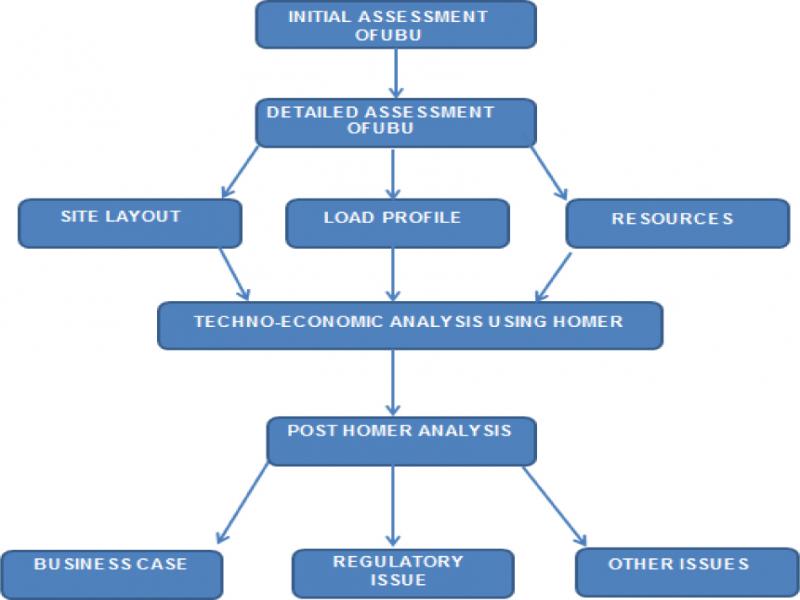
Figure 7.
Flow Diagram of the Study
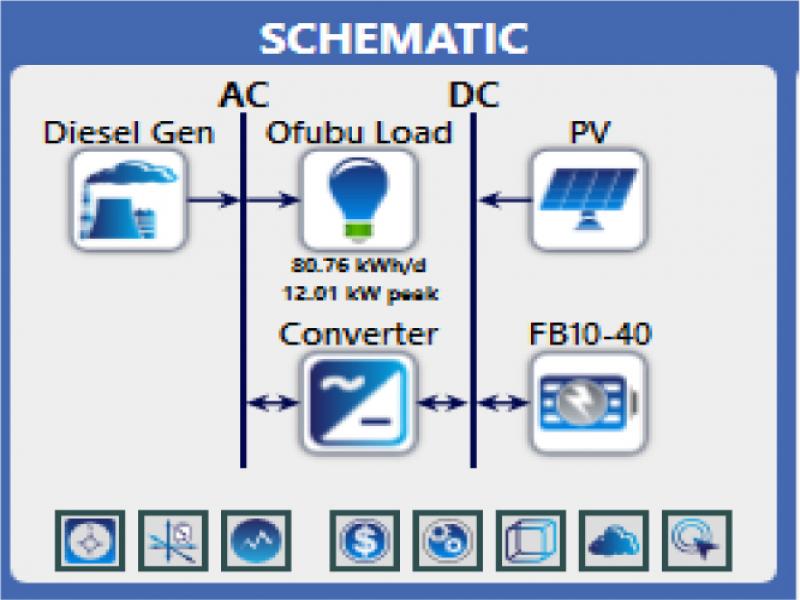
Figure 8.
Design of the Selected Renewable Energy Technology for the System
TABLE I.
DETAILS OF OFUBU VILLAGE
| PARTICULARS | DETAILS |
|---|---|
| Village Name | Ofubu (New Patani) |
| Nearby Town | Patani |
| Local Government Area | Sagbama |
| State | Bayelsa |
| Country | Nigeria |
| Latitude | 5ol3.7’N |
| Longitude | 6ol2.2’E |
| Area of Village (in hectares) | 300 |
| Forest land (in hectares) | >180 |
| River available | 1 |
| Water facility | 2 |
| Grid Electricity | 0 |
| Number of households | 30 |
| Total population | 109 |
| No. Males | 48 |
| No. Females | 61 |
| Educational facilities (Primary school) | 1 |
| Medical Facilities | 0 |
TABLE II.
ESTIMATED ELECTRICITY DEMAND FOR OFUBU VILLAGE
| S/N | Load | No. In Use | Power (Watts)/Unit | No. In Use x Power (Watt) | Hrs/Day | Watt-Hrs/Day |
|---|---|---|---|---|---|---|
| 1 | Low-energy Lights | 60 | 8 | 480 | 20 | 9600 |
| 2 | Security Light | 50 | 18 | 900 | 12 | 10800 |
| 3 | Street light | 4 | 100 | 400 | 12 | 4800 |
| 4 | Ceiling Fan | 20 | 30 | 600 | 10 | 6000 |
| 5 | Standing Fan | 5 | 15 | 75 | 10 | 750 |
| 6 | Refrigerator | 2 | 600 | 1200 | 15 | 18000 |
| 7 | Television | 4 | 100 | 400 | 18 | 7200 |
| 8 | Radio | 20 | 10 | 200 | 12 | 2400 |
| 9 | Water pump | 1 | 745.6 | 745.6 | 4 | 2982.4 |
| 10 | Local Palm Oil processing machine | 2 | 745.6 | 1491.2 | 8 | 11929.6 |
| 11 | Cassava Grinding Machine | 1 | 745.6 | 745.6 | 8 | 5964.8 |
| 12 | Others(Phone & Small devices) | 200 | 20 | 4000 | ||
| TOTAL | 84426.8 | |||||
| Average | 80760.13 |
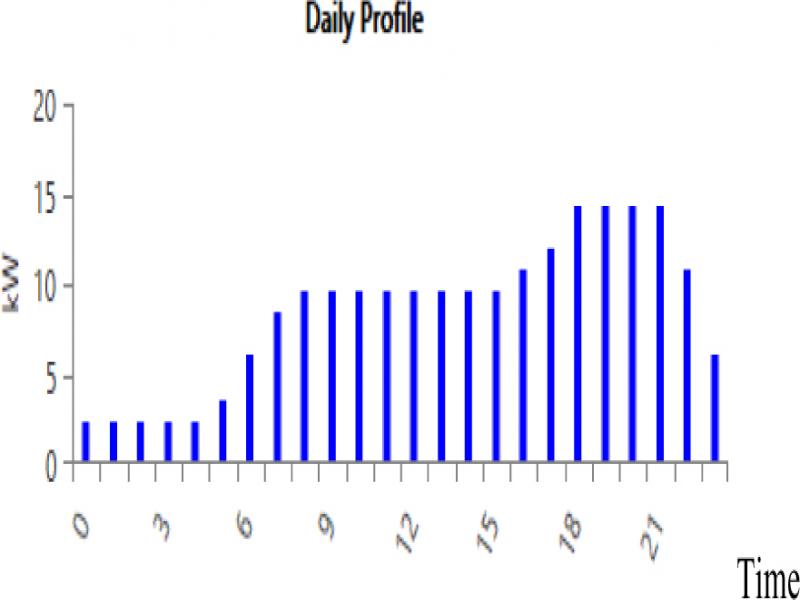
Figure 9.
Daily Load Profile of Ofubu village
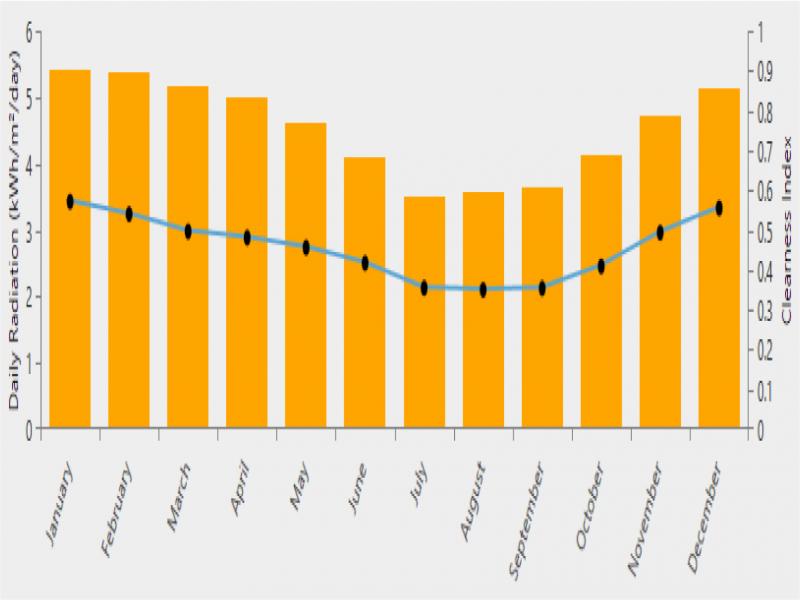
Figure 10.
Solar energy profile at Ofubu village
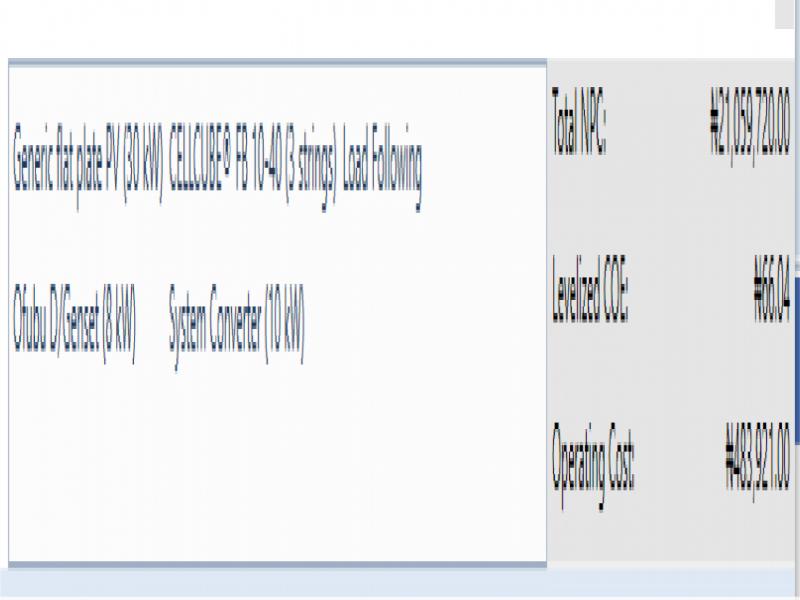
Figure 11.
System architecture and cost summary
TABLE III.
OPTIMAL LEAST COST HYBRID SYSTEM FOR THE CASE STUDY
| Production | kWh/r | % |
|---|---|---|
| Generic flat plate PV | 39,926 | 91.40 |
| Ofubu D/Genset | 3,755 | 3.60 |
| Total | 43,631 | 10O.OO |
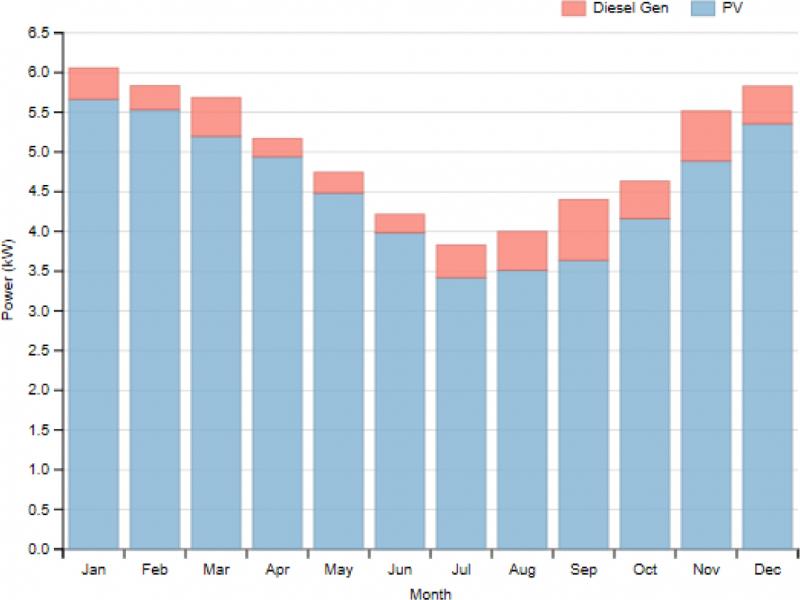
Figure 12.
Monthly Distribution of the Electricity Produced in kW
TABLE IV.
OPTIMIZED TOTAL SYSTEM COST
| Component | Capital 
| Replacement
| O&M
| Fuel
| Salvage
| Total
| |
|---|---|---|---|---|---|---|---|
| CELLCUBE® FB 10-40 |
1,500,000.00 |
298,183.00 |
16,228.00 |
0.00 | (153,314.00) |
1,661,097.00 | |
| Converter |
200,000.00 |
48,329.00 |
1,084.00 |
0.00 | (7,571.00) |
241,842.00 | |
| Generic flat plate PV |
11,400,000,00 |
0,00 |
16,228.00 |
0,00 |
0,00 |
11,416,228.00 | |
| ⊳ | Ofubu D/Genset |
224,000.00 |
0.00 |
835,360.00 |
2,252,543.00 | (18,808.00) |
3,293,095.00 |
| Other |
2,500,000.00 |
0.00 |
1,947,487.00 |
0.00 |
0.00 |
4,447,437.00 | |
| System |
15,324,000,00 |
346,512,00 |
2,816,337.00 |
2,252,543,00 | (179,693,00) |
21,059,749.00 | |
TABLE V.
SPV OPTIMIZED RESULT
| Quantity | Value | Units |
|---|---|---|
| Rated Capacity | 30.00 | kW |
| Mean Output | 4.56 | kW |
| Mean Output | 109.39 | kWh/d |
| Capacity Factor | 15.19 | % |
| Total Production | 39,926.00 | kWh/yr |
| Minimum Output | 0.00 | kW |
| Maximum Output | 29.2 | kW |
| PV Penetraition | 135 | % |
| Hours of Operation | 4,418 | hrs/yr |
| Levelized Cost | 26.4 |
kWh |
TABLE VI.
DG OPTIMIZED RESULTS
| Quantity | Value | Units |
|---|---|---|
| Hours of Operation | 1,374 | hrs/yr |
| Number of Starts | 316 | starts/yr |
| Operational Life | 63.8 | yr |
| Capacity Factor | 5.36 | % |
| Fixed Generation Cost | 84.4 |
/hr |
| Marginal Generation Cost | 41.0 |
/kWh |
| Fuel Consumption | 1,338.00 | L |
| Specific Fuel Consumption | 0.37 | L/kWh |
| Fuel Energy Input | 13,558.00 | kWh/yr |
| Mean Electrical Efficiency | 27.50 | % |
| Electrical Production | 3,755.40 | kWh/yr |
| Mean Electrical Output | 2.73 | kW |
| Minimum Electrical Output | 2.00 | kW |
| Maximum Electrical Output | 8.00 | Kw |
TABLE VII.
BEST HYBRIDS AND SPV ONLY – PARAMETERS
| Configuration | Unit | Best Hybrid | SPV only |
|---|---|---|---|
| Diesel price | N/L | 150 | 0 |
| Solar PV | kW | 30 | 40 |
| Batteries-CELLCUBE® FB 10-4 | (Strings) | 3 | 10 |
| Converter | kW | 10 | 10 |
| Total Capital Cost | N | 11,400,000 | 22,900,000 |
| Total NPC | N | 21,059,724 | 25,447,960 |
| Total Annual Capital Cost | N/yr | 1,462,561 | 2,116,573 |
| Total Annual Replacement Cost | N/yr | 32,027 | 96,334 |
| Total O&M Cost | N/yr | 260,310 | 187,100 |
| Total Fuel Cost | N/yr | 208,195 | 0 |
| Total Annual Cost | N/yr | 1,946,484 | 2,352,073 |
| Operating Cost | N/yr | 483,921 | 235,500 |
| COE | N/kWh | 66.044 | 79.823 |
| PV Production | kWh/yr | 39,926 (91%) | 53,234 (100%) |
| Diesel Generator | kWh/yr | 3,755 (9%) | 0 |
| Total Electrical Production | kWh/yr | 43,681 | 53,234 |
| AC Primary Load | kWh/yr | 29,472 | 29,466 |
| Unmet Load | kWh/yr | 5 | 11 |
| Excess Electricity | kWh/yr | 3,515 | 11,258 |
| Capacity Shortage | kWh/yr | 14 | 29 |
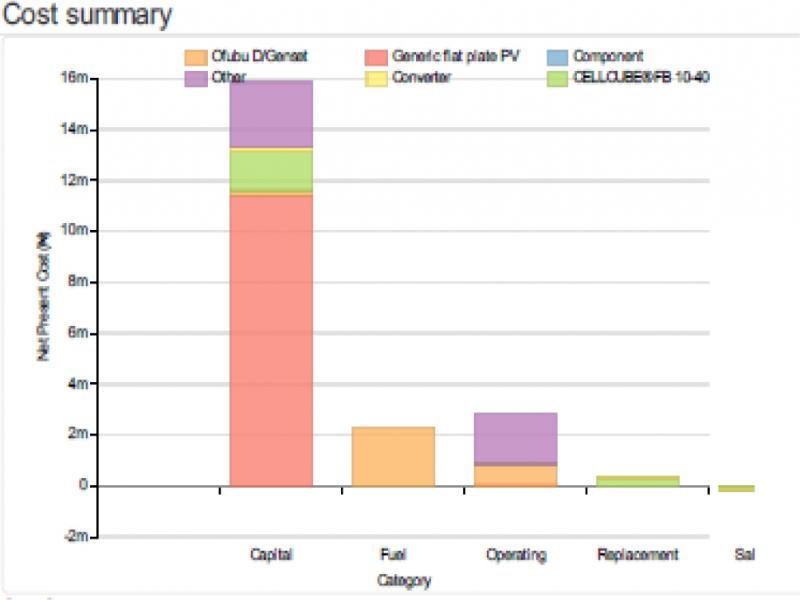
Figure 13.
Cash flow summary based on the selected components