
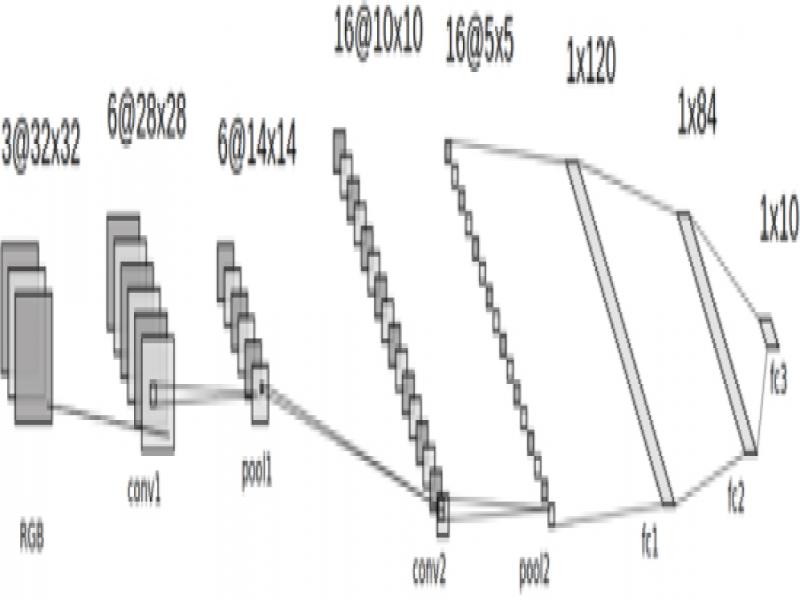
Figure 1.
Network structure
TABLE I.
OPTIMIZER PARAMETER SETTING
| Optimizer | parameter |
|---|---|
| SGD | lr=0.001, |
| Adam | lr=0.001, |
| Adamax | lr=0.002, |
| RMSprop | lr=0.001, |
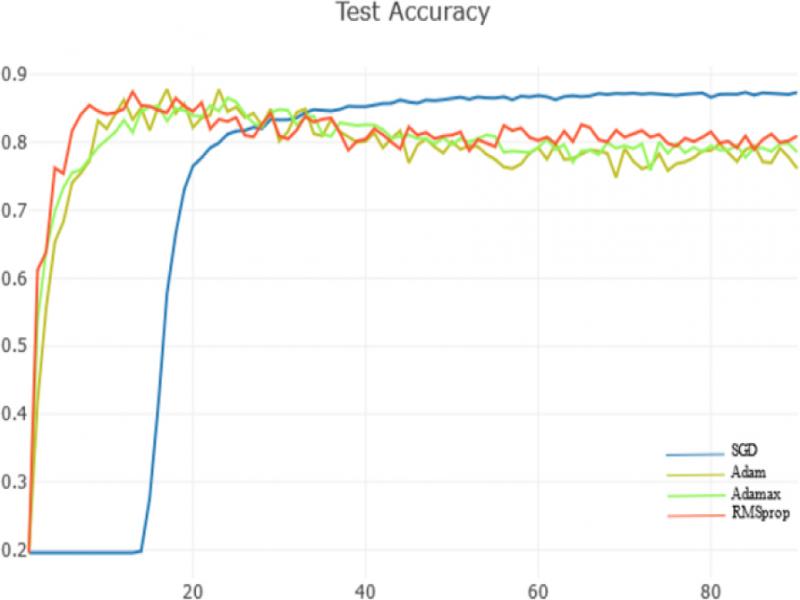
Figure 2.
Optimizer effect
TABLE II.
OPTIMIZERS TRAINING RESULTS
| optimizer | Top Accuracy/% |
|---|---|
| SGD | 87.350184 |
| Adam | 89.090000 |
| Adamax | 88.955900 |
| RMSprop | 88.676000 |
TABLE III.
RESULT OF DIFFERENT WEIGHT DECAY
| weight_decay | Train Acc%(e) | Test Acc%(e) |
|---|---|---|
| 0.01 | 89.01538(85) | 87.14659(85) |
| 0.005 | 91.59397(57) | 88.95590(57) |
| 0.0025 | 94.51470(88) | 90.01229(88) |
| 0.001 | 97.21119(90) | 89.70498(24) |
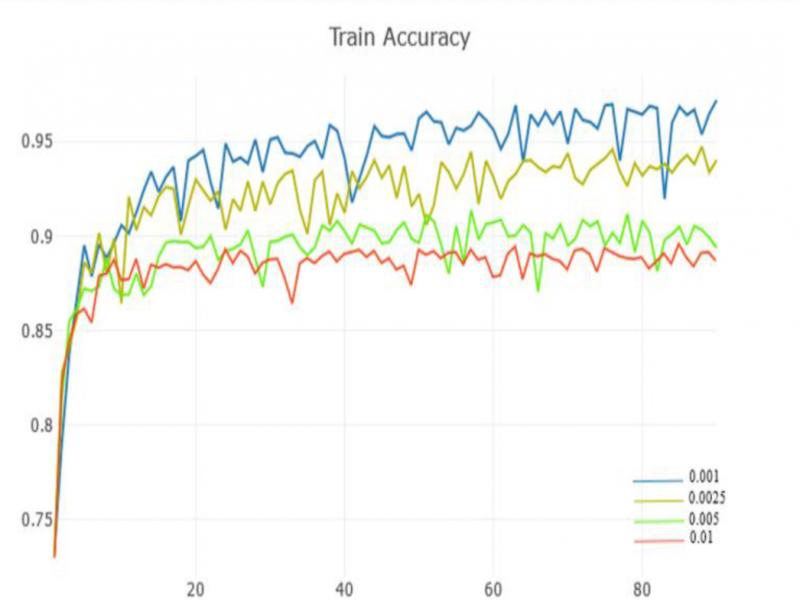
Figure 3.
Training Accuracy of different regularization
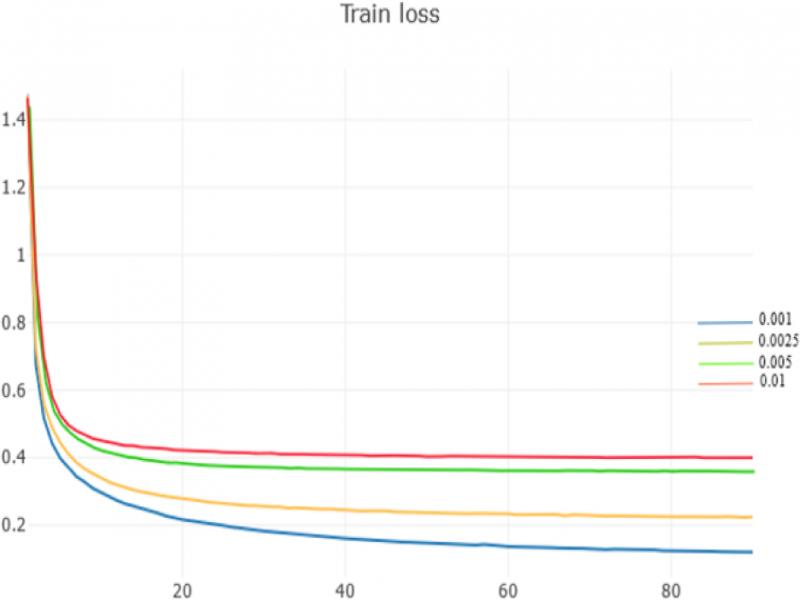
Figure 4.
Training Loss of different regularization
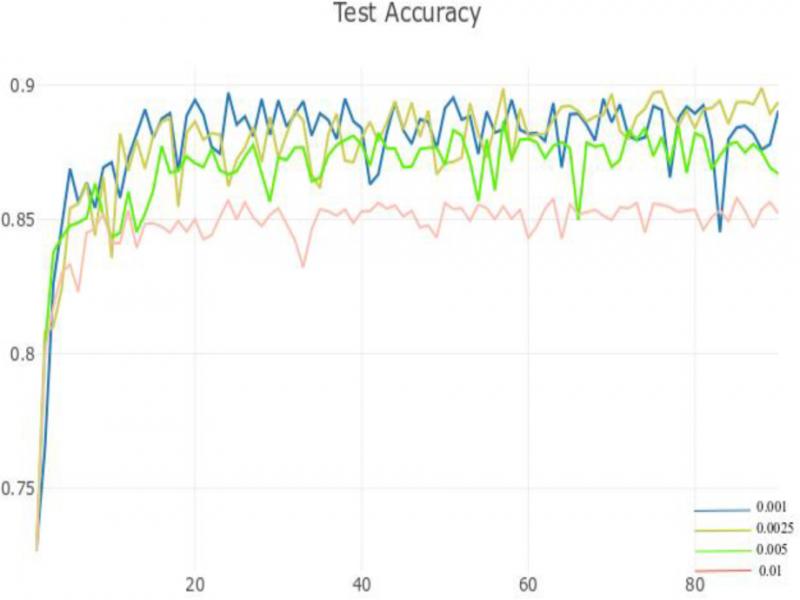
Figure 5.
Test Accuracy of different regularization
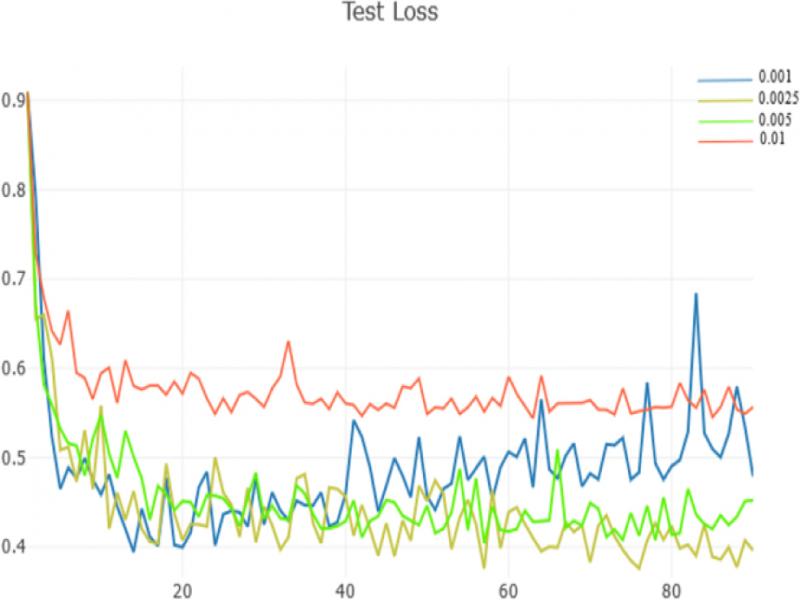
Figure 6.
Tetst Loss of different regularization
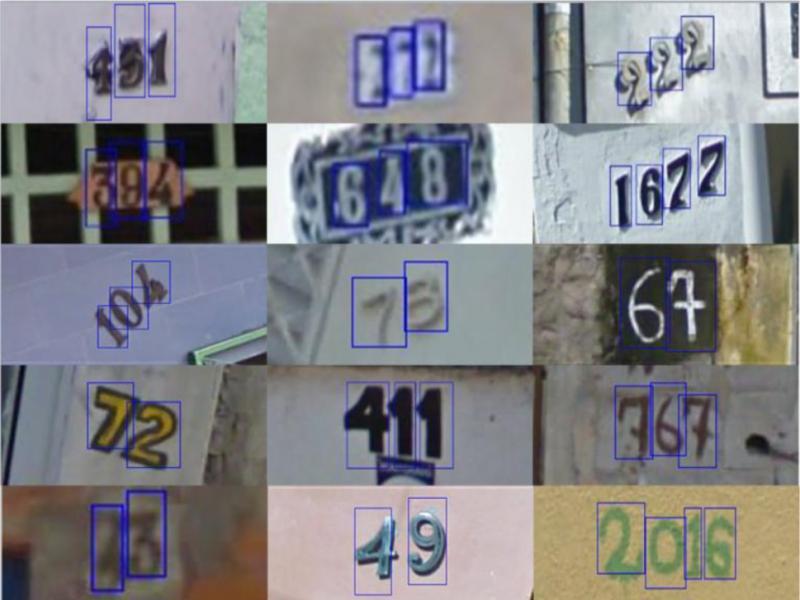
Figure 7.
SVHN-Complete house number
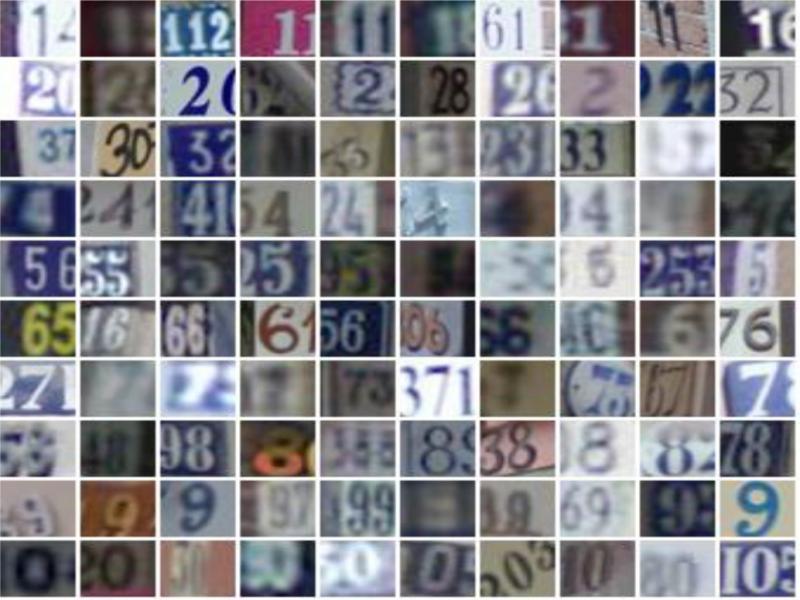
Figure 8.
SVHN-Part number
TABLE IV.
AUGMENTATION RESULT
| Subset category | Number of samples |
|---|---|
| Training set | 73257 |
| Extra set | 531131 |
| Test set | 26032 |
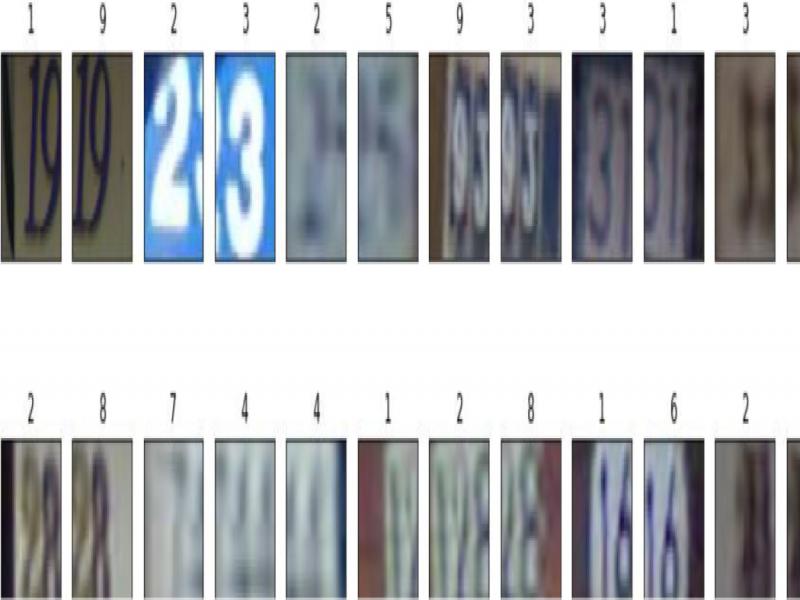
Figure 9.
Example of train set
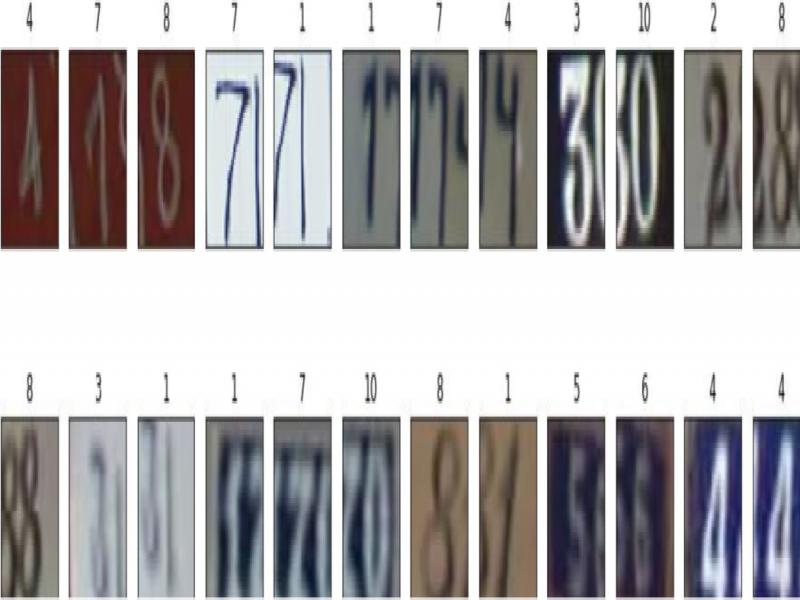
Figure 10.
Example of extra set
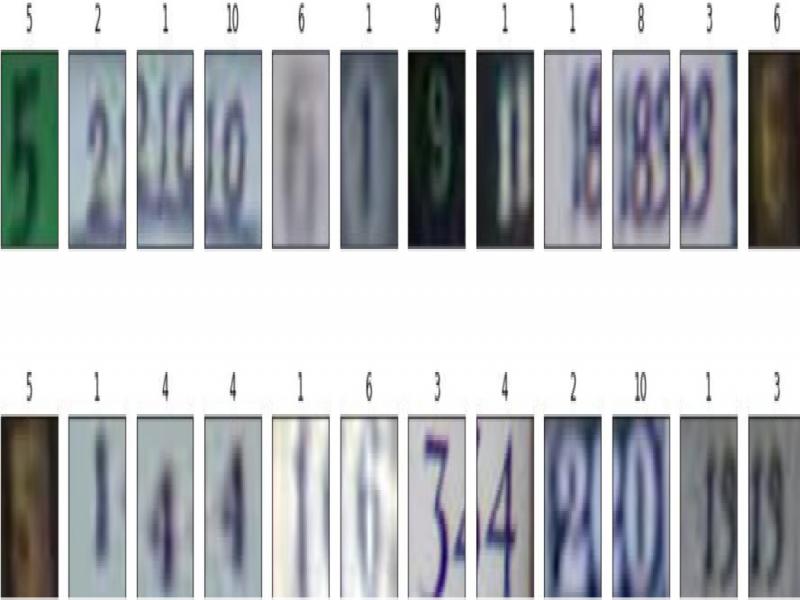
Figure 11.
Example of test set
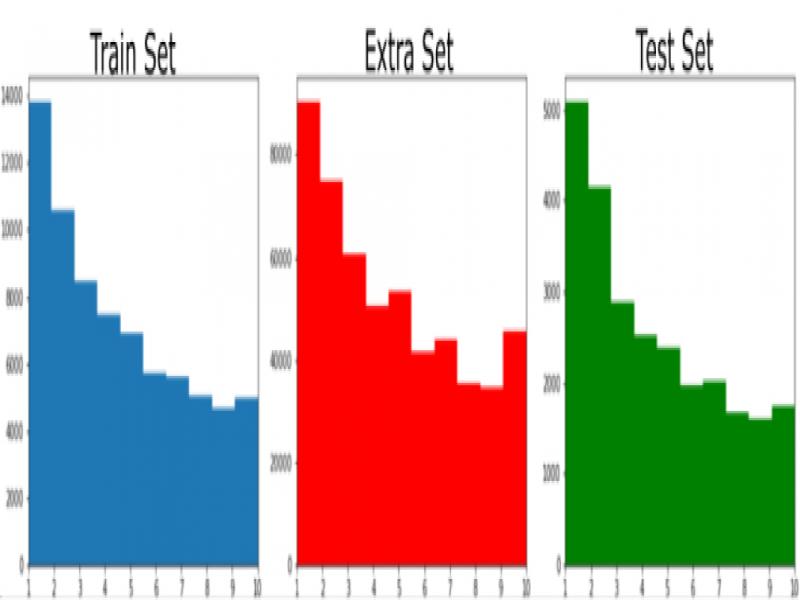
Figure 12.
Category distribution of SVHN
TABLE V.
RESULT AFTER DATA AUGMENTATION
| Train sample number | test sample number | Best test accuracy | time |
|---|---|---|---|
| 73257 | 26032 | 90.01229 | 1h24min |
| 604388 | 26032 | 92.32483 | 6h17min |
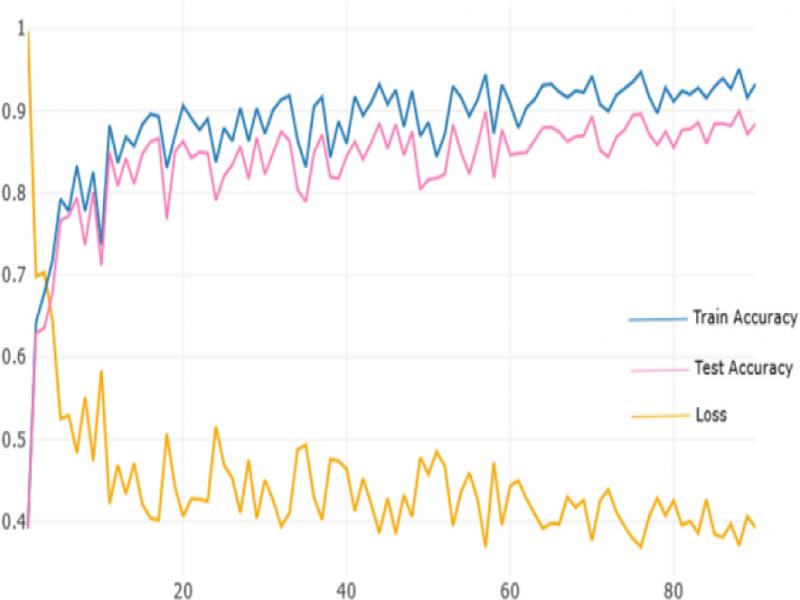
Figure 13.
Training of the model after adding data augmentation
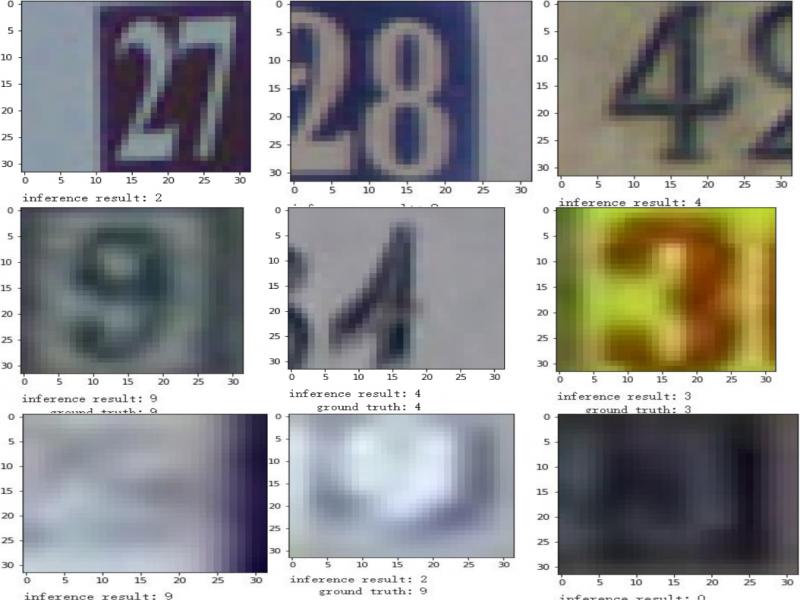
Figure 14.
Figure 1 Test result