
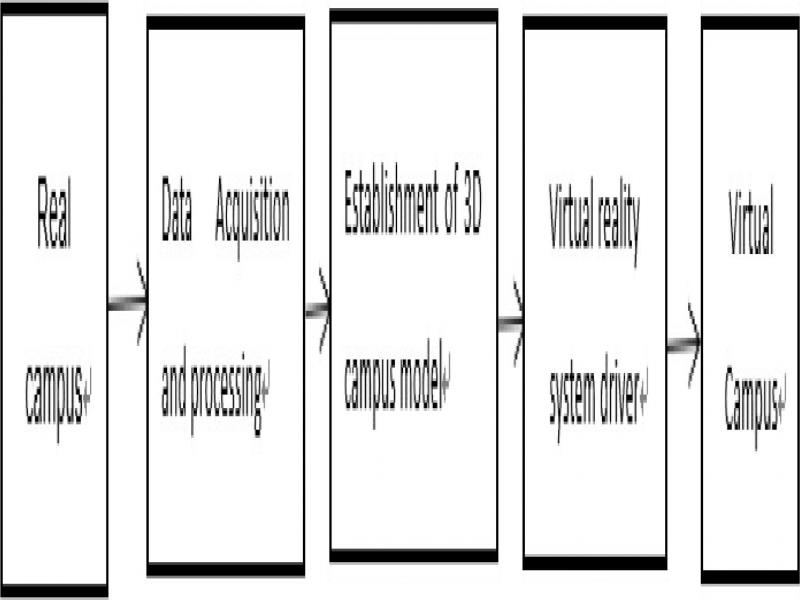
Figure 1.
System development process
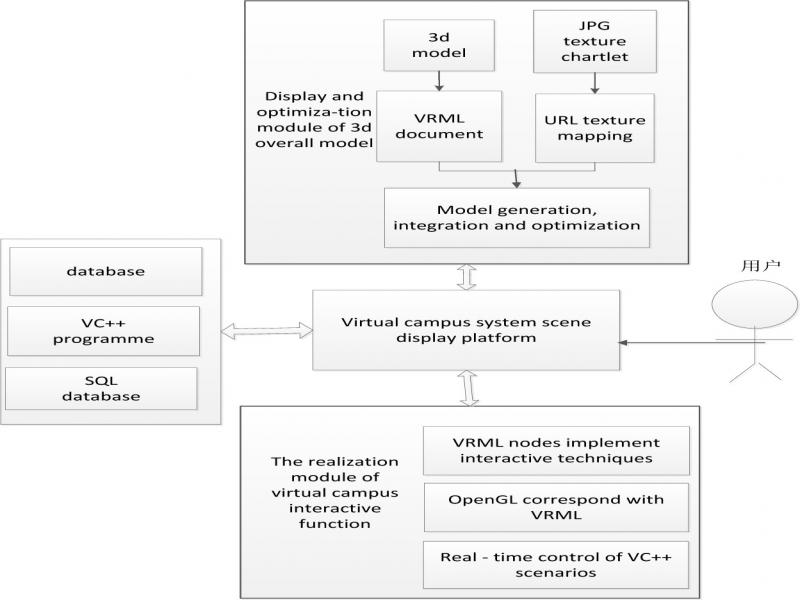
Figure 2.
Basic function modules of the system
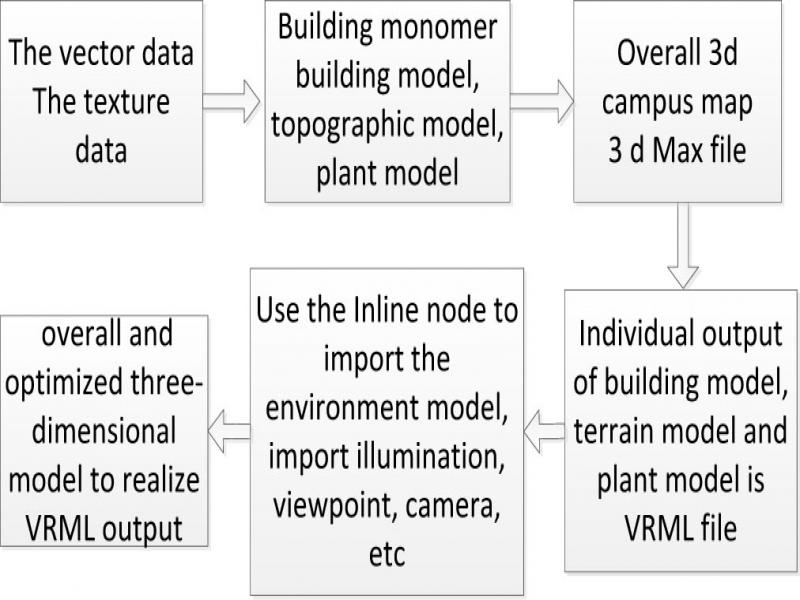
Figure 3.
Data processing flow
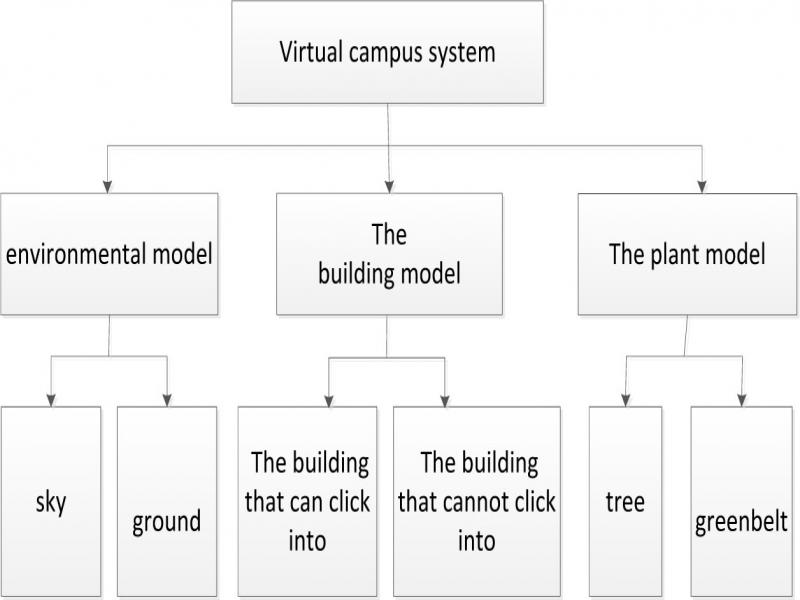
Figure 4.
System 3D model
Table I.
COMPARISON OF TEST RESULTS BEFORE AND AFTER OPTIMIZATION
| Optimization Algorithm | ||||
|---|---|---|---|---|
| DEF.USE | Set the domain value of visibility Limit | use LOD | Initial loading speed (second) | Degree of fluency |
| False | false | false | 11.2 | unfluency |
| True | false | false | 10.1 | less fluency |
| False | true | false | 8.9 | commonly |
| False | false | true | 7.6 | commonly |
| True | true | true | 6.5 | more fluency |
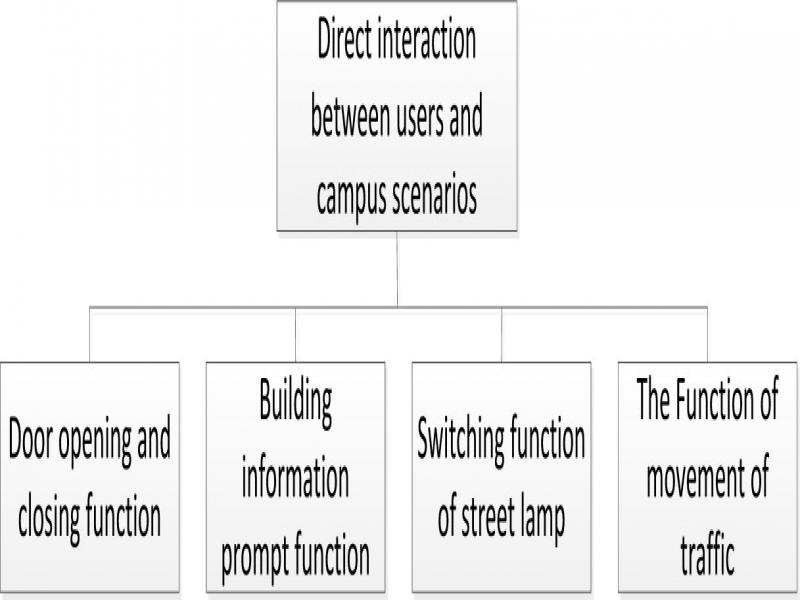
Figure 5.
Direct interaction function diagram