
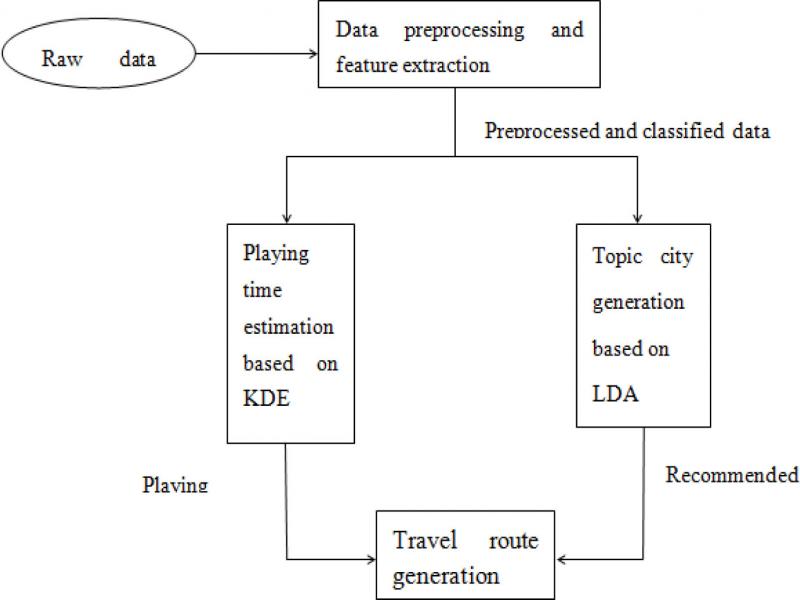
Figure 1.
LDA travel route recommendation algorithm based on KDE and classification
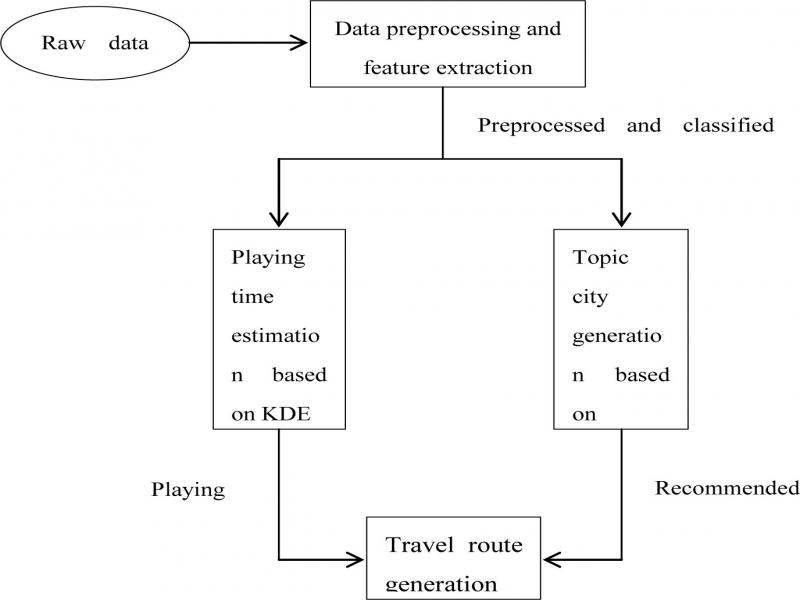
Figure 2.
Collaborative filtering travel route recommendation algorithm based on KDE and Classification
Table I.
ROUTE BASIC ATTRIBUTE TABLE
| id | name | plan_id | type | hours | daysep | |
|---|---|---|---|---|---|---|
| meaning | City id | City name | Route id | Route type | Playing time | The flag of end of day |
| Value type | string | string | string | string | list | bool |
| example | ‘263’ | ‘Osaka’ | ‘3799’ | ‘place’ | [4.0,8.0] | true |
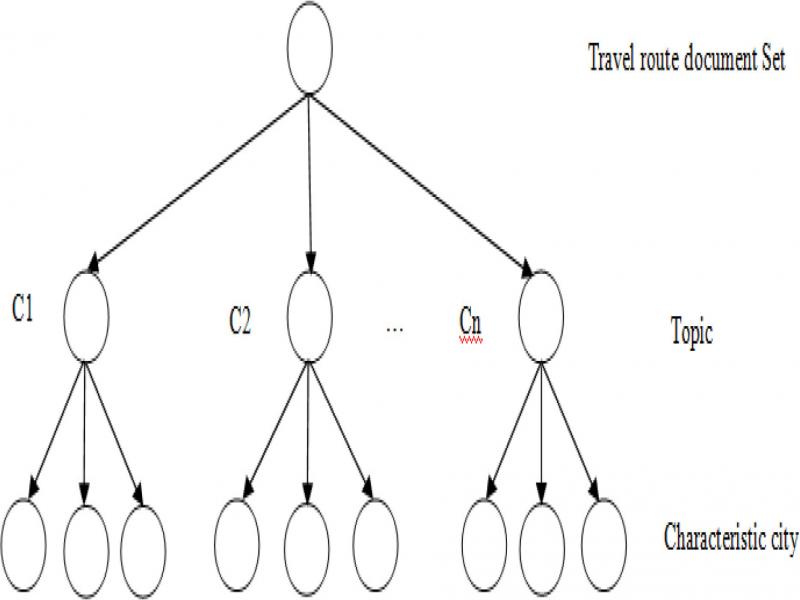
Figure 3.
Travel city topic model based on LDA
Table II.
INPUT AND OUTPUT OF TRAVEL CITY TOPIC MODEL BASED ON LDA
| input: preprocessed and classified travel route text set (one route for one line) The number of topic K, hyperparameters α and β |
|---|
| output: 1. Topic number assigned to each word of each text 2. Topic probability distribution θ for each text 3. Characteristic city probability distribution for each topic 4. Word id mapping table in the program 5. Top-N feature city words sorted from top to bottom for each topic |
Table III.
THE EXPERIMENTAL RESULTS OF DIFFERENT VALUES OF HYPERPARAMETER A
| α | 5 | 10 | 15 | 20 | 25 | 30 | 35 | 40 | 45 | 50 |
| log | 4.72 | 4.16 | 4.02 | 3.38 | 3.21 | 3.16 | 3.82 | 4.12 | 4.68 | 5.16 |
| p(e) | 0.282 | 0.254 | 0.236 | 0.192 | 0.166 | 0.171 | 0.179 | 0.216 | 0.249 | 0.288 |
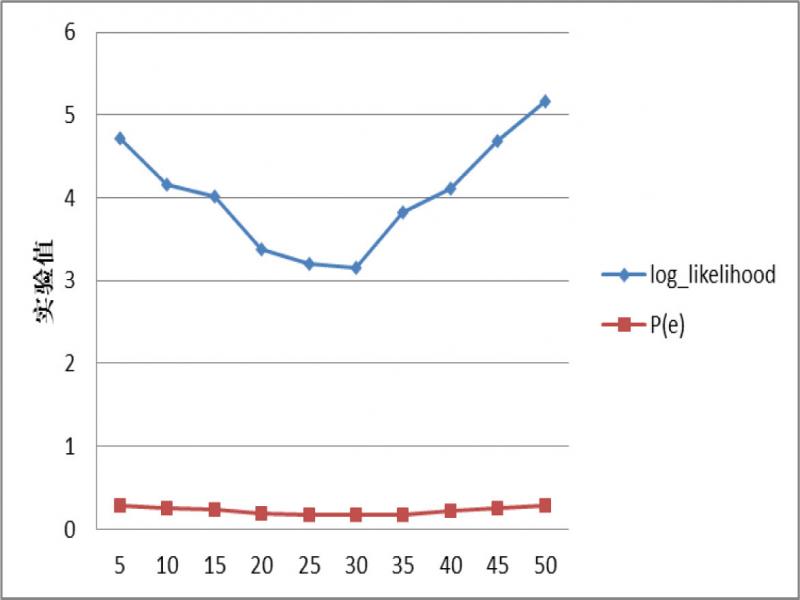
Figure 4.
The experimental results of different values of hyperparameter α
Table IV.
THE EXPERIMENTAL RESULTS OF DIFFERENT VALUES OF HYPERPARAMETER B
| β | 0.01 | 0.05 | 0.10 | 0.15 | 0.20 | 0.25 | 0.30 | 0.35 | 0.40 | 0.50 |
| log | 5.62 | 4.42 | 4.02 | 3.32 | 4.23 | 5.10 | 5.82 | 5.92 | 6.58 | 7.21 |
| p(e) | 0.282 | 0.254 | 0.236 | 0.172 | 0.198 | 0.216 | 0.232 | 0.299 | 0.328 | 0.356 |
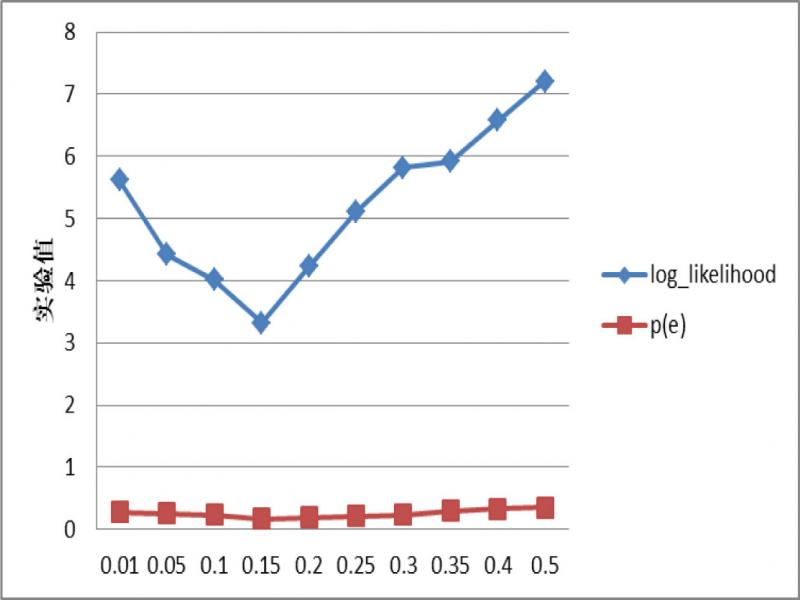
Figure 5.
The experimental results of different values of hyperparameter β
Table V.
THE EXPERIMENTAL RESULTS OF DIFFERENT NUMBER OF TOPIC K
| k | 4 | 6 | 8 | 10 | 12 | 14 | 16 | 18 | 20 | 22 |
| log | 5.62 | 4.42 | 4.02 | 3.32 | 3.26 | 5.10 | 5.82 | 5.92 | 6.58 | 7.21 |
| p(e) | 0.223 | 0.214 | 0.205 | 0.196 | 0.182 | 0.226 | 0.265 | 0.314 | 0.408 | 0.516 |
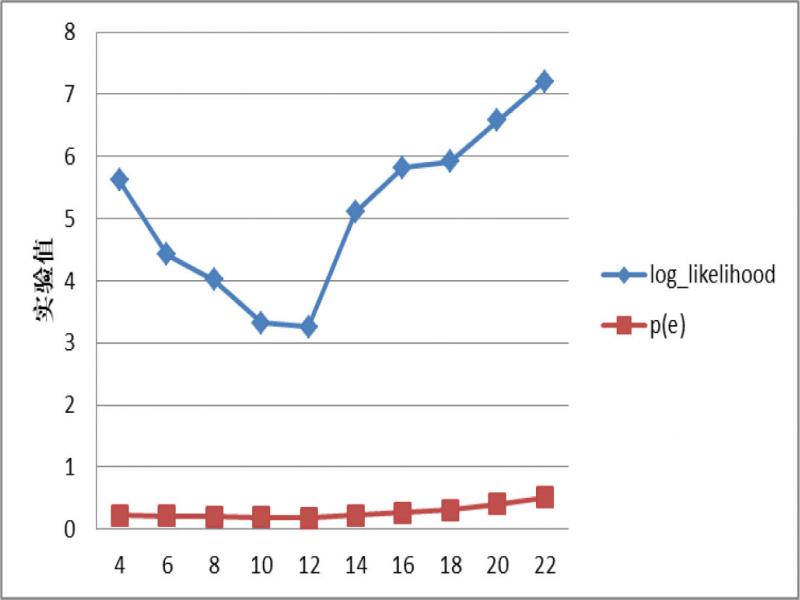
Figure 6.
The experimental results of different number of topic K
Table VI.
THE EXPERIMENTAL RESULTS OF DIFFERENT NUMBER OF ITERATIONS N
| n | 300 | 400 | 500 | 600 | 700 | 800 | 900 | 1000 | 1100 | 1200 |
| log | 6.15 | 5.86 | 4.02 | 3.98 | 3.82 | 3.64 | 3.12 | 3.31 | 3.41 | 3.53 |
| p(e) | 0.332 | 0.308 | 0.275 | 0.262 | 0.236 | 0.214 | 0.161 | 0.172 | 0.181 | 0.194 |
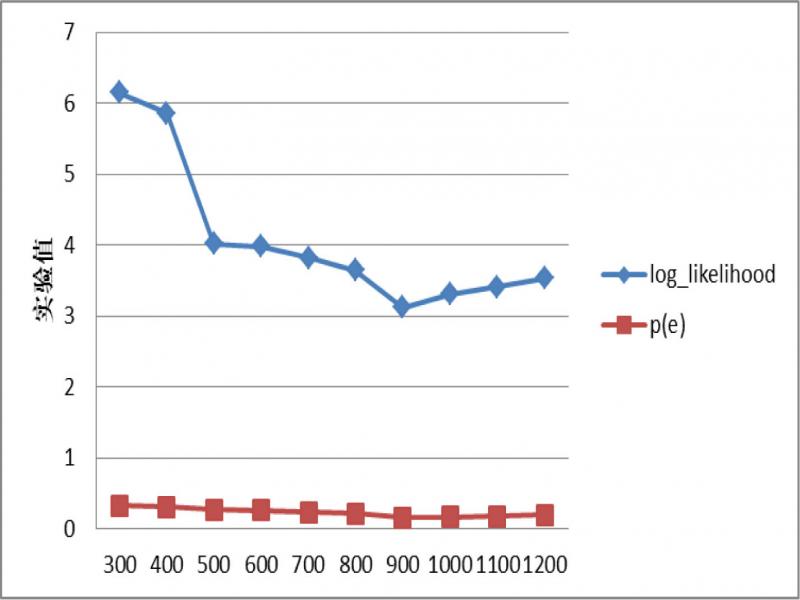
Figure 7.
The experimental results of different number of iterations n
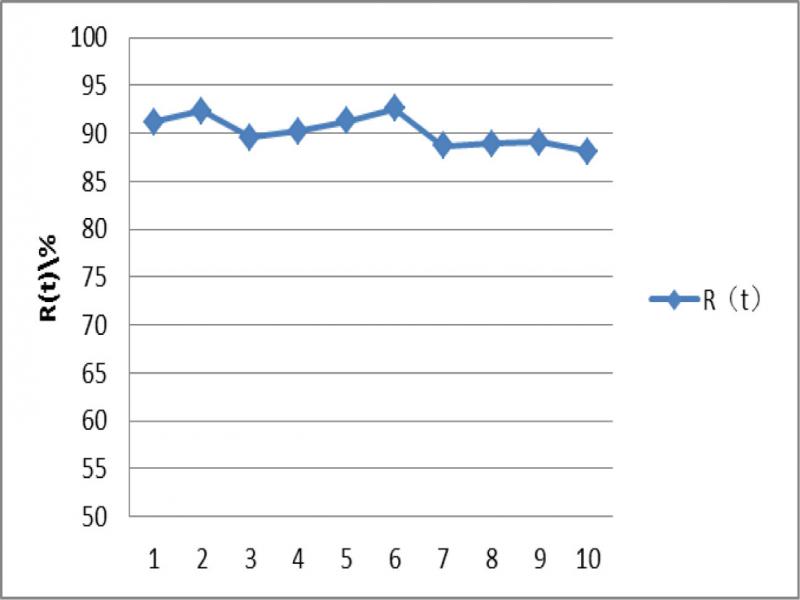
Figure 8.
The route correlation rate of LDA travel route recommendation algorithm based on KDE and classification
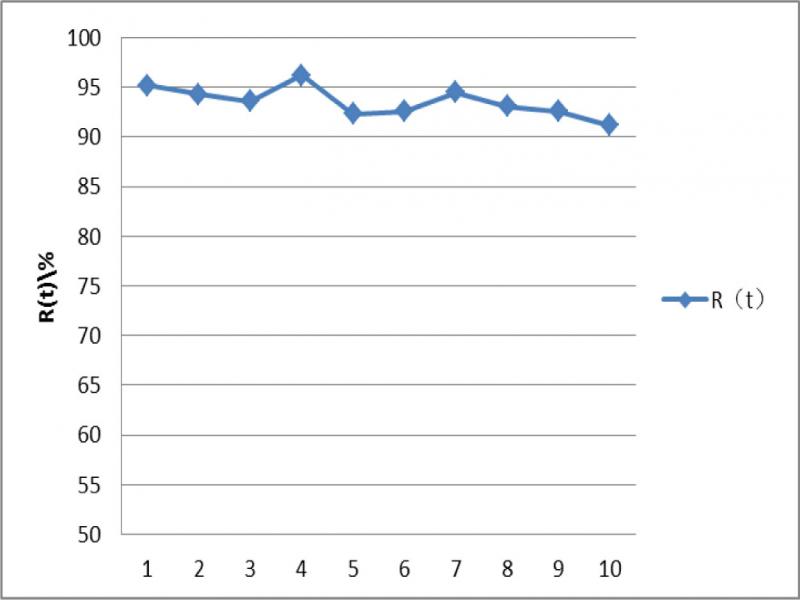
Figure 9.
The route correlation rate of collaborative filtering travel route recommendation algorithm based on KDE and classification
Table VII.
THE OUTPUT RESULTS OF DIFFERENT ALGORITHM
| The input of algorithm | total days of travel | 7 |
| cities that user wants to go | Osaka, Nagoya | |
| The output of algorithm | No improved LDA recommended algorithm | [Naoshima: 2.5, Yamanashi: 1.8, Osaka: 56.4, Nagoya: 29.8] |
| No improved collaborative filtering recommendation algorithm | [Yakushima: 12.5, Naoshima: 8.6, Osaka: 42.8, Nagoya: 26.2] | |
| LDA travel route recommendation algorithm based on KDE and classification | [Kyoto: 42.4, Nakafurano-cho: 3.9, Osaka: 15.5, Nagoya: 16.5] | |
| collaborative filtering travel route recommendation algorithm based on KDE and classification | [Kyoto: 24.2, Tokyo: 20.3, Osaka: 15.5, Nagoya: 16.5] |