
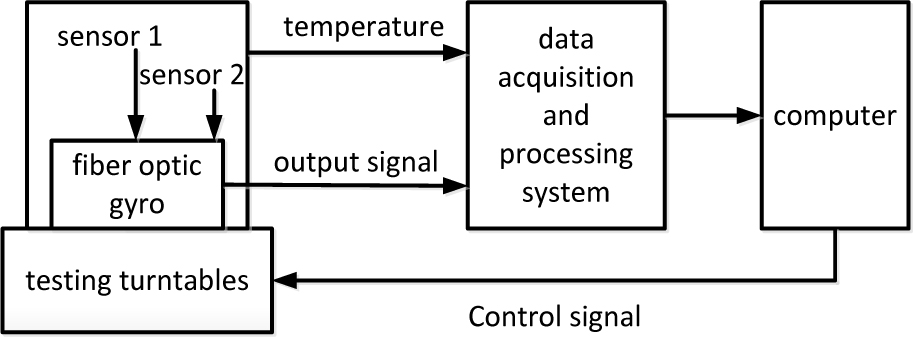
Figure 1.
Equipment connection about temperature test
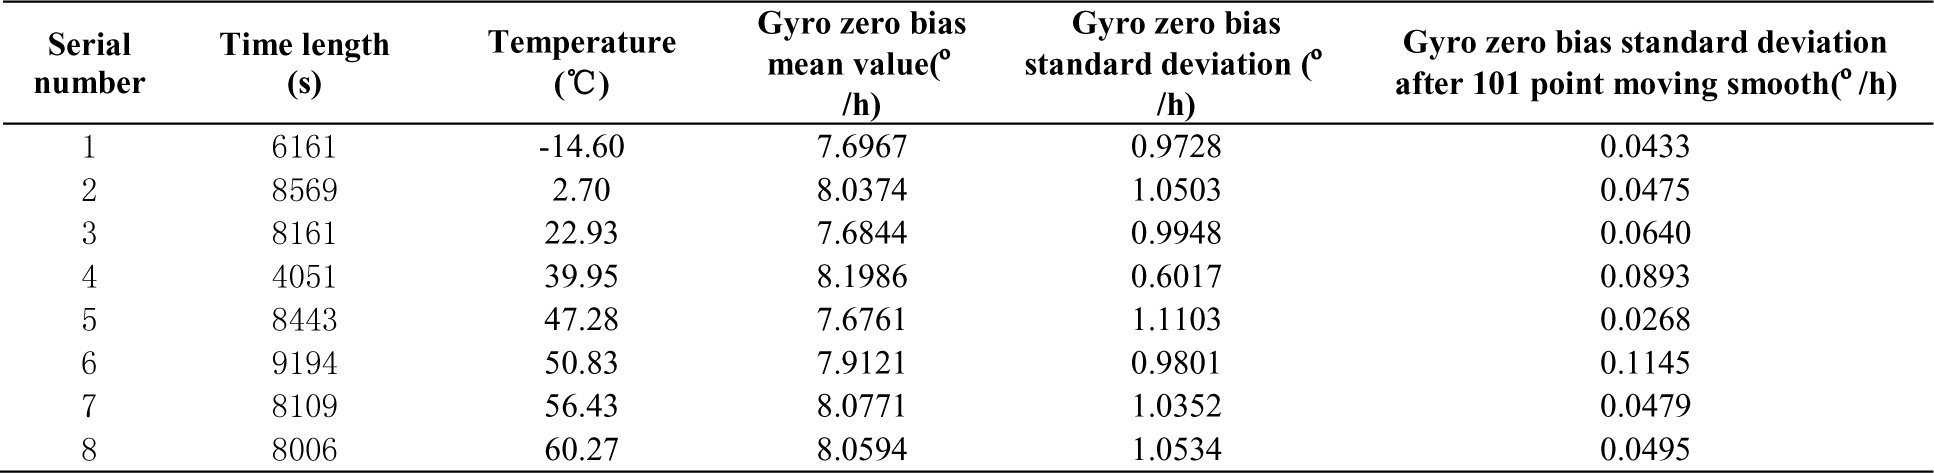
Table 1.
RESULTS ABOUT GYRO ZERO BIAS ABOUT DIFFERENT TEMPERATURE
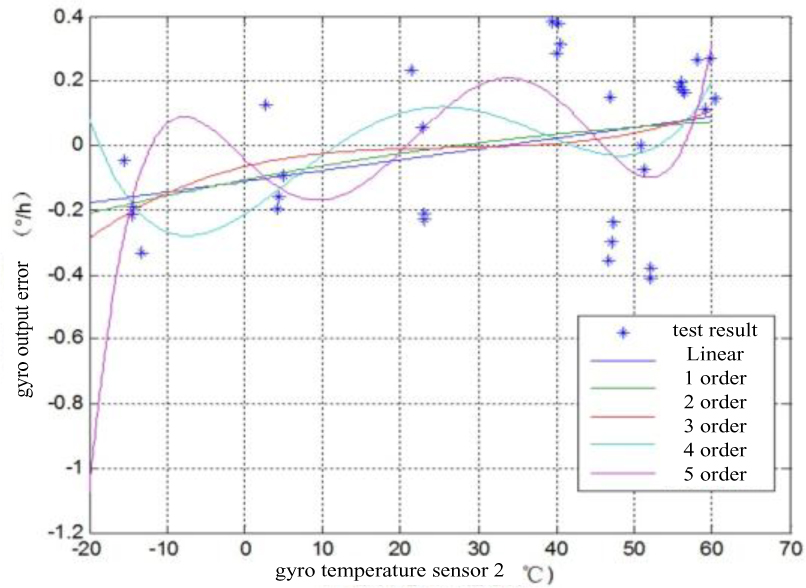
Figure 2.
Polynomial fitting curve about the gyro zero bias caused by temperature
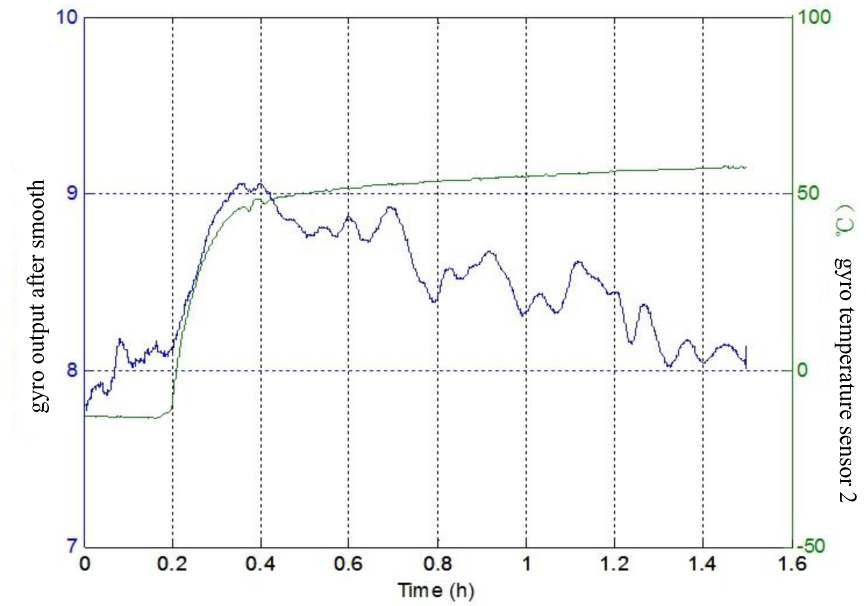
Figure 3.
The influence about temperature to gyro zero bias
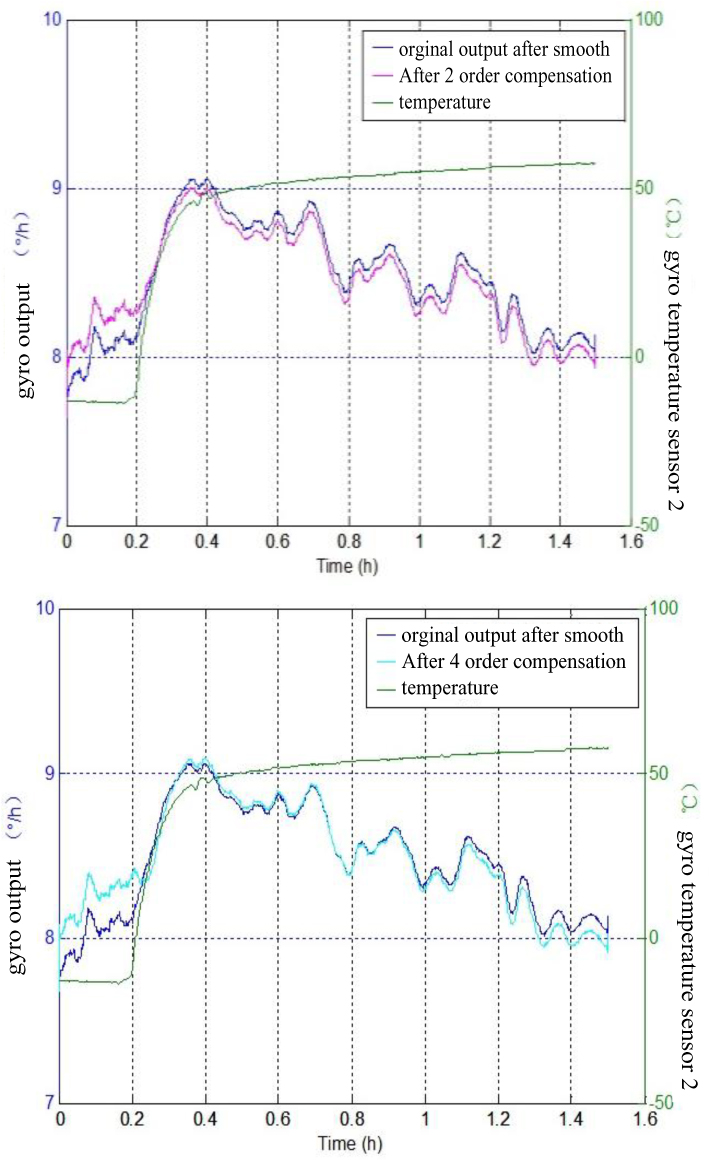
Figure 4.
Gyro output by 2\4 order polynomial compensation while temperature transition
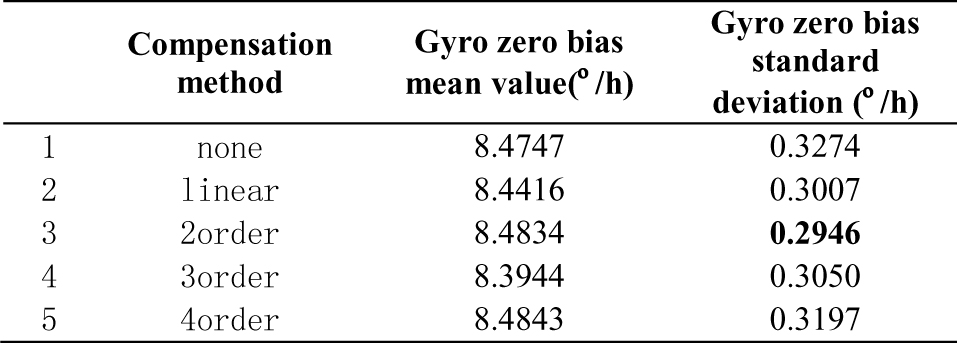
TABLE II.
GYRO OUTPUT BY 1 TO 4 ORDER POLYNOMIAL COMPENSATION WHILE TEMPERATURE TRANSITION
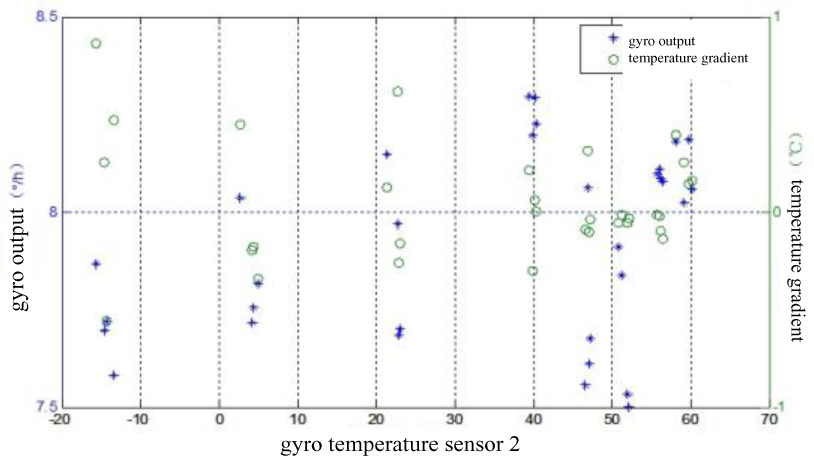
Figure 5.
Relationship between temperature gradient and gyro zero bias
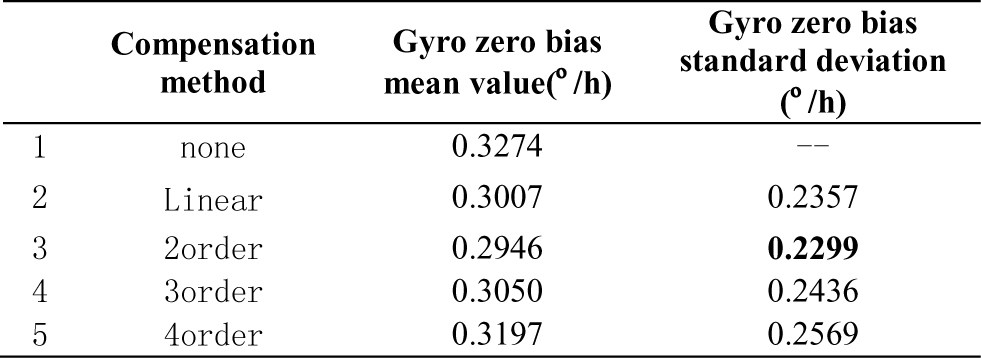
TABLE III.
THE RESULT AFTER ADDING COMPENSATION BY TEMPERATURE GRADIENT
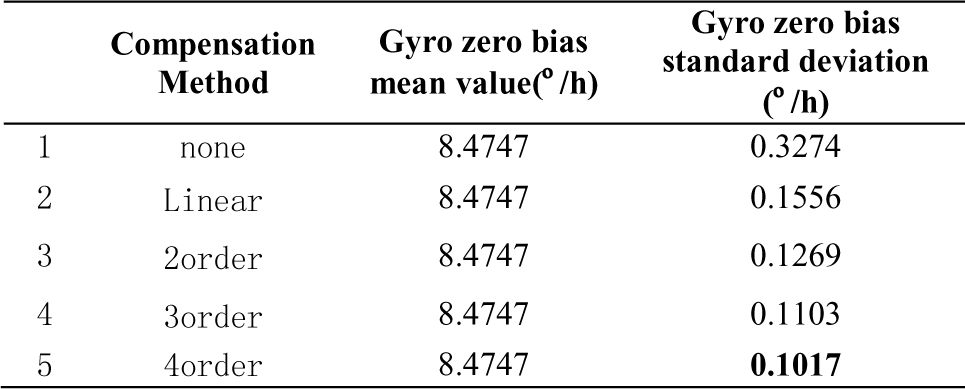
TABLE IV.
COMPENSATION RESULT AFTER TEMPERATURE TRANSITION\TEMPERATURE GRADIENT\TEMPERATURE TRANSITION RATE
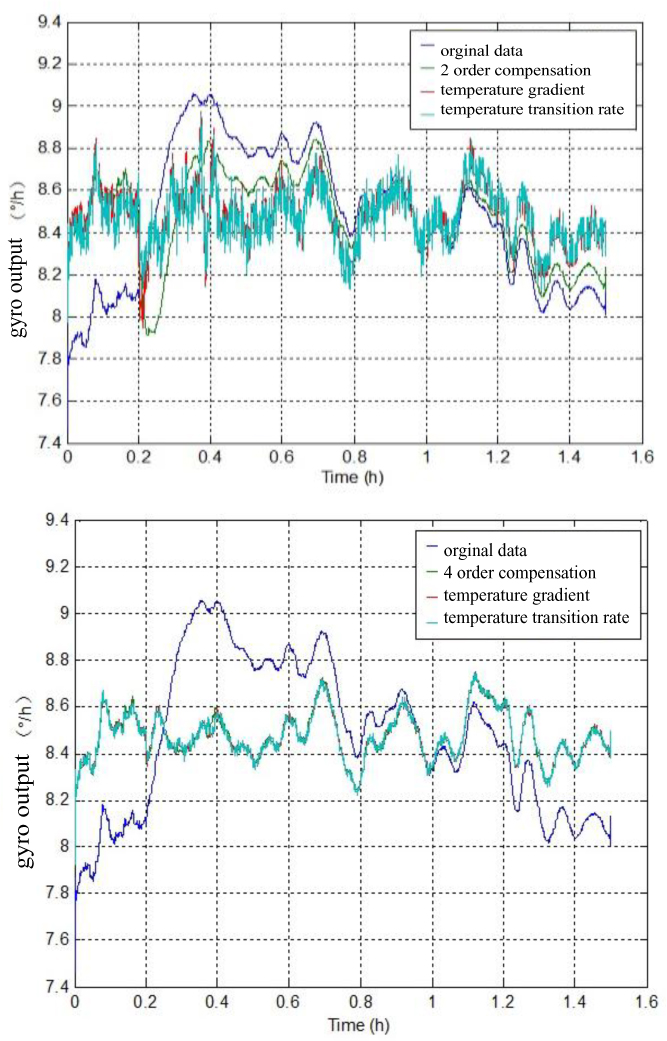
Figure 6.
Gyro output by 2\4 order polynomial compensation after temperature transition\temperature gradient\temperature transition rate