Figure 1:
Figure 2:
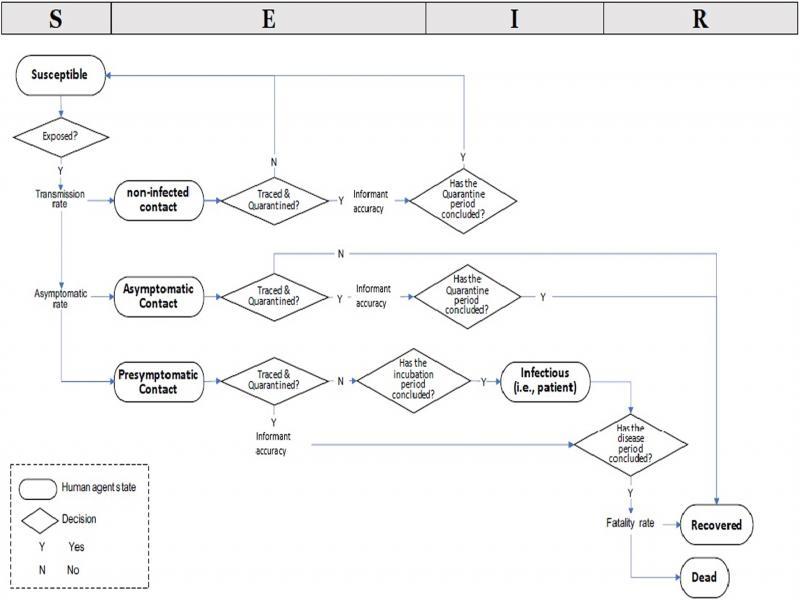
Figure 3:
Figure 4:
Figure 5:
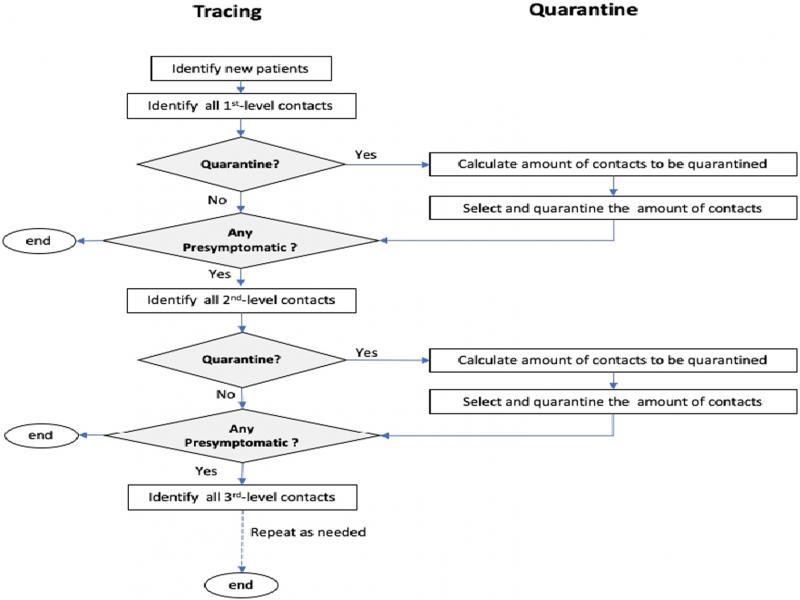
Figure 6:
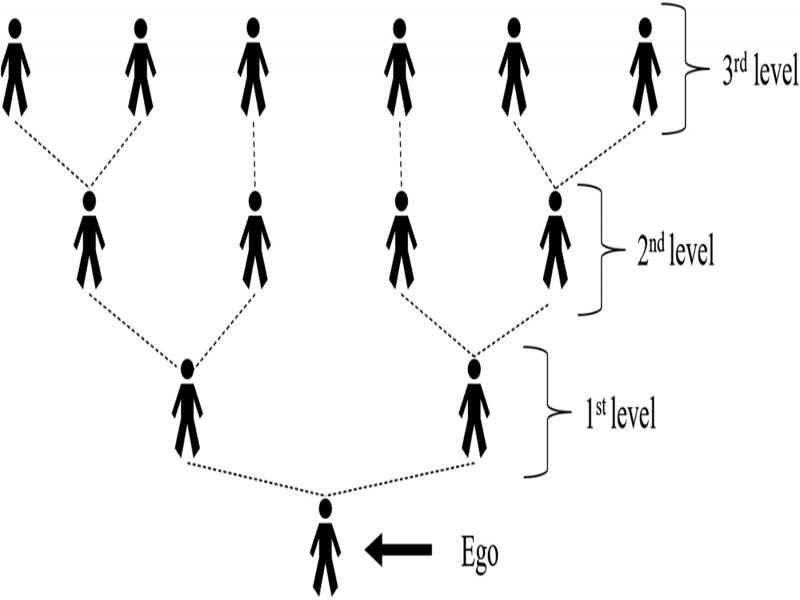
Figure 7:
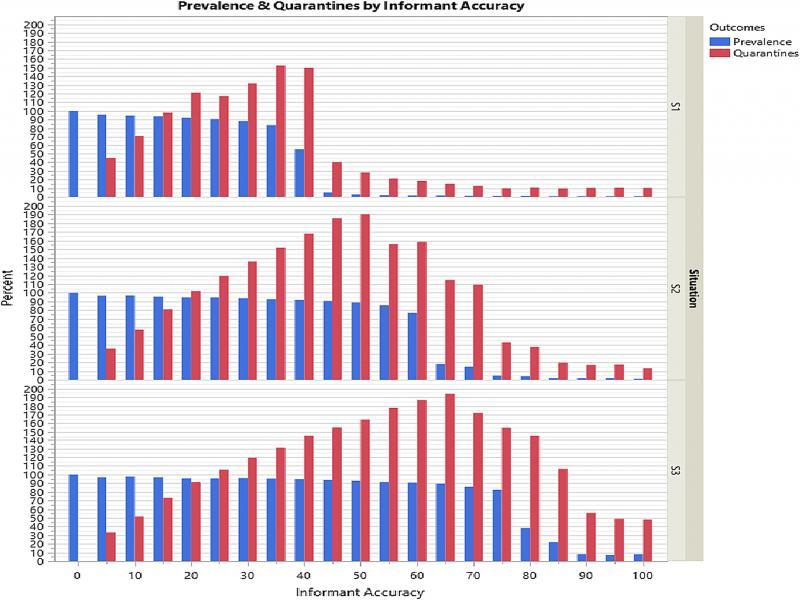
Figure 8:
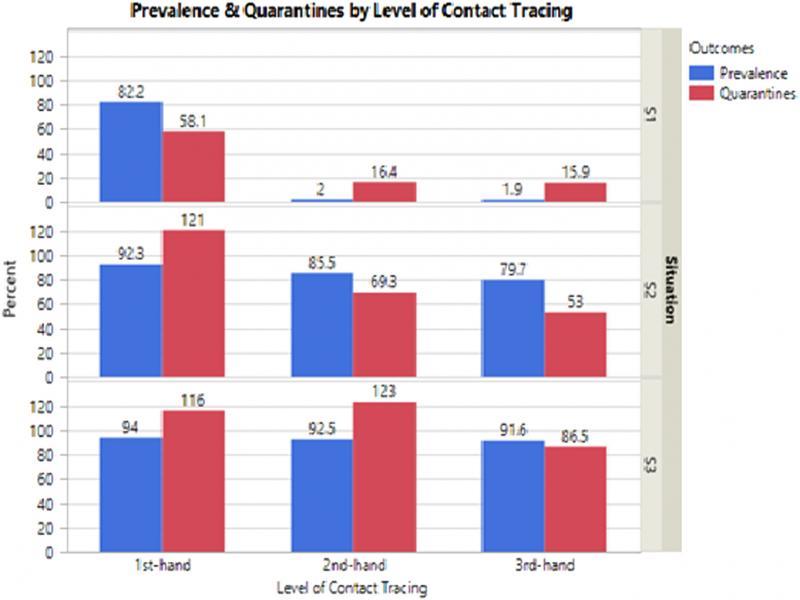
Figure 9:
Figure 10:

Three contexts of model testing and selected previous estimations_
| Current model situations | ||
| Situation | Average R0 | Context |
| S1 | 1.62 | Public health intervention like mask-wearing |
| S2 | 2.11 | R0 near lower end of best estimations, no public health intervention |
| S3 | 2.56 | R0 near higher end of best estimations, no public health intervention |
| Previous R0 estimates | ||
|
|
|
| 2.20 | Li et al. (2020) | Wuhan; January 22, 2020 |
| 2.20 | Riou and Althaus (2020) | China and overseas; January 18, 2020 |
| 2.24 | Zhao et al. (2020) | China; January 10-14, 2020 |
| 2.28 | Zhang et al. (2020) | Diamond Cruise Ship, February, 2020 |
| 2.35 | Kucharski et al. (2020a) | Wuhan; January-February, 2020 |
| 2.50 | Imai et al. (2020) | Wuhan, January 18, 2020 |
| 2.55 | Majumder and Mandl (2020) | Wuhan, December 8, and January 26, 2020 |
| 2.68 | Wu et al. (2020) | Wuhan; December 31-January, 28, 2020 |
| 2.90 | Liu et al. (2020) | China and overseas; January 23, 2020 |
Six groups of agents_
| Susceptible? | Contact? | Infected? | Symptom? | |
|---|---|---|---|---|
| Susceptible | ✓ | X | X | X |
| Non-infected contacts | ✓ | ✓ | X | X |
| Presymptomatic and asymptomatic contacts | X | ✓ | ✓ | X |
| Patients | X | X | ✓ | ✓ |
| Recovered | X | X | X | X |