Figure 1:
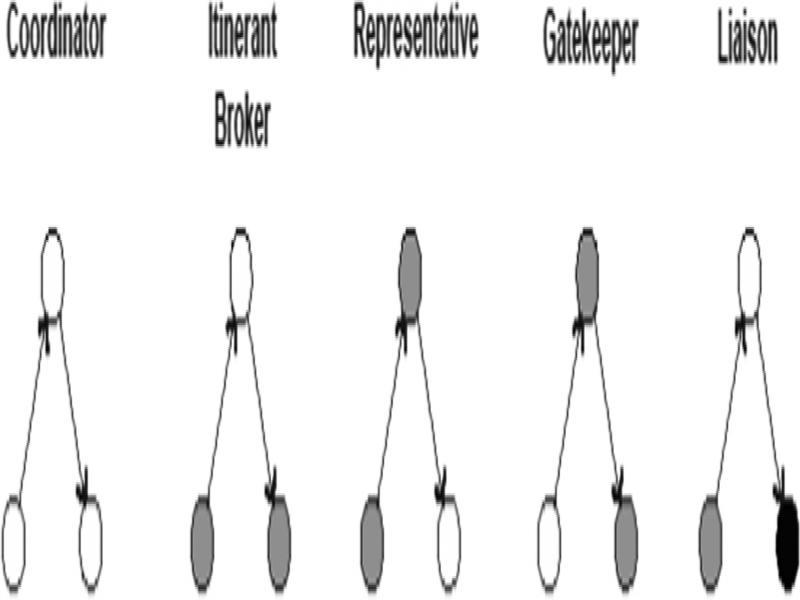
Figure 2:
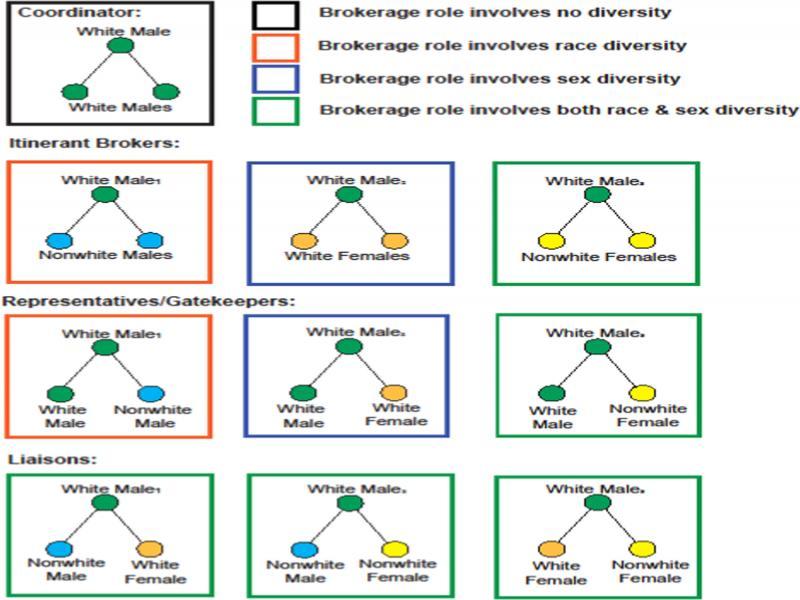
Figure 3:
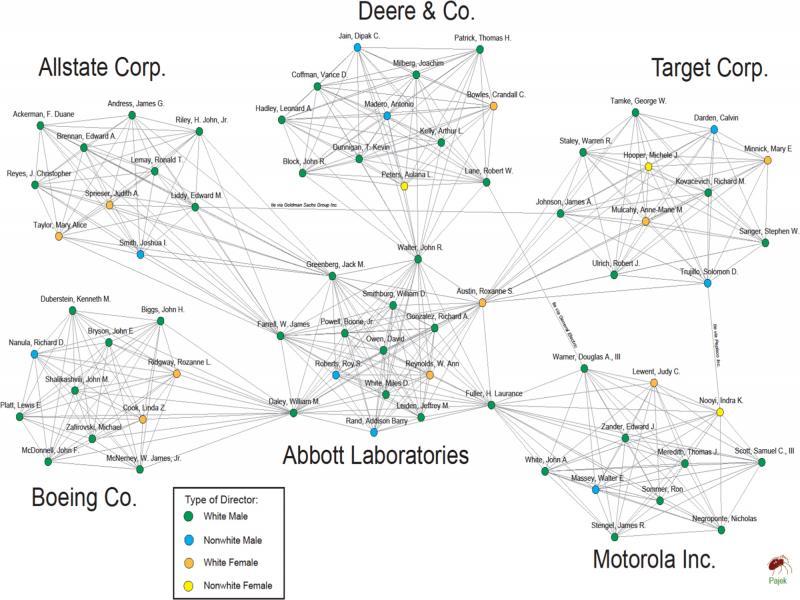
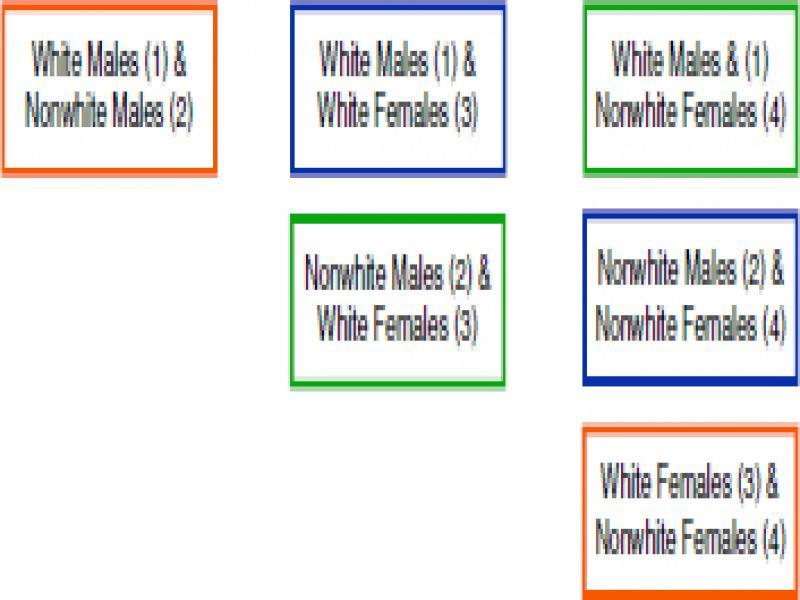

Figure 4:

Profile of the F100 corporations_
| SIC division | 2005 revenue, in $ billions | |||
|---|---|---|---|---|
| N | Ave. | Max | Min | |
| Finance, insurance, and real estate | 27 | 46.3 | 131.0 | 21.3 |
| Manufacturing | 39 | 65.1 | 339.9 | 21.3 |
| Mining | 1 | 59.0 | 59.0 | 59.0 |
| Retail trade | 15 | 62.4 | 315.7 | 23.3 |
| Services | 4 | 31.1 | 39.8 | 24.5 |
| Transportation, communications, electric, gas, and sanitary services | 9 | 38.5 | 75.1 | 22.3 |
| Wholesale trade | 5 | 53.8 | 80.5 | 28.8 |
Linear regression results: predicting 2005 (ln) total regulatory violations with brokerage-based measures of diversity_
| Standardized beta coefficients | ||||||
|---|---|---|---|---|---|---|
| Model 1 | Model 2 | Model 3 | Model 4 | Model 5 | Model 6 | |
| B | B | B | B | B | B | |
| N brokerage roles, No diversity | 0.177 | 0.012 | 0.044 | |||
| N brokerage roles, race diversity | −0.053 | −0.122 | −0.167 | |||
| N brokerage roles, sex diversity | −0.247† | −0.328* | −0.381* | |||
| N brokerage roles, both diversity | 0.164 | 0.023 | −0.032 | |||
| Percent white males (on the board) | −0.065 | −0.130 | −0.232 | |||
| Index of qualitative variation (IQV) | 0.058 | −0.029 | −0.114 | |||
| Proportion of women on interlocked boards | −0.117 | −0.100 | −0.008 | |||
| Proportion of women on interlocked boards, (excluding focal corporation) | 0.078 | 0.063 | −0.013 | |||
| Board size | −0.019 | 0.077 | 0.021 | 0.150 | ||
| Corporate degree | 0.093 | 0.341 | 0.067 | 0.397 | ||
| R 2 | 0.041 | 0.010 | 0.007 | 0.051 | 0.015 | 0.077 |
| F ratio | 1.009 | 0.200 | 0.359 | 0.839 | 0.204 | 0.643 |
Descriptive statistics for F100 corporations_
| N | Min | Max | Mean | SD | |
|---|---|---|---|---|---|
| Dependent: | |||||
| Natural log of total number of regulatory violations | 100 | −4.605 | 4.234 | 1.095 | 2.265 |
| Brokerage-based measures of diversity: | |||||
| Number of brokerage roles, no diversity | 100 | 0 | 1950 | 456.40 | 427.72 |
| Number of brokerage roles, race diversity | 100 | 0 | 1768 | 328.68 | 423.26 |
| Number of brokerage roles, sex diversity | 100 | 0 | 1244 | 330.28 | 305.52 |
| Number of brokerage roles, both diversity | 100 | 0 | 1686 | 304.82 | 348.86 |
| Competing measures of diversity: | |||||
| Proportion white males | 100 | 0.400 | 0.929 | 0.724 | 0.107 |
| Index of qualitative variation | 100 | 0.177 | 0.889 | 0.558 | 0.157 |
| Proportion of women on interlocked boards | 88 | 0.042 | 0.342 | 0.170 | 0.049 |
| Proportion of women on interlocked board (excluding focal corporation) | 88 | 0.000 | 0.300 | 0.167 | 0.054 |
| Network controls: | |||||
| Board size | 100 | 7 | 20 | 12.48 | 2.26 |
| Corporation degree | 100 | 0 | 12 | 3.86 | 2.81 |