Figure 1:
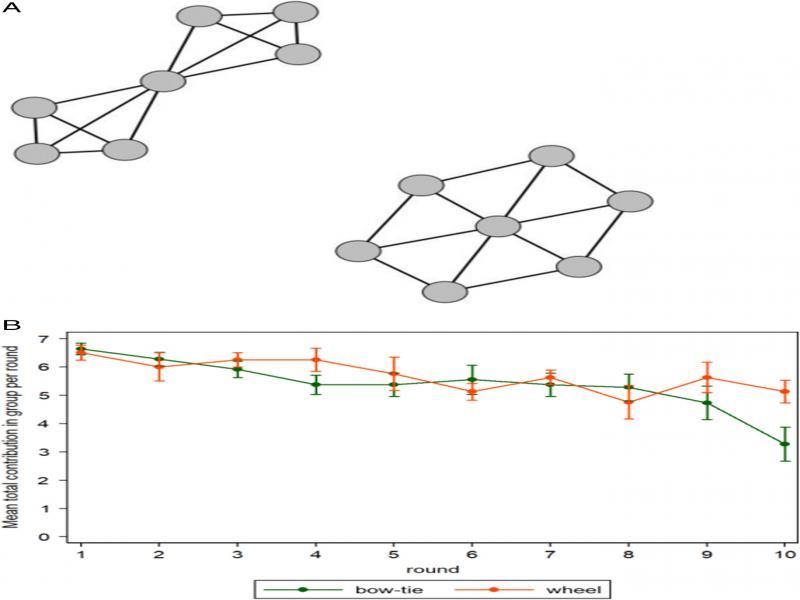
Figure 2:

Multilevel mixed-effects logistic regression model of individual contributions per round on network topology, network position, and information available to the subject_ N(level 1) = 133; N(level 2) = 19_
| Coeff. | St. Err | z | |
|---|---|---|---|
| Central | −0.050 | 0.479 | −0.104 |
| Topology: wheel | 0.391 | 0.506 | 0.773 |
| Central in wheel | 0.472 | 0.783 | 0.602 |
| Round nr. | −0.223* | 0.093 | −2.385 |
| Inconsistent gossip | −0.167 | 0.195 | −0.860 |
| Two thumbs up | −0.200 | 0.369 | −0.543 |
| Tot. contrib. | 0.373 | 1.012 | 0.369 |
| Gossip tot. pos. | 0.296 | 0.555 | 0.532 |
| Gossip tot. neg. | 0.150 | 0.402 | 0.374 |
| Cons. | 2.605 | 2.103 | 1.238 |