Figure 1:

Figure 2:
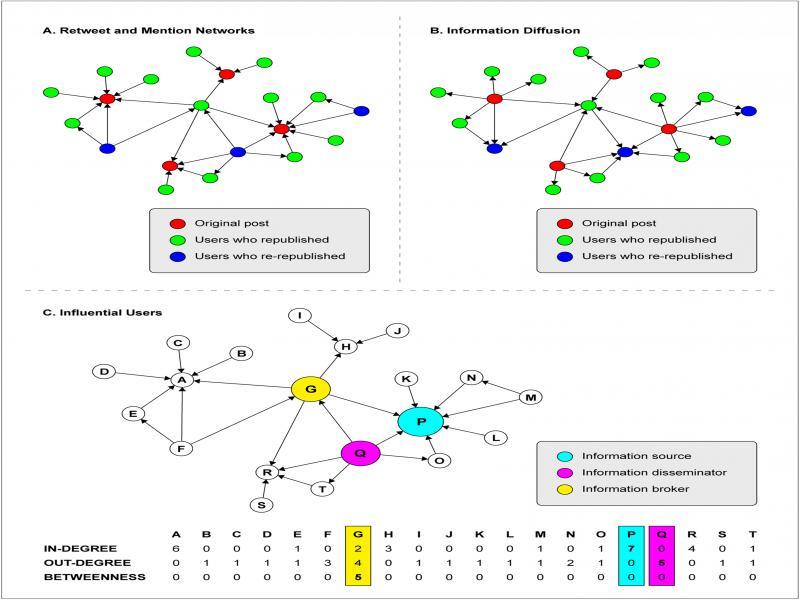
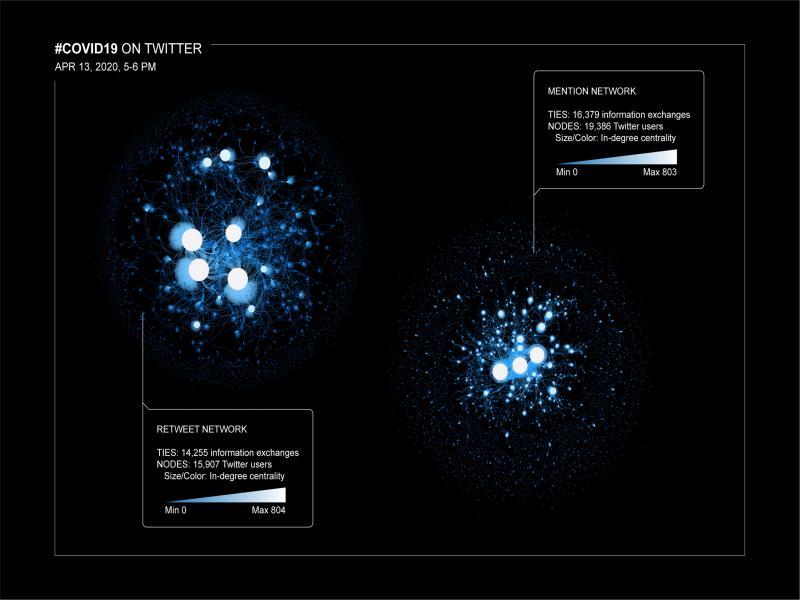
Figure 3:
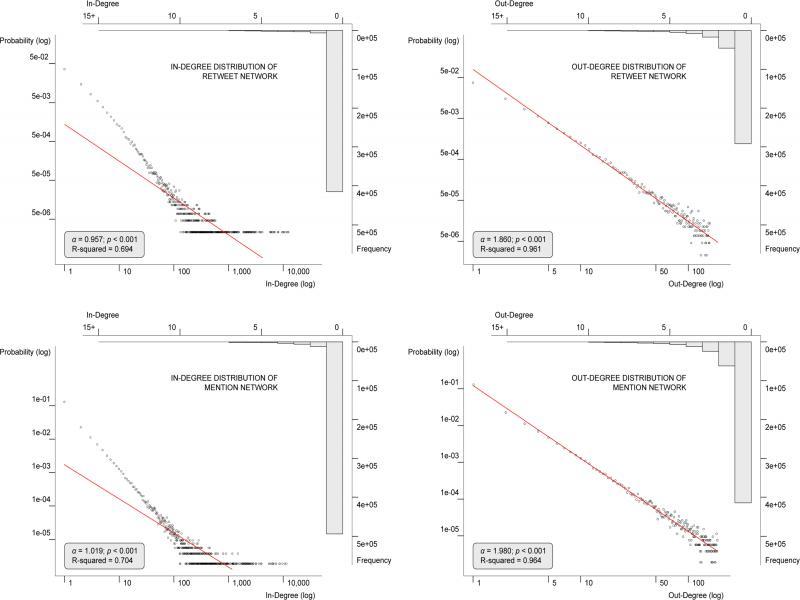
Figure 4:
Centrality statistics for influential and all other users in both networks_
| Retweet | Mention | |||
|---|---|---|---|---|
| Influential users | All users | Influential users | All users | |
| In-degree | N=100 | N=438,821 | N=100 | N=531,019 |
| Mean | 2,681 | 1.47 | 2,560 | 1.43 |
| SD | 2,689 | 58.23 | 2,364 | 48.13 |
| Median | 1,506 | 0 | 1,815 | 0 |
| Min. | 705 | 0 | 749 | 0 |
| Max. | 11,954 | 11,954 | 11,608 | 11,608 |
| Skewness | 132.10 | 140.25 | ||
| Kurtosis | 21,154.49 | 24,930.94 | ||
| Out-degree | N=100 | N=438,821 | N=100 | N=531,019 |
| Mean | 47 | 1.47 | 62 | 1.43 |
| SD | 23 | 1.78 | 29 | 2.09 |
| Median | 38 | 1 | 52 | 1 |
| Min. | 32 | 0 | 39 | 0 |
| Max. | 158 | 158 | 187 | 187 |
| Skewness | 12.43 | 13.22 | ||
| Kurtosis | 491.54 | 537.58 | ||
| Betweenness | N=100 | N=438,821 | N=100 | N=531,019 |
| Mean | 9,433,471 | 2,894.66 | 67,239,434 | 16,452.62 |
| SD | 7,976,886 | 188,252.40 | 58,763,864 | 1,230,822 |
| Median | 6,886,086 | 0 | 40,851,672 | 0 |
| Min. | 2,728,657 | 0 | 15,904,090 | 0 |
| Max. | 43,309,213 | 43,309,213 | 215,538,020 | 215,538,020 |
| Skewness | 123.89 | 125.39 | ||
| Kurtosis | 19,750.70 | 17,758.65 | ||
P-values from Fisher’s exact test comparing occupations across user roles and between networks_
| Retweet | Mention | Retweet vs. mention | |||||||
|---|---|---|---|---|---|---|---|---|---|
| 1 | 2 | 3 | 1 | 2 | 3 | 1 | 2 | 3 | |
| 1. Information sources | <0.001 | <0.001 | <0.001 | <0.001 | 0.6909 | ||||
| 2. Information disseminators | <0.001 | <0.001 | 0.2707 | ||||||
| 3. Information brokers | 0.0630 | ||||||||
Occupations of influential users in retweet and mention networks_
| Information sources (N=100) | Information disseminators (N=100) | Information brokers (N=100) | |||||||
|---|---|---|---|---|---|---|---|---|---|
| Retweet | |||||||||
| Health | 20 | Care providers | 16 (80.0%) | 3 | Care providers | 1 (33.3%) | 48 | Care providers | 29 (60.4%) |
| professionals | Researchers/Scientists | 4 (20.0%) | Researchers/Scientists | 2 (66.7%) | Researchers/Scientists | 19 (39.6%) | |||
| Communication | 16 | Media broadcasters | 3 (18.8%) | 18 | Media broadcasters | 13 (72.2%) | 13 | Media broadcasters | 4 (30.8%) |
| professionals | Journalists/Reporters | 13 (81.2%) | Journalists/Reporters | 5 (27.8%) | Journalists/Reporters | 9 (69.2%) | |||
| Government | 28 | Politicians/Policy makers | 23 (82.1%) | 3 | Politicians/Policy makers | 1 (33.3%) | 12 | Politicians/Policy makers | 6 (50.0%) |
| official | National agencies | 5 (17.9%) | National agencies | 2 (66.7%) | National agencies | 6 (50.0%) | |||
| Non-professionals | 36 | Public figures | 29 (80.6%) | 76 | Public figures | 4 (5.3%) | 27 | Public figures | 6 (22.2%) |
| Ordinary Individuals | 7 (19.4%) | Ordinary Individuals | 72 (94.7%) | Ordinary Individuals | 21 (77.8%) | ||||
| Mention | |||||||||
| Health | 19 | Care providers | 16 (84.2%) | 5 | Care providers | 2 (40.0%) | 57 | Care providers | 22 (38.6%) |
| professionals | Researchers/Scientists | 3 (15.8%) | Researchers/Scientists | 3 (60.0%) | Researchers/Scientists | 35 (61.4%) | |||
| Communication | 18 | Media broadcasters | 4 (22.2%) | 17 | Media broadcasters | 13 (76.5%) | 15 | Media broadcasters | 6 (40.0%) |
| professionals | Journalists/Reporters | 14 (77.8%) | Journalists/Reporters | 4 (23.5%) | Journalists/Reporters | 9 (60.0%) | |||
| Government | 34 | Politicians/Policy makers | 29 (85.3%) | 9 | Politicians/Policy makers | 4 (44.4%) | 16 | Politicians/Policy makers | 6 (37.5%) |
| official | National agencies | 5 (14.7%) | National agencies | 5 (55.6%) | National agencies | 10 (62.5%) | |||
| Non-professionals | 29 | Public figures | 25 (86.2%) | 69 | Public figures | 5 (7.2%) | 12 | Public figures | 8 (66.7%) |
| Ordinary individuals | 4 (13.8%) | Ordinary individuals | 64 (92.8%) | Ordinary individuals | 4 (33.3%) | ||||
Network metrics for the retweet and mention networks_
| Network | ||
|---|---|---|
| Retweet | Mention | |
| Number of nodes | 438,821 | 531,019 |
| Number of edges (directed) | 646,183 | 758,313 |
| Diameter (largest connected component) | 35 | 46 |
| Average path length | 12.09 | 16.58 |
| Reciprocity | 0.002678 | 0.004815 |
| Transitivity | 0.000161 | 0.000182 |
| Number of clusters | 12,519 | 28,528 |
| Average clustering coefficient | 0.012 | 0.008 |
| Modularity | 0.782 | 0.797 |
| Density | < 0.001 | < 0.001 |