Figure 1:
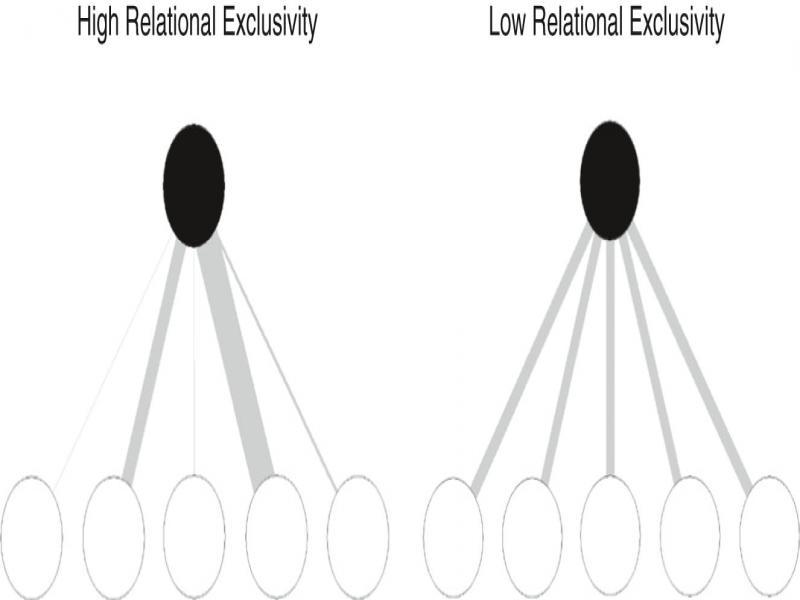
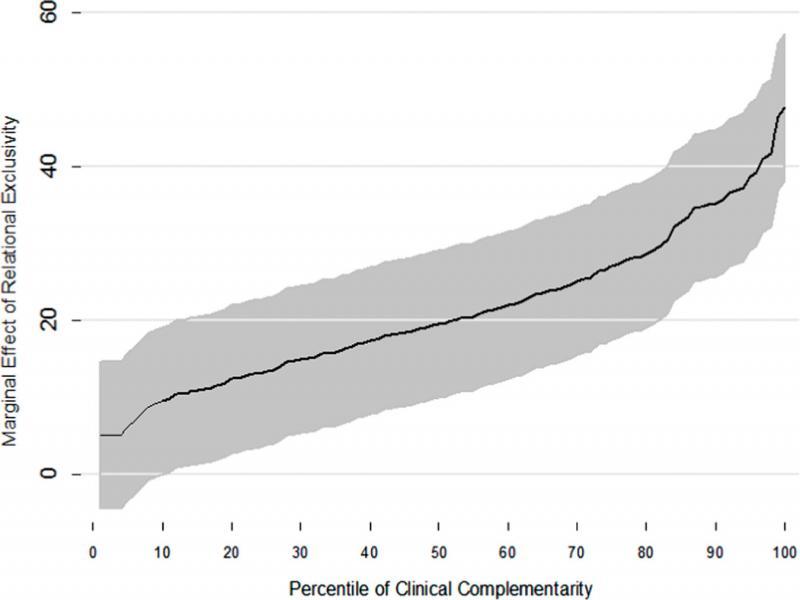
Figure 2:
The flow of referral patients by year and relative risk-standardized readmission rate_
| Patients referred to hospitals where readmission rate is | |||
|---|---|---|---|
| Year | lower (better) than in sending hospital | higher (worse) than in sending hospital | same as in sending hospital |
| 2006 | 8,524 | 9,454 | 153 |
| 2007 | 7,793 | 8,696 | 0 |
| 2008 | 7,670 | 7,869 | 0 |
| 2009 | 7,219 | 7,599 | 566 |
| Total | 31,206 | 33,618 | 719 |
Variables in the analysis: descriptive statistics and the correlation matrix_
| Variable | M | SD | 1 | 2 | 3 | 4 | 5 | 6 | 7 | 8 | 9 | 10 | 11 | 12 |
| 1. Patient benefit | −1.38 | 6.54 | ||||||||||||
| 2. Beds in focal hospital | 205.9 | 271.5 | −0.43** | |||||||||||
| 3. Average beds in partner hospitals | 398.3 | 191.9 | −0.12** | −0.06 | ||||||||||
| 4. Occupancy rate | 0.69 | 0.21 | −0.18** | 0.30** | −0.03 | |||||||||
| 5. Average distance to partners (km) | 21.86 | 16.15 | −0.15** | 0.11* | 0.01 | 0.18** | ||||||||
| 6. Private hospital | 0.46 | 0.50 | 0.18** | −0.25** | 0.03 | −0.24** | −0.41** | |||||||
| 7. Referral patients sent in year | 153.7 | 225.4 | −0.03 | 0.52** | −0.13** | 0.40** | 0.03 | −0.30** | ||||||
| 8. Referral patients received in year | 153.7 | 218.1 | −0.02 | 0.62** | −0.09 | 0.30** | −0.06 | −0.03 | 0.45** | |||||
| 9. Case mix index | 0.89 | 0.97 | −0.34** | 0.27** | 0.02 | 0.02 | −0.10 | 0.12* | −0.04 | 0.30** | ||||
| 10. Comparative performance index | 1.00 | 0.19 | −0.12* | 0.19** | 0.07 | 0.16** | 0.001 | −0.23**. | 0.14** | −0.01 | 0.02 | |||
| 11. Risk-standardized readmission rate | 0.03 | 0.04 | −0.37** | 0.19** | 0.02 | 0.04 | −0.02 | −0.10** | −0.02 | 0.07 | 0.25** | 0.15** | ||
| 12. Clinical complementarity with partners | 0.37 | 0.22 | −0.20** | 0.53** | −0.25** | 0.35** | −0.08 | −0.25** | 0.36** | 0.47** | 0.15** | 0.10 | 0.43** | |
| 13. Relational exclusivity | 0.24 | 0.23 | 0.16** | −0.37** | 0.09 | −0.25** | −0.16** | 0.30** | −0.10 | −0.03 | 0.45** | −0.40** | −0.04* | −0.18** |
Effect of relational exclusivity on patient referral to hospitals with better care quality_
| Linear regression models with two-dimensional clustering of standard errors | |||
|---|---|---|---|
| Model 1 | Model 2 | Model 3 | |
| Beds in focal hospital | −0.02** (0.004) | −0.02** (0.003) | −0.01** (0.003) |
| Average beds in referral partner hospitals | −0.004* (0.002) | −0.003 (0.002) | −0.004* (0.002) |
| Occupancy rate | −5.42** (1.86) | −3.82* (1.57) | −4.11* (1.71) |
| Average weighted distance to partners (km) | −0.01 (0.02) | −0.01 (0.02) | −0.01 (0.02) |
| Private hospital | 0.31 (0.90) | 0.17 (0.85) | −0.23 (0.83) |
| Case mix index | −1.66** (0.58) | −2.74** (0.72) | −2.73** (0.70) |
| Comparative performance index | 2.19 (1.61) | 5.04** (1.91) | 5.02* (2.00) |
| Referral patients sent in year | <0.01 (<0.01) | <0.01 (<0.01) | <0.01 (<0.01) |
| Referral patients received in year | 0.02** (<0.01) | 0.02** (<0.01) | 0.01** (<0.01) |
| Risk-standardized readmission rate | −37.75** (13.93) | −34.66* (16.45) | −34.31* (16.08) |
| Clinical complementarity with partners | ≤0.01 (2.73) | −8.95** (3.33) | |
| Relational exclusivity | 15.18** (4.26) | 5.37 (4.20) | |
| Clinical complementarity with partners × Relational exclusivity | 42.58** (14.05) | ||
| N | 390 | 390 | 390 |
| R2 | 0.50 | 0.54 | 0.58 |
| LR χ2 (relative to previous model) | − | 36.70** | 28.95** |